
Summary
Australia’s economic performance in 2024–25 reflected a continuation of modest national growth, with Gross State Product (GSP) rising 1.4%, matching the pace of the previous financial year. Growth was broad-based across all states and territories, though uneven in magnitude, with the Australian Capital Territory (ACT) again leading the nation with 3.5% GSP growth, while the large states, New South Wales (NSW) and Victoria, posted more subdued expansions. The overall pattern underscored a year driven predominantly by service-sector resilience, offset by weakness in Mining and Manufacturing, and punctuated by varied agricultural outcomes influenced by weather patterns.
National Themes and Industry Drivers
Across Australia, the economic expansion was anchored by the Health care and social assistance, Financial and insurance services, Transport, postal and warehousing, and Public administration and safety industries. These sectors reflect strong demand for health programs, elevated financial activity (including superannuation, refinancing and higher deposit balances), and a large rebound in air travel and logistics.
In contrast, Mining and Manufacturing weighed on national output. The mining sector suffered from severe weather, maintenance shutdowns, and disruptions to LNG and coal operations. Manufacturing continued its multi-year decline with broad-based weakness in metal refining and machinery & equipment production.
In per-capita terms, Australia recorded a 0.3% contraction, consistent with weak population-adjusted outcomes in many states due to high migration inflows and modest output growth.
Exhibit 1- GSP – All State Growth Dispersion
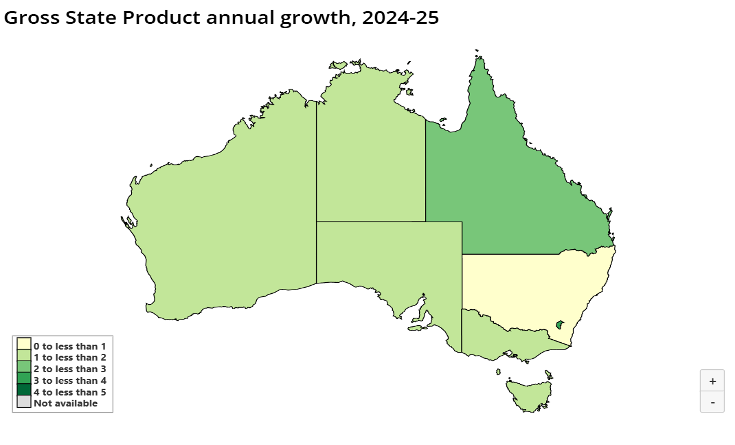
Data Source: ABS
State-by-State Analysis
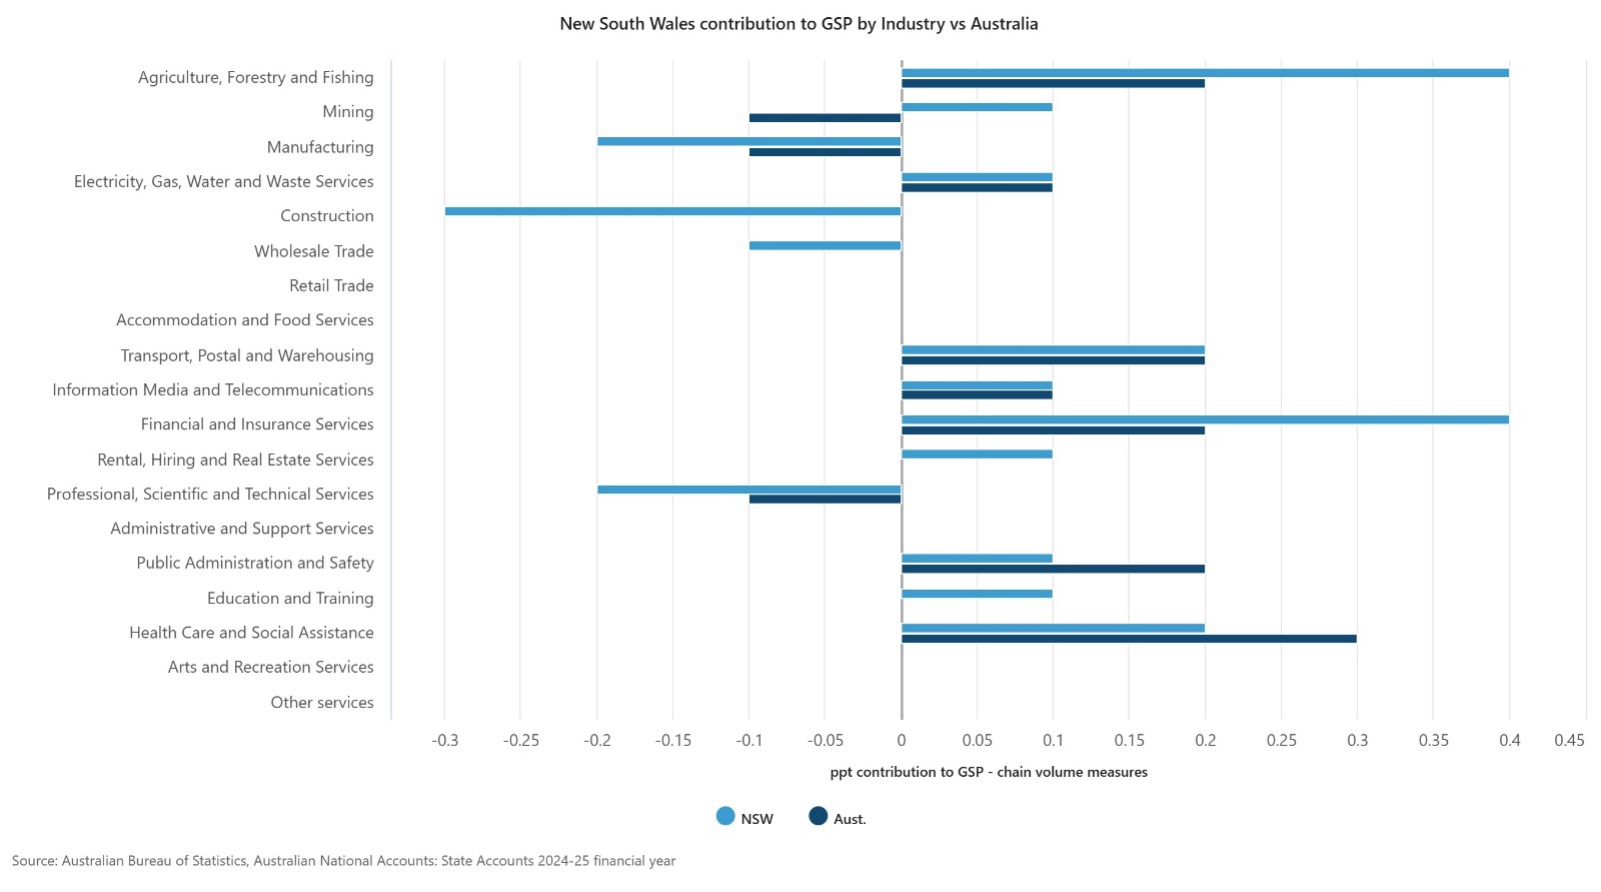
New South Wales (GSP +0.9%; per capita −0.3%)
NSW recorded modest growth, down from 1.1% the previous year. The largest positive contribution came from Agriculture (25.5%), reflecting a strong grain harvest and livestock recovery. Financial services (+3.8%) and Health care (+3.0%) also supported output.
The most significant drag was Construction (−4.1%), with major transport and health infrastructure projects nearing completion and a slowdown in heavy civil activity. Professional, scientific and technical services fell 2.4%, mirroring the infrastructure planning downturn.
Exhibit 2: GSP by Industry – NSW/ National
Victoria (GSP +1.1%; per capita −0.8%)
Victoria’s economy expanded slightly above NSW but below last year’s 1.4%. Growth was driven by the service economy—Financial & insurance services (+2.6%), Health care (+2.5%), and Transport, postal and warehousing (+2.4%). However, Professional services (−3.3%) detracted sharply due to reduced demand for accounting, engineering consulting and defence-related services.
Queensland (GSP +2.2%; per capita +0.4%)
Queensland delivered the second-strongest performance nationally. Agriculture soared 10%, benefiting from favourable weather. Construction grew 3.1%, reflecting strong dwelling activity and major transport infrastructure. Professional services also rose 4.2%, supported by a substantial infrastructure pipeline.
The key drag was Mining (−3.8%), with weather conditions and softer demand impacting both coal and LNG.
South Australia (GSP +1.0%; per capita −0.1%)
SA’s growth was moderate, led by Construction (+5%), particularly residential building, as well as strong results in Financial services (+4.7%) and Health care (+2.4%).
Agriculture was the major negative contributor, declining 13.8% due to severe drought conditions and reduced crop yields.
Western Australia (GSP +1.3%; per capita −1.1%)
WA grew modestly, driven by Construction (+4.4%), particularly residential construction supported by strong population gains. Agriculture jumped 14.6% on bumper grain harvests, while Wholesale trade (+5.9%) strengthened due to machinery and basic materials wholesaling.
Mining (−0.6%) detracted as weather disruptions and maintenance reduced oil and gas output. Iron ore volumes were steady due to new capacity offsetting shutdown impacts.
Tasmania (GSP +1.0%; per capita +0.7%)
Tasmania benefited from Agriculture (+6.7%), especially aquaculture and dairy, and from Health care (+2.3%). However, Construction (−3.5%) declined due to weakness in residential building activity.
Northern Territory (GSP +1.0%; per capita −0.2%)
The NT posted moderate growth, led by Agriculture (+12.8%), primarily livestock, and Transport (+9.8%) due to strong air transport and freight services. Mining fell (−1.5%) due to weather-related reductions in oil and gas production.
Australian Capital Territory (GSP +3.5%; per capita +2.1%)
The ACT was the strongest performer yet again. Public administration & safety (+7.2%) led growth, driven by increased public sector activity and the 2025 Federal election. Health care (+3.3%) also expanded.
Construction (−5%) was a major drag, particularly in non-residential building, and residential construction also weakened.
Real Gross State Income and Current Price Outcomes
Real Gross State Income (RGSI) showed significant variation:
- ACT posted the highest RGSI growth (+3.7%)
- WA (−2.2%) and QLD (−0.5%) recorded declines due to falling commodity prices and mining disruptions
- National RGSI fell 0.3%, reflecting lower terms-of-trade benefits.
In current prices, nominal GSP grew 3.7% nationally. Growth was strongest in the ACT (+6.9%), South Australia (+5.0%), and Victoria (+4.7%). WA lagged (+0.7%) due to softer commodity revenues.
Key Structural Trends
- Service Economy Supremacy
Service industries accounted for most of Australia’s GSP growth. Health care alone contributed strongly across all jurisdictions, reflecting rising demographic and policy-driven demand.
- Volatile Agricultural Performance
Weather remained a decisive factor, with Queensland and WA experiencing bumper harvests while South Australia endured drought-driven declines.
- Mining Under Pressure
Mining weakened nationwide, reflecting weather disruptions, maintenance shutdowns, and subdued global demand, particularly in LNG. This affected both GSP and RGSI.
- Construction Divergence
Residential construction was strong in high-migration states (Queensland, WA), while NSW and ACT saw large declines as major projects neared completion.
Conclusion
The 2024–25 State Accounts reveal an Australia growing steadily but unevenly. While national GSP growth stayed at 1.4%, the service-driven expansion contrasted with significant sector-specific weaknesses, especially in Mining and Manufacturing.
Population-driven pressures resulted in per-capita contractions in most states except Queensland, Tasmania and the ACT. Weather-driven agricultural outcomes played outsized roles in certain jurisdictions, and construction trends diverged sharply depending on project cycles and population growth.
Overall, the economic landscape reflects a nation transitioning through cyclical softness in goods-producing industries while relying on structural growth in services and population-driven demand.