
Australia’s Economic Crossroads: Persistent Inflation Pressures Test Monetary Policy Patience
The Reserve Bank of Australia finds itself at a critical juncture as it navigates an economic landscape characterized by stronger-than-expected inflation, moderate growth, and a labor market that refuses to loosen as anticipated. The central bank’s November 2025 Statement on Monetary Policy reveals an economy that continues to defy simple categorization, growing steadily but facing persistent capacity pressures that threaten to keep inflation elevated longer than policymakers had hoped.
The Inflation Surprise That Changed Everything
The September quarter 2025 delivered a stark reminder that Australia’s path back to price stability remains uncertain. Underlying inflation, measured by the trimmed mean, surged to 1.0 per cent in quarterly terms, notably higher than the expected steady pace that would have been consistent with the midpoint of the RBA’s 2-3 per cent target range. This unexpected acceleration pushed year-ended underlying inflation to 3.0 per cent, forcing a fundamental reassessment of capacity pressures in the economy.
The inflation surprise was broad-based but particularly pronounced in sectors that typically reflect domestic demand pressures. New dwelling construction prices increased by 1.1 per cent in the quarter, well above forecasts, as builders reduced discounts and raised base prices in response to improving housing market sentiment. Market services’ inflation also picked up sharply, with restaurant meals and takeaway food prices showing notable strength, potentially reflecting both difficulties finding staff and rising costs for food inputs.
Exhibit 1- Consumer Price Inflation
Headline inflation told an even starker story, reaching 3.2 per cent in year-ended terms. While this was significantly stronger than the 2.5 per cent expected in August, much of the headline strength reflected the partial unwinding of household electricity rebates, which temporarily boosted out-of-pocket costs for consumers. Excluding these administrative factors, the underlying momentum in prices suggests more persistent inflationary pressure than previously assessed.
The RBA now forecasts that underlying inflation will remain above the 2-3 per cent target range until the second half of 2026. More significantly, assuming the cash rate follows the market path, which now embodies only 30 basis points of easing over the next year, inflation is expected to settle at “a little above the midpoint” of the target range by the end of 2027, rather than at the midpoint itself.
A Labor Market That Defies Easy Interpretation
Australia’s labor market continues to send conflicting signals that complicate the RBA’s assessment of spare capacity. The unemployment rate increased to 4.5 per cent in September 2025, averaging 4.3 per cent for the quarter, slightly above the August forecast. On the surface, this suggests some easing in labor market tightness.
Yet a deeper examination reveals a labor market that remains considerably tighter than headline unemployment might suggest. The underemployment rate, despite ticking up in September, remains at historically low levels and has actually declined since mid-2024. The ratio of job vacancies to unemployed workers, while easing from peaks, remains above historical averages.
Most tellingly, the share of firms reporting labor availability as a significant constraint on output continues to run well above long-term norms.
The quits rate, the proportion of workers voluntarily leaving jobs, has recently increased after declining through much of the tightening phase. This reversal suggests that inter-firm competition to attract and retain staff may be intensifying again, pointing to tighter rather than looser conditions. Meanwhile, the layoffs rate has trended downward and remains at low levels by historical standards, hardly the pattern one would expect if the labor market were genuinely softening.
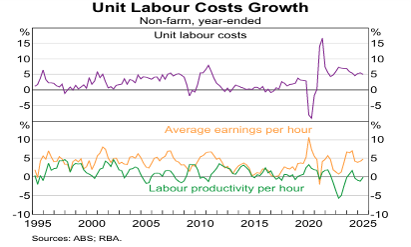
Unit labor costs, the most comprehensive measure of labor cost pressures facing firms, increased by 5.0 per cent over the year to June 2025, well above the long-run average. This elevated growth reflects not just above-average wage increases but persistently weak productivity growth. Non-farm labor productivity actually declined by 0.1 per cent over the year, meaning that firms’ labor costs per unit of output are rising substantially faster than wages alone would suggest.
The RBA’s suite of economic models continues to estimate that the unemployment rate consistent with full employment, the point at which the labor market is in balance, is lower than the current rate. This implies that despite the recent uptick, the labor market may still be operating with insufficient spare capacity to generate sustained disinflationary momentum
Exhibit 2: Unit Labour Cost and Productivity
GDP Growth Recovery: Composition Matters
Australian economic growth has recovered from the weakness of 2024, but the nature of that recovery carries important implications for inflation dynamics. GDP growth picked up to 0.6 per cent in the June quarter 2025, bringing year-ended growth to 1.8 per cent, close to, but still slightly below, estimates of potential growth.
Critically, the composition of growth has shifted in ways the RBA had anticipated. Private demand has strengthened as real household incomes recovered following the decline in inflation and the implementation of Stage 3 tax cuts. Household consumption grew by 0.9 per cent in the June quarter, above expectations, with growth broad-based across both essential and discretionary categories. For the first time since June 2023, consumption increased in per capita terms, signaling that households are becoming more willing to spend.
Simultaneously, public demand growth has moderated. Public investment unexpectedly declined in the first half of 2025 as infrastructure projects reached completion. Information from the RBA’s liaison program suggests that the pipeline of public infrastructure work, while remaining at high levels, is likely around its peak. Several large transport projects are nearing completion, and new projects are unlikely to fully offset declining transport infrastructure spending, particularly in New South Wales and Victoria.
This transition from public to private demand leadership has important productivity implications. Market sector employment growth has picked up while non-market sector employment growth has slowed, exactly the pattern the RBA expected would support improved aggregate productivity growth.
However, this adjustment also helps explain why overall employment growth has been weaker than GDP growth would normally suggest, as market sector productivity is typically measured as being higher than non-market sector productivity.
Housing Market Momentum Builds
Perhaps no sector better illustrates the transmission of easier monetary policy than housing. Following three cash rate reductions totaling 75 basis points since February 2025, housing market activity has accelerated more quickly than the RBA anticipated.
National housing prices grew by 2.2 per cent in the September quarter, with the pace of appreciation picking up more quickly than in previous monetary policy easing phases. Auction clearance rates have risen to 18-month highs above 70 per cent, and market conditions remain tight. Housing credit growth has accelerated above its post-global financial crisis average, driven particularly by investor lending, which has increased to its highest rate since 2015.
The introduction of the Australian Government’s 5% Deposit Scheme in October 2025 is expected to add further upward pressure on housing prices. Unlike previous iterations of the Home Guarantee Scheme, the new program has no income caps, no limits on take-up, and significantly higher property price caps (reaching $1 million or more in some capital cities). This removes barriers for first-home buyers to enter the market with smaller deposits, but in a supply-constrained market, the likely effect is to push prices higher.
Dwelling investment has responded to these improved market conditions, increasing by around 5 per cent in year-ended terms by the June quarter. Building approvals had picked up from mid-2024, and builders have been working through an elevated pipeline with capacity constraints having eased as some large public infrastructure projects completed. However, the pick-up in building approvals has been modest since the first cash rate cut in February, suggesting that much of the supply response occurred in anticipation of policy easing rather than in response to it.
Exhibit 3: National Housing Prices
The Capacity Pressure Puzzle
The central challenge facing the RBA is accurately assessing how much spare capacity exists in the Australian economy. This assessment is fundamental to forecasting inflation, yet the evidence points in different directions.
Measures of capacity utilization have recently turned higher, reversing part of their earlier decline. The NAB measure of capacity utilization has picked up, particularly in construction and retail sectors, and remains above its historical average. This suggests businesses are using their labor and capital resources at higher-than-normal rates to meet demand. Residential vacancy rates also show utilization of the housing stock remains elevated.
The September quarter inflation outcome, particularly the strength in housing and market services components, points toward more capacity pressure than previously assessed. These sectors are generally reflective of domestic demand conditions, and their unexpected strength suggests that the balance between demand and supply may be tighter than headline economic indicators imply.
Set against this, some indicators suggest the economy may be closer to balance. The unemployment rate has increased, the participation rate has edged lower, and employment growth has slowed. If these trends continue, they would indicate growing spare capacity that should, with the usual lags, translate into moderating inflation.
The RBA has revised its assessment to reflect “slightly more capacity pressure” than previously thought. This judgment reflects the strong inflation data, increased capacity utilization, the partial reversal in the quits rate decline, and continued elevated unit labor cost growth. Importantly, it also implies that the economy was somewhat further from balance in August 2025 than the RBA assessed at the time.
The Path Ahead: Patience Required
The RBA’s November decision to hold the cash rate target unchanged at 3.60 per cent reflects this reassessment of capacity pressures. Market expectations for further rate cuts have been substantially revised, with participants now pricing only 25 basis points of easing by mid-2026, compared to expectations of 50-75 basis points of cuts at the time of the August Statement.
The central forecast, conditioned on this more restrictive market path, sees GDP growth stabilizing around 2 per cent, close to potential, over the forecast period. The unemployment rate is expected to increase only slightly further and stabilize at close to 4½ per cent. Underlying inflation is forecast to decline gradually but remain above 3 per cent until mid-2026, eventually settling a little above the target midpoint by late 2027.
This outlook embodies several key judgments that carry significant uncertainty. The RBA assumes that the boost to growth from monetary policy easing will offset the diminishing support from earlier real income gains and the Stage 3 tax cuts, resulting in stable growth around potential. It assumes the labour market will not ease much further from current levels. And it assumes that the slightly elevated capacity pressures will keep inflation above target for an extended period, but that these pressures will gradually dissipate.
Risks Remain Balanced but Significant
The risks around this central outlook are substantial. On the domestic front, demand could undershoot or overshoot potential supply growth. A scenario analysis suggests that if housing price growth continues at recent strong rates, say an additional 10 per cent increase beyond the baseline, GDP would be 0.7 per cent higher by the end of the forecast period, with trimmed mean inflation ¼ percentage point higher.
The labor market could also evolve quite differently. If the recent increase in unemployment proves to be the start of a more pronounced easing, or if participation rates resume their upward trend, spare capacity would open up more quickly than forecast. Conversely, market sector employment could rebound more strongly, causing unemployment to decline again.
Perhaps most significant is the possibility that the RBA has misjudged the current degree of capacity pressure. Model-based estimates continue to suggest the labor market and economy are tighter than other indicators imply. If those models are correct, inflation may prove even more persistent than currently forecast. Alternatively, if the September quarter inflation surge was driven primarily by temporary factors like the unwinding of discounting or volatile food input costs, the RBA may be overstating capacity pressures and undershooting on how quickly inflation will decline.
Globally, downside risks to growth remain, reflecting persistent uncertainty around trade policies and their economic impact. While the likelihood of a severe “trade war” scenario has diminished since earlier in the year, GDP growth in Australia’s major trading partners is expected to slow over the second half of 2025 and into 2026 as higher tariffs weigh on activity.
A Test of Policy Credibility
The RBA’s navigation of this complex environment will test both its forecasting capabilities and its policy credibility. Having brought inflation down from peaks above 7 per cent, the central bank now faces the arguably more difficult task of completing the final leg of the journey back to target while maintaining economic growth and employment near their sustainable rates.
The Statement’s acknowledgment that inflation will remain above target until mid-2026 and will settle above the midpoint thereafter, represents a significant extension of the timeline for achieving the inflation objective. Market economists have taken note, with a majority now expecting no further rate cuts through 2026, and some suggesting this easing phase may already be over.
For Australian households and businesses, this means an extended period of adjusting to an economy operating with limited spare capacity, persistent inflation pressures, and interest rates that, while lower than their peaks, will remain above the ultra-low settings that prevailed for much of the past decade. The RBA’s November Statement makes clear that the path back to price stability, while well underway, remains longer and more uncertain than hoped.