
As of June 29, 2025, the U.S. macroeconomic landscape presents a concerning picture, driven by revised economic data and significant developments from the past week. The following analysis focuses on key indicators and recent global events.
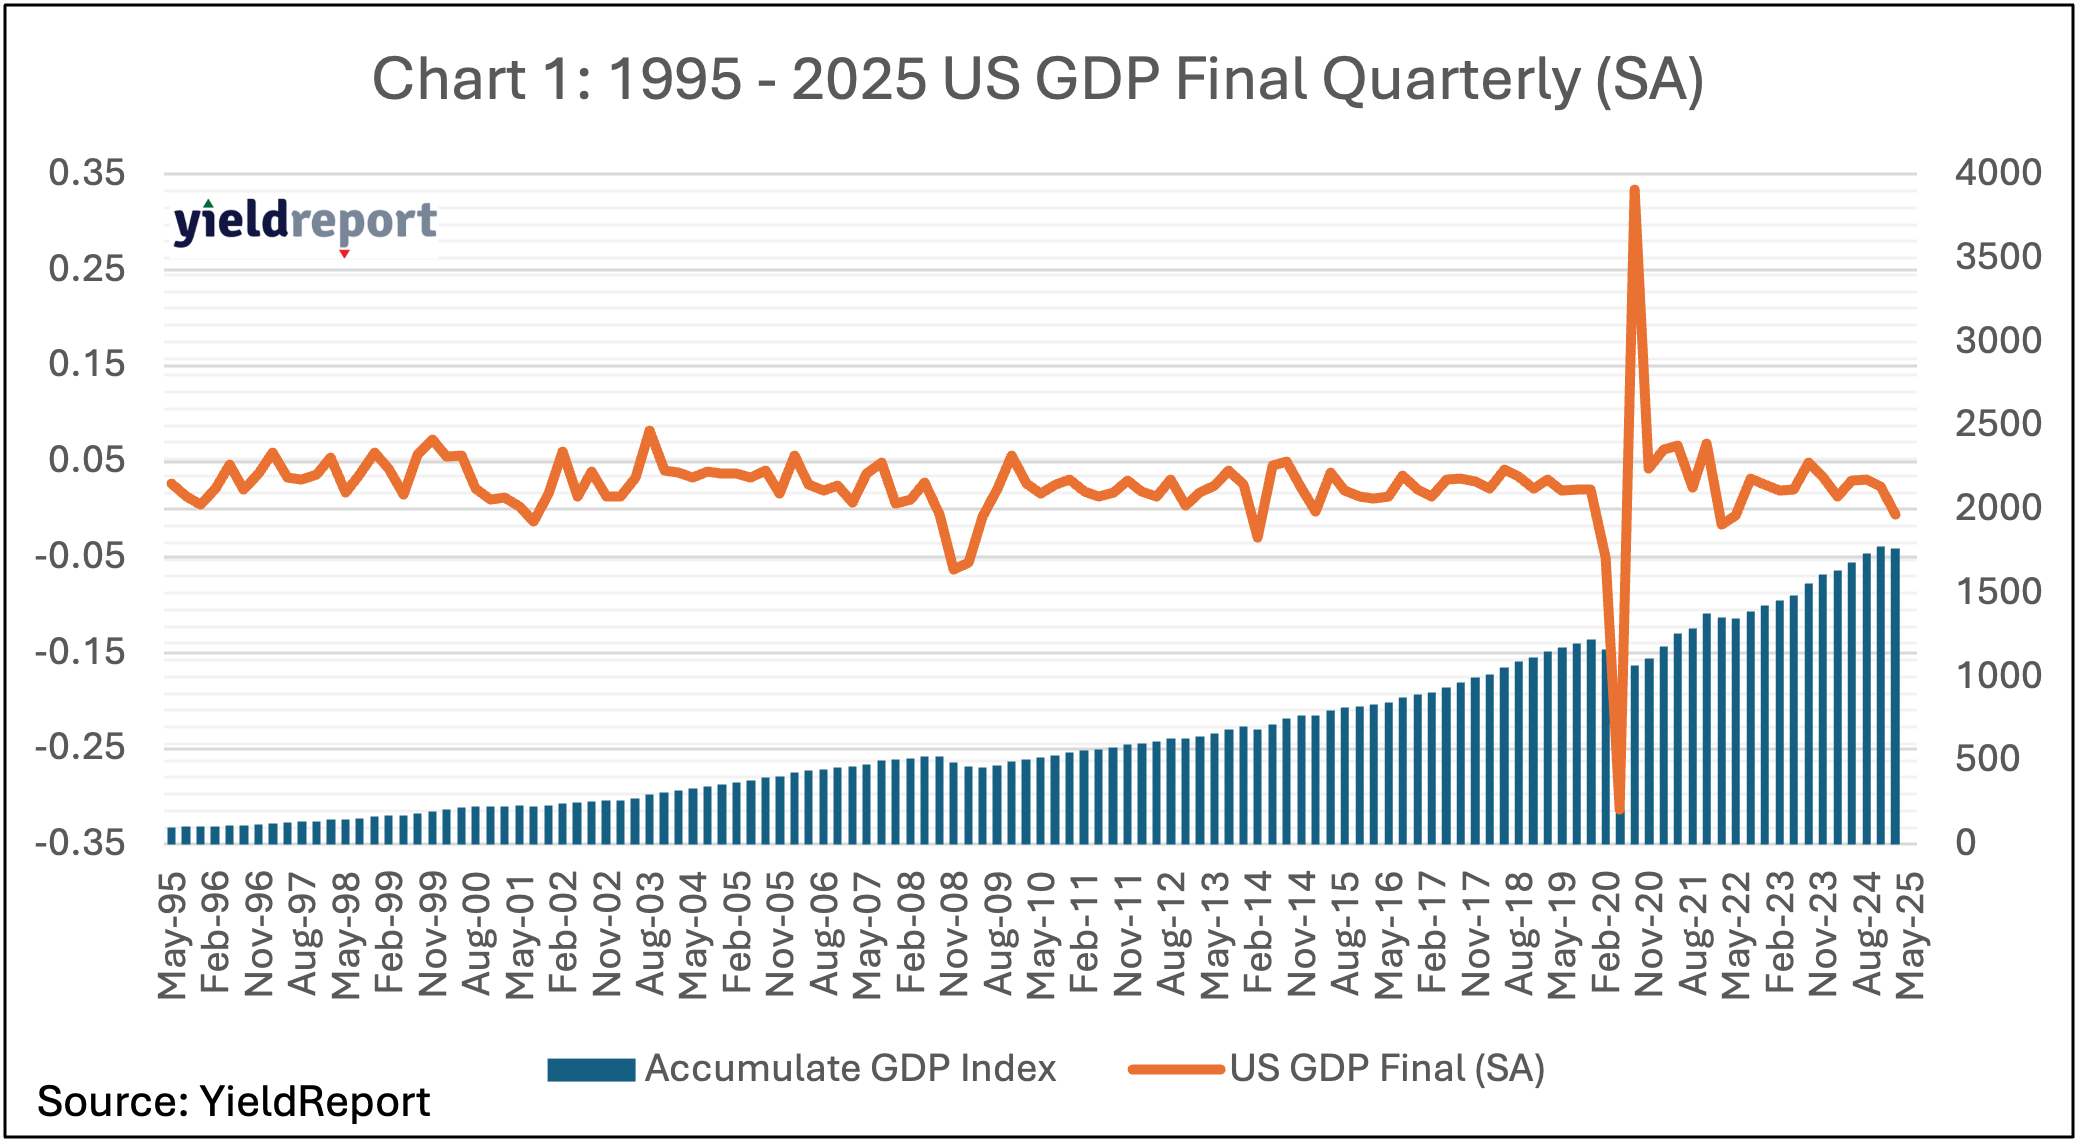
The 1995-2025 U.S. GDP Final Quarterly (SA) chart reveals a long-term growth trend, with the accumulated GDP index rising steadily. However, the latest adjustment to Q1 2025 data, revised from -0.2% to -0.5%, indicates the U.S. economy shrank more than initially thought in early 2025. This deeper contraction, driven by increased imports and reduced government spending, underscores heightened recession risks and a more pronounced slowdown than previously estimated.
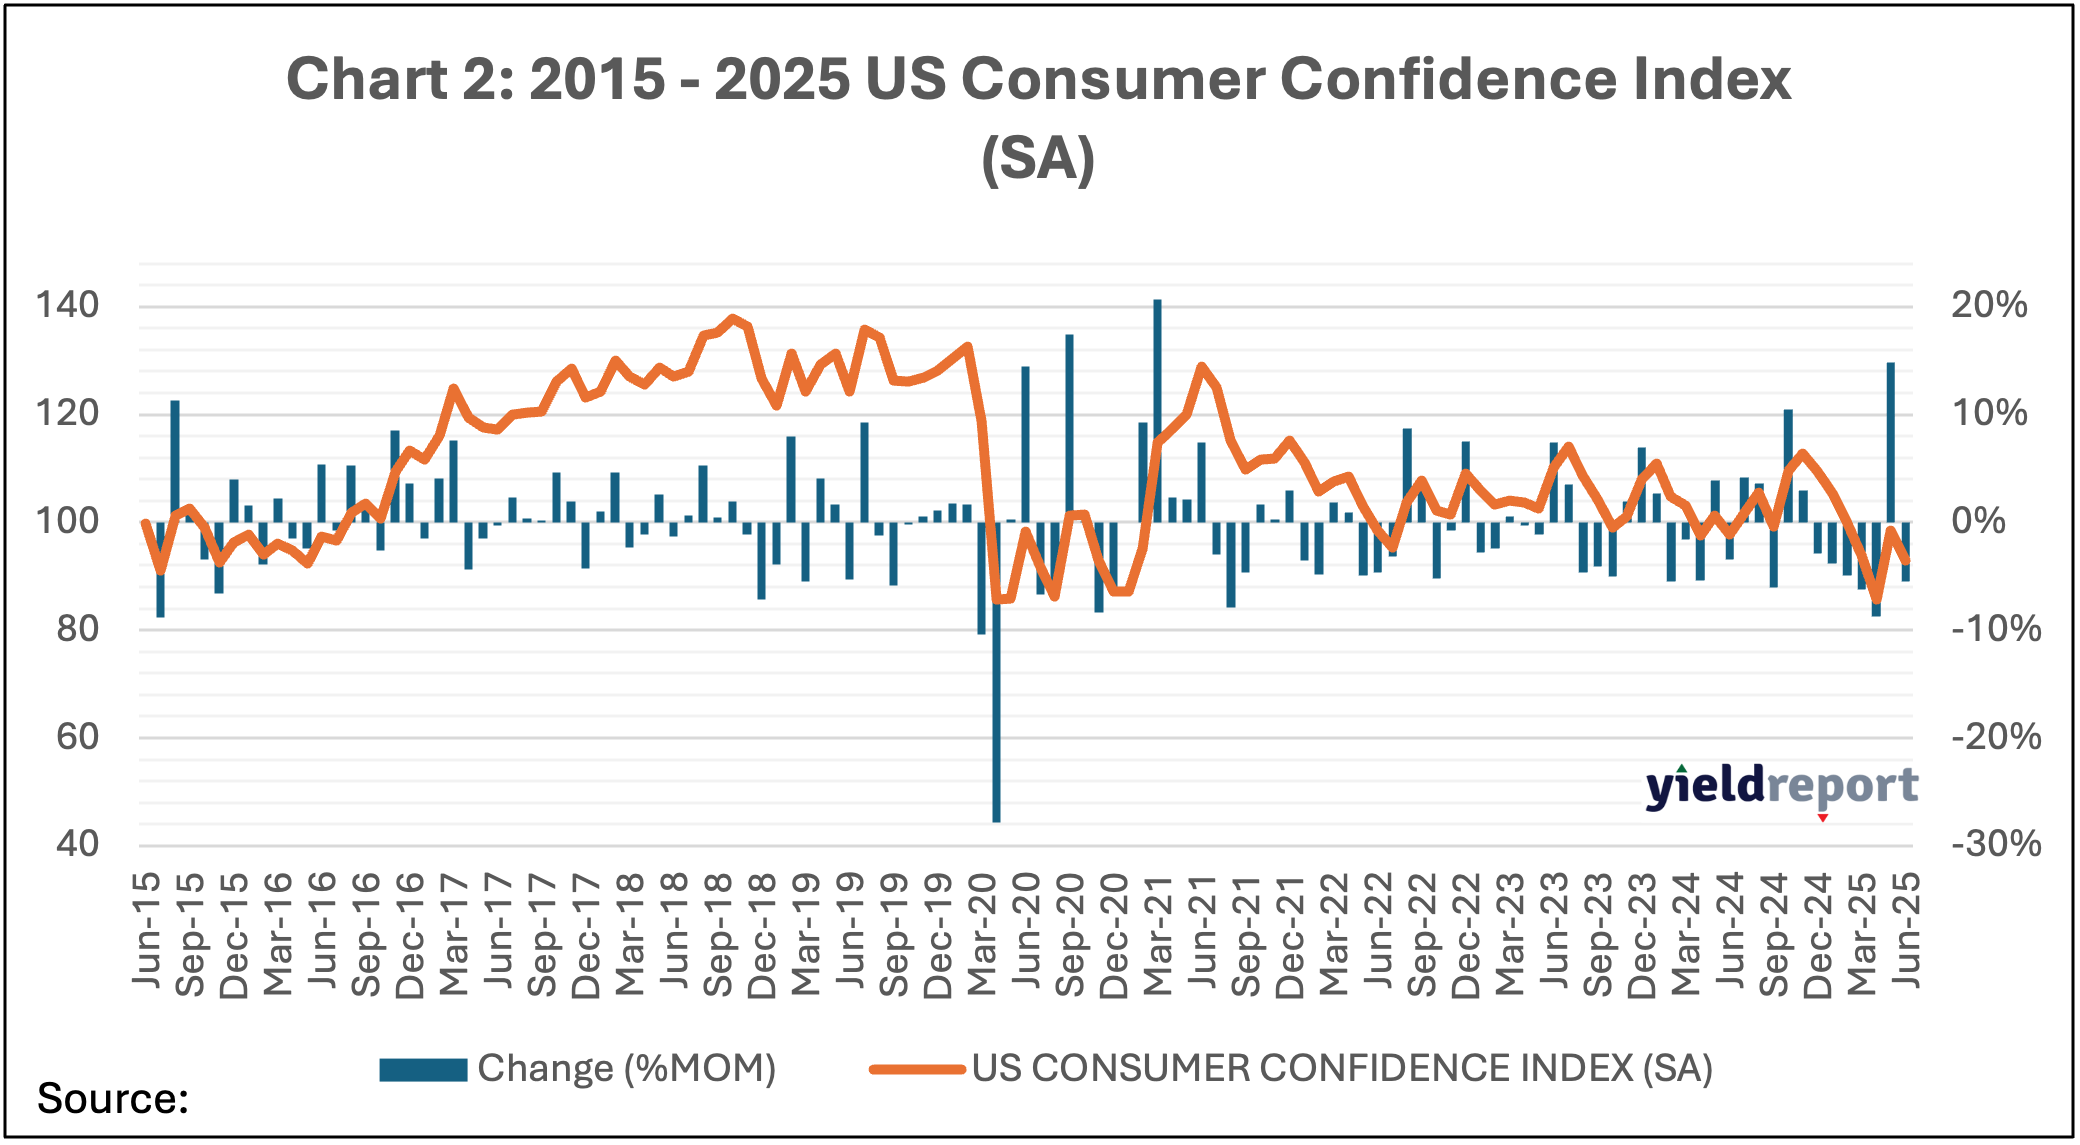
The 2015-2025 U.S. Consumer Confidence Index (SA) chart reflects a volatile recovery since the 2020 pandemic low, with recent stabilization around 90-100 now under pressure. The latest index fell to 93.0 in June from 98.4 in May, indicating a broad decline in sentiment due to weaker assessments of current business conditions and future expectations. This growing pessimism is tied to persistent inflation and tariff uncertainties, particularly with U.S.-China trade tensions.
Looking ahead, the Federal Reserve’s steady federal funds rate of 4.25%-4.50% signals a cautious stance, awaiting clearer economic indicators amid these challenges. The deeper Q1 GDP contraction and softening consumer sentiment heighten recession concerns, though moderating inflation trends provide some hope. Policymakers must closely monitor trade dynamics, industrial recovery, and consumer behaviour to mitigate risks.
Recent big news from last week adds further complexity. A ceasefire between Israel and Iran, brokered by President Trump and announced on June 25, has brought temporary stability to the Middle East, reducing immediate oil price volatility. However, the deal’s fragility, tied to U.S. strikes on Iranian nuclear sites, raises concerns about potential trade route disruptions if tensions resurface. Simultaneously, the U.S.-China trade deal finalised in London on June 10-11, following intensive talks, saw both nations agree to lower tariffs and lift some export restrictions, including China’s release of rare earth minerals critical to U.S. industries. Yet, the deal’s limited scope—essentially reinstating a May truce—suggests ongoing trade uncertainties, with markets showing muted enthusiasm. Additionally, the EU’s announcement on June 20 of the Readiness 2030 program, committing up to €800 billion to bolster its military-industrial base, signals a strategic pivot away from U.S. reliance, potentially increasing defence costs and impacting U.S. export markets. These developments collectively pose both opportunities and risks for the U.S. economy, necessitating vigilant policy responses.
About YieldReport – Your Income Advantage
YieldReport is Australia’s leading online data and research platform for interest rate markets, securities and products that focus on fixed income and yield generation. YieldReport provides advice, news review, analysis and insights on what’s shaping the yield curve and fixed income markets. It also provides a great source of reference for pricing and performance data on yield-generating investment opportunities, including cash, term deposits, government and semi-government bonds, managed funds, ETFs, corporate bonds, floating rate notes, hybrids as well as other yield instruments. YieldReport insights and analyses are designed to help anyone managing money, whether it be their own or whether they sit on a finance committee, board etc. – to make informed decisions about where interest rates are going and to have access to the best rates and latest performance data available.
Explore more via the website – www.yieldreport.com.au.
Find daily updates on social media platforms such as LinkedIn, X, Instagram & Facebook.
For inquiries, please contact contact@yieldreport.com.au or call 0408 266 713.