
Summary
The Q2 2025 earnings season for the S&P 500 is underway, revealing a mixed but generally positive picture. With about one-third of companies having reported, 80% have delivered earnings and revenue surprises, exceeding historical averages. The blended earnings growth rate stands at 6.4% year-over-year, slightly above earlier forecasts but still the lowest since Q1 2024. Revenue growth is tracking at 5.0%, marking the 19th consecutive quarter of gains.
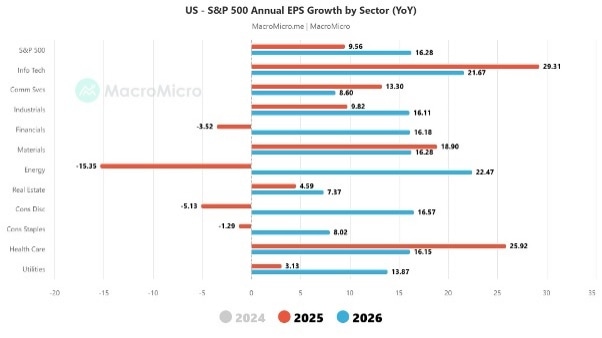
Figure 1: S&P500 EPS Growth by Sector
Financials and Communication Services have led the charge, with banks like JPMorgan and Goldman Sachs outperforming expectations. Big Tech—especially the “Magnificent Seven” (Apple, Microsoft, Alphabet, Amazon, Meta, Tesla, NVIDIA)—remains pivotal, with projected earnings growth far outpacing the rest of the index.
Based on Figure 1 above, the consensus estimate for IT sector EPS growth is at 22%, heavily led by Magnificent Seven stocks. The overall index EPS is expected to grow at 16.3% for 2026 period. Other sectors contributing positively towards the index EPS growth include Energy, Healthcare, Financials and Industrials. While these are healthy numbers, it remains to be seen where the final EPS growth trajectory for the S&P500 index settled after the reporting period.
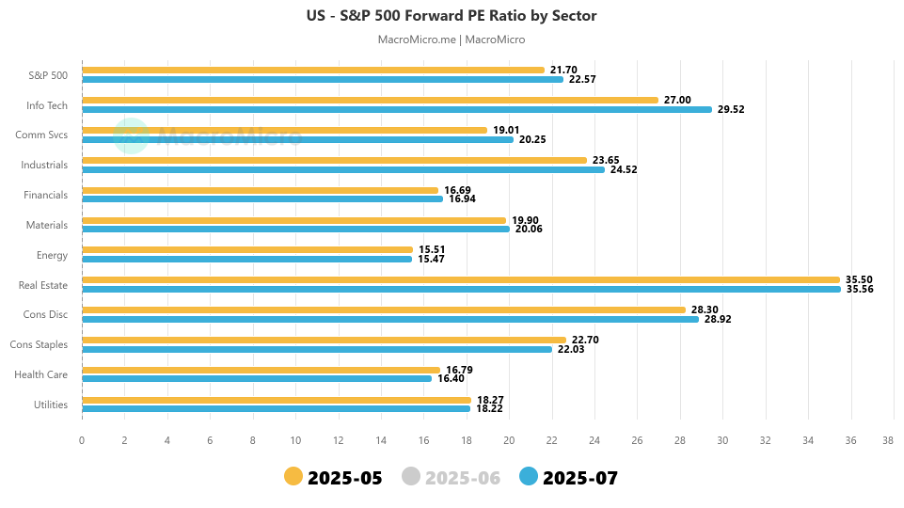
At hectic and well above historical PE multiple, a lot of the good news is in the price. The key questions is the sustainability of EPS growth outside the Mag-7 sector as further impacts of US tariff trade becomes more visible in coming quarters. Exhibit 2 shows the PE multiple of all sectors in the S&P500 index. These are loft valuations and no doubt the market will get tested in the coming months as the cross current between slowing economic momentum interacts with possible easing cycle from the Fed.
Exhibit 2: PE Multiple of S&P 500 Index Sectors
Despite tariff concerns and economic uncertainty, the S&P 500 has hit multiple record highs, buoyed by strong corporate performance and resilient consumer spending. However, sectors like Energy are dragging due to lower oil prices, while Intel’s cost-cutting and transformation efforts highlight challenges in tech manufacturing.
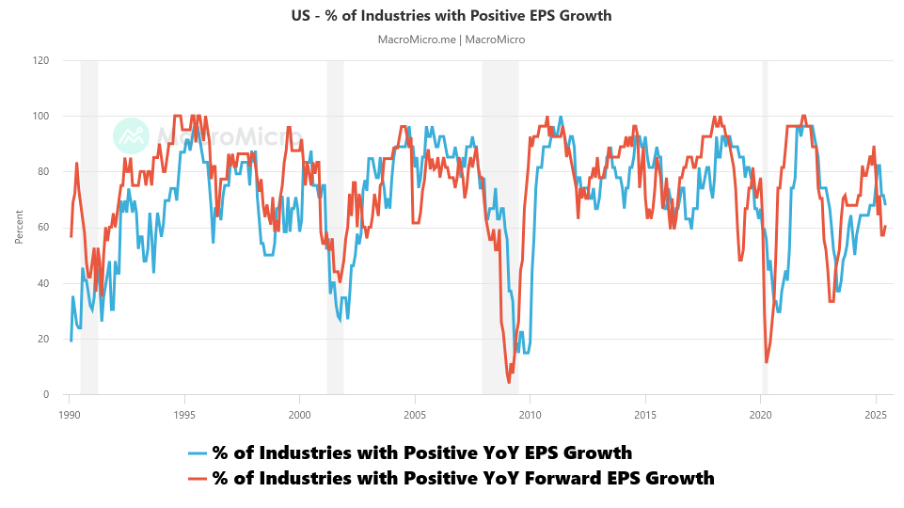
Exhibit 3: Positive EPS Growth Across Industries
The percentage of US industry sectors showing positive EPS YOY growth for 2025 is higher than the proportion for 2026 (1 year forward). Both indicator levels are above 50% although directionally both are easing suggesting deteriorating industry breadth for healthy EPS growth. This behaviour in the EPS industry breadth is consistent with greater concentration of index weights, contribution to overall EPS growth and Mag-7 influence on the profitability of the market.
Looking ahead, analysts expect continued earnings growth in Q3 and Q4, with full-year 2025 growth projected at 9.6%. The forward P/E ratio of 22.4 suggests elevated valuations, making earnings results and guidance critical for sustaining momentum.
About YieldReport – Your Income Advantage
YieldReport is Australia’s leading online data and research platform for interest rate markets, securities and products that focus on fixed income and yield generation. YieldReport provides advice, reviews, analysis and insights on what’s shaping the yield curve and fixed income markets. It’s a key reference for pricing and performance data on yield-generating investments — from cash, term deposits, and bonds to hybrids, ETFs, and more.
Its insights help individuals and institutions make informed decisions — whether managing their own portfolios or acting in fiduciary roles.
Explore more via the website: www.yieldreport.com.au
Follow daily updates on LinkedIn, X, Instagram & Facebook.
Contact us: contact@yieldreport.com.au or call 0408 266 713.