
A yield curve is simply a series of points on a chart. Each point represents a bond’s yield against its time to maturity, or term, for a given borrower. A yield curve can be constructed for a given borrower, such as the Federal Government or a particular company, such as BHP. Quite often, a yield curve is constructed for a selection of borrowers, especially when they have the same credit rating.
Most of the time, a yield curve has a positive gradient; it slopes upwards from left to right. As a general rule, market participants “agree” loans for longer terms should have a higher rate of interest. 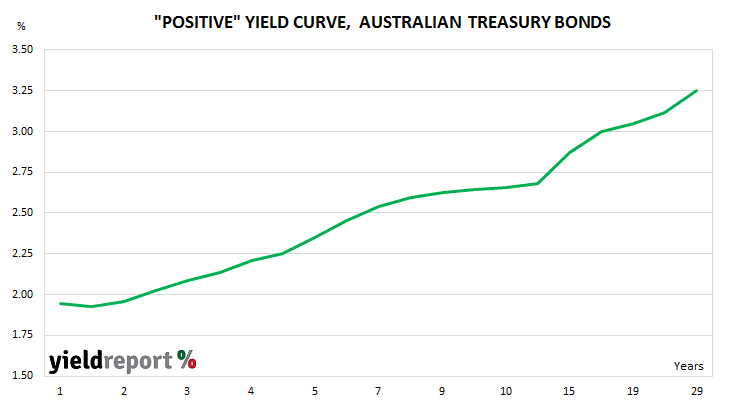
However, there have been some periods in the past where the slope is flat or indeed negative. A negative yield curve still slopes up but from right to left. A negative yield curve may also be referred to as “inverted”.
The relationship between inverted yield curves and recessions has been noted for decades. Some consider the relationship to be more of a rule of thumb than anything but there are others who place more importance on it.