News

Core US PCE inflation up 0.2%; paves way for Sep rate cut

30 August 2024

Summary: US core PCE price index up 0.2% in July, in line with expectations; annual rate steady at 2.6%; ANZ: affirms disinflation process, paves way for September Fed cut; Treasury yields rise; Fed rate-cut expectations soften but eight 25bp cuts priced in

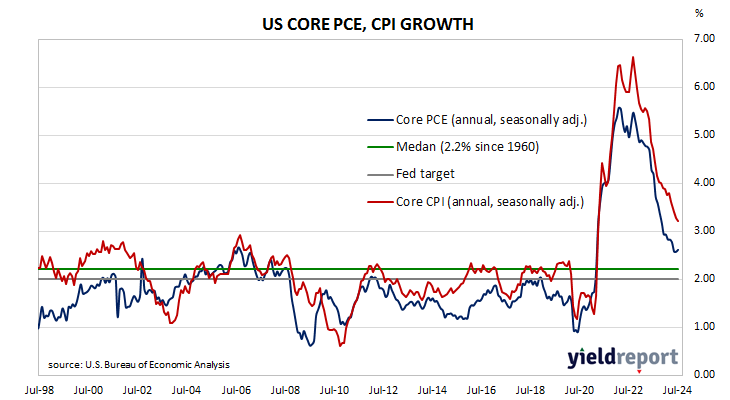
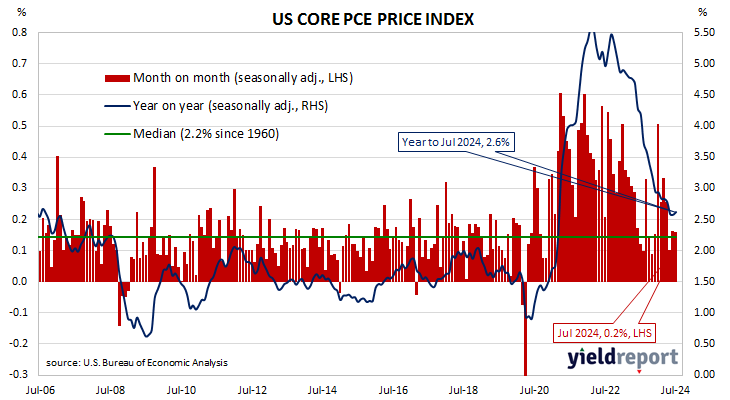
One of the US Fed’s favoured measures of inflation is the change in the core personal consumption expenditures (PCE) price index. After hitting the Fed’s target at the time of 2.0% in mid-2018, the annual rate then hovered in a range between 1.8% and 2.0% before it eased back to a range between 1.5% and 1.8% through 2019. It then plummeted below 1.0% in April 2020 before rising back to around 1.5% in the September quarter of that year. It has since increased significantly and still remains above the Fed’s target even after recent declines.

The latest figures have now been published by the Bureau of Economic Analysis as part of the July personal income and expenditures report. Core PCE prices rose by 0.2% over the month, in line with expectations as well as June’s increase. On a 12-month basis, the core PCE inflation rate remained unchanged at 2.6%.

“The data affirm the disinflation process continues and is paving the way for a Fed cut of 25bps in September,“ said ANZ economist Felix Ryan.

US Treasury bond yields increased moderately across a steeper curve on the day. By the close of business, the 2-year Treasury bond yield had added 3bps to 3.92% while 10-year and 30-year yields both finished 5bps higher at 3.91% and 4.20% respectively.

In terms of US Fed policy, expectations of a lower federal funds rate in the next 12 months softened, albeit with around eight 25bp cuts still currently factored in. At the close of business, contracts implied the effective federal funds rate would average 5.20% in September, 4.755% in November and 4.535% in December. August 2025 contracts implied 3.335%, 200bps less than the current rate.

The core version of PCE strips out energy and food components, which are volatile from month to month, in an attempt to identify the prevailing trend. It is not the only measure of inflation used by the Fed; the Fed also tracks the Consumer Price Index (CPI) and the Producer Price Index (PPI) from the Department of Labor. However, it is the one measure which is most often referred to in FOMC minutes.

July retail sales flat; materially weaker in real per capita terms

30 August 2024

Summary: Retail sales flat in July, less than expected; up 2.3% on 12-month basis; ANZ: stable result follows solid prints in May, June; longer-term ACGB yields rise; rate-cut expectations largely unchanged; Westpac: implies real per capita retail sales soft,  materially weaker; largest influence on result from food sales.

Growth figures of domestic retail sales spent most of the 2010s at levels below the post-1992 average. While economic conditions had been generally favourable, wage growth and inflation rates were low. Expenditures on goods then jumped in the early stages of 2020 as government restrictions severely altered households’ spending habits. Households mostly reverted to their usual patterns as restrictions eased in the latter part of 2020 and throughout 2021.

According to the latest ABS figures, total retail sales remained unchanged after rounding on a seasonally adjusted basis in July. The result was less than the 0.3% increase which had been generally expected as well as June’s 0.5% increase. Sales increased by 2.3% on an annual basis, down from June’s comparable figure of 2.9%.

“The stable result in July follows solid prints in May and June during EOFY sales, with the series up 1.0% over the last three months,” said ANZ economist Madeline Dunk. “Given cost-of-living pressures, households are trading down and waiting for sales events to help stretch their money further.”

The update was released on the same day as the private credit figures and long-term Commonwealth Government bond yields increased modestly on the day while short-term yields finished steady. By the close of business, the 3-year ACGB yield had returned to its starting point at 3.54% while 10-year and 20-year yields both finished 2bps higher at 3.98% and 4.36% respectively.

Expectations regarding rate cuts in the next twelve months were largely unchanged overall, with a February 2025 rate cut fully priced in. Cash futures contracts implied an average of 4.33% in September, 4.32% in October and 4.275% in November.  February 2025 contracts implied 4.08% while August 2025 contracts implied 3.485%, 85bps less than the current cash rate.

“This was clearly a disappointing result given the context of tax cuts,” said Westpac economist Matthew Hassan. “While other indicators had suggested relatively little of the boost to income was spent in July, to get a ‘donut’ on retail sales despite this, price inflation and population growth implies real per capita retail sales were not just soft but weakened materially in July. The August data-flow should help clarify how much of this is monthly noise and how much is a story of ongoing weakness”

Retail sales are typically segmented into six categories (see below), with the “Food” segment accounting for 40% of total sales. Accordingly, the largest influence on the month’s total came from this segment where sales rose by 0.2%.

Optimism emerging in euro-zone; August ESI rises

29 August 2024

Summary: Euro-zone composite sentiment indicator up modestly in August, slightly above expectations; Westpac:  reflects nascent optimism over growth outlook; German, French 10-year yields barely move; readings up in three of five sectors; up in two of four largest euro-zone economies; index implies annual GDP growth rate of 0.8%.

The European Commission’s Economic Sentiment Indicator (ESI) is a composite index comprising five differently weighted sectoral confidence indicators.  It is heavily weighted towards confidence surveys from the business sector, with the consumer confidence sub-index only accounting for 20% of the ESI. However, it has a good relationship with euro-zone GDP growth rates, although not necessarily as a leading indicator.

According to the latest survey taken by the European Commission, confidence has improved on average across the various sectors of the euro-zone economy in August. The ESI posted a reading of 96.6, slightly above expectations as well as July’s revised reading of 96.0. The average reading since 1985 is just under 100.

“These results speak to nascent optimism over the growth outlook,” said Westpac economist Jameson Coombs.

Long-term German and French 10-year bond yields barely moved on the day. By the close of business, the German 10-year yield had inched up 1bp to 2.28% while the French 10-year yield finished steady at 3.00%.

Confidence improved in three of the five sectors of the euro-zone economy. On a geographical basis, the ESI increased in two of four of the euro-zone’s largest economies.

End-of-quarter ESI readings and annual euro-zone GDP growth rates are highly correlated. This latest reading corresponds to a year-to-August GDP growth rate of 0.8%, up from July’s implied growth rate of 0.6%.

“Positive, but cooling, outlook”; June quarter capex slides 2.2%

29 August 2024

Summary: Private capital expenditures down 2.2% in June quarter; contrasts with expected rise; up 0.3% on annual basis; ANZ: growing divide between industries; ACGB yields up modestly; rate-cut expectations slightly softer; Westpac: growing divide between industries; 2023/24 capex estimate 0.5% higher than previous estimate, 10.2% higher than comparable estimate from 2022/23; Westpac: real capex spending could increase by ~3.25% in 2024/25.

Australia’s private capital expenditure (capex) spiked early in the 2010s on the back of investment in the mining sector. As projects were completed, capex growth rates fell away and generally remained negative for a good part of a decade. Capex as a percentage of GDP is now back to a level more in line with the long-term average.

According to the latest ABS figures, seasonally-adjusted private sector capex fell by 2.2% in the June quarter. The result contrasted with the 1.0% increase which had been generally expected as well as the March quarter’s 1.9 rise. On a year-on-year basis, total capex increased by 0.3%, down from 6.3% in the previous quarter after revisions.

“The Q2 capex release showed softness in the quarter, but still points to a positive, but cooling, investment outlook,” said ANZ Head of Australian Economics Adam Boyton.

Commonwealth Government bond yields moved modestly higher on the day, largely in line with overnight movements of US Treasury yields. By the close of business, the 3-year ACGB yield had crept up 1bp to 3.54%, the 10-year yield had added 2bps to 3.96% while the 20-year yield finished 1bp higher at 4.34%.

Expectations regarding rate cuts in the next twelve months softened slightly, although a February 2025 rate cut is still fully priced in. Cash futures contracts implied an average of 4.33% in September, 4.315% in October and 4.265% in November.  February 2025 contracts implied 4.07% while July 2025 contracts implied 3.535%, 80bps less than the current cash rate.

“While private business capex remains elevated, there is a growing divide between industries that are experiencing higher demand on the back of increased public spending and the population rebound, and those at the coal face of the consumer-led slowdown,” said Westpac senior economist Pat Bustamante.

The report also contains capex estimates for the current financial year as well as the following financial year. The latest capex estimate for the 2023/24 financial year, Estimate 7, is $182.0 billion, 0.5% higher than May’s Estimate 6 and 10.2% higher than Estimate 7 of the 2022/23 financial year.

“Adjusting spending plans for prices suggests that real capex spending could increase by around 3.25% in 2024/25,” Bustamante added. “Spending plans suggests that real non-mining capex could grow by around 5.75% in 2024/25, while real mining capex could fall by around 2.75%. If realised, this will help ensure the non-mining sector adds to its capital stock.”

June quarter construction spending up 0.1%; “labour shortages, elevated material costs”

28 August 2024

Summary: Construction spending up 0.1%, less than expected; up 1.2% from June 2023 quarter; Westpac: construction project pipeline received significant boost from latest government budgets; ACGB yields increase; rate-cut expectations soften; Westpac: sector faces difficulties from skilled labour shortages, elevated material costs; residential sector down 0.1%, non-residential building down 0.5%, engineering up 1.5%.

Construction expenditure increased substantially in Australia in the early part of last decade following a more-steady expansion through the 2000s. A large portion of the increase came from the commissioning of new projects and the expansion of existing ones to exploit a tripling in price of Australia’s mining exports in the previous decade.

According to the latest construction figures published by the ABS, total construction in the June quarter increased by 0.1% on a seasonally adjusted basis. The result was less than the 0.5% increase which had been generally expected but in contrast with the March quarter’s 2.0% fall after revisions. On an annual basis, the growth rate slowed from 3.1% to 1.2%.

“The breakdown by construction type and sector remains consistent with the broader dynamics currently at play within the sector,” said Westpac senior economist Ryan Wells. “Of note, the construction project pipeline received a significant boost from the latest Federal and State Government budgets, particularly with respect to infrastructure funding, providing a support to current and future activity.”

The figures came out at the same time as July CPI numbers and domestic Treasury bond yields rose across a slightly flatter curve on the day. By the close of business, the 3-year ACGB yield had increased by 4bps to 3.53% while 10-year and 20-year yields both finished 2bps higher at 3.94% and 4.33% respectively.

Expectations regarding rate cuts in the next twelve months softened, although a February 2025 rate cut is still fully priced in. Cash futures contracts implied an average of 4.33% in September, 4.315% in October and 4.26% in November.  February 2025 contracts implied 4.055% while July 2025 contracts implied 3.535%, 80bps less than the current cash rate.

“At the same time, the sector continues to face difficulties surrounding skilled labour shortages, elevated material costs and a fierce competition for resources,” Wells added. “This has largely presented as a slowdown in private residential construction that has crystallised over the past year, although other segments of private works, non-residential and infrastructure, have also slowed notably over the past six months.”

Residential building construction expenditures decreased by 0.1%, in line with the March quarter decline after revisions. On an annual basis, expenditure in this segment was 2.9% lower than the June 2023 quarter, down from the March quarter’s 1.4% decrease.

Non-residential building spending decreased by 0.5%, up from the previous quarter’s 4.7% fall. On an annual basis, expenditures were 0.3% lower than the June 2023 quarter, whereas the March quarter’s comparable figure was +1.5% after revisions.

Engineering construction increased by 1.5% in the quarter, in contrast with the 1.8% fall in the previous quarter. Spending on an annual basis in this segment was 4.8% higher than the June 2023 quarter, down from the March quarter’s comparable figure of 7.1% after revisions.

Quarterly construction data compiled and released by the ABS are not considered to be of a “primary” nature, unlike unemployment (Labour Force) and inflation (CPI) figures. However, the figures are viewed by economists and analysts with interest as they directly feed into quarterly GDP figures which are next due in early September.

August Conf. Board sentiment index up despite US labour market concerns

27 August 2024

Summary: Conference Board Consumer Confidence Index up in August, above expectations; more positive about business conditions but also more concerned about labour market; short-term US Treasury yields fall; expectations of Fed rate cuts harden; views of present conditions, short-term outlook both improve; expectations index still lower than in March 2001, July 1990, July 1981.

US consumer confidence clawed its way back to neutral over the five years after the GFC in 2008/2009 and then went from strength to strength until late 2018. Measures of consumer confidence then oscillated within a relatively narrow band at historically high levels until they plunged in early 2020. Subsequent readings then fluctuated around the long-term average until March 2021 when they returned to elevated levels. However, a noticeable gap has since emerged between the two most-widely followed surveys.

The latest Conference Board survey completed in the third week of August indicates its measure of US consumer confidence has continued bumping along at slightly-above-average levels. The latest reading of the Consumer Confidence Index registered 103.3 on a preliminary basis, above the generally-expected figure of 100.0 as well as July’s final figure of 101.9.

“Overall consumer confidence rose in August but remained within the narrow range that has prevailed over the past two years,” said Dana Peterson, Chief Economist at The Conference Board.  “Consumers continued to express mixed feelings in August. Compared to July, they were more positive about business conditions, both current and future, but also more concerned about the labour market.”

Short-term US Treasury bond yields fell on the day while longer-term yields finished steady. By the close of business, the 2-year Treasury bond yield had shed 4bps to 3.90% while 10-year and 30-year yields both finished unchanged at 3.82% and 4.11% respectively.

In terms of US Fed policy, expectations of a lower federal funds rate in the next 12 months hardened, with around eight 25bp cuts currently factored in. At the close of business, contracts implied the effective federal funds rate would average 5.205% in September, 4.735% in November and 4.505% in December. July 2025 contracts implied 3.365%, 197bps less than the current rate.

Consumers’ views of present conditions and the near-future both improved. The Present Situation Index increased from July’s revised figure of 133.1 to 134.1 while the Expectations Index increased from 81.1 to 82.5.

“While the expectations index improved in July, rising 1.4 points to 82.5, that is still lower than in March 2001, July 1990, and July 1981, when the nation entered recession the very next month, and only a bit above the December  2007 level,” said UBS economist Amanda Wilcox. “It is also below the threshold of 90 that historically signals a recession in the next year.”

The Consumer Confidence Survey is one of two widely followed monthly US consumer sentiment surveys which produce sentiment indices. The Conference Board’s index is based on perceptions of current business and employment conditions, as well as respondents’ expectations of conditions six months in the future. The other survey, conducted by the University of Michigan, is similar and it is used to produce an Index of Consumer Sentiment. That survey differs in that it does not ask respondents explicitly about their views of the labour market and it also includes some longer-term questions.

No respite for German companies; ifo index slides further in August

26 August 2024

Summary: ifo business climate index down again in August, slightly more than expected; German companies’ sentiment on downward trend; current conditions, expectations indices both down; German, French yields rise moderately; expectations index implies euro-zone GDP contraction of 1.2% in year to November.

Following recessions in euro-zone economies in 2009/2010, the ifo Institute’s Business Climate Index largely ignored the European debt-crisis of 2010-2012, mostly posting average-to-elevated readings through to early-2020. However, the index was quick to react in the March 2020 survey, falling precipitously before recovering quickly in subsequent months. Readings through much of 2021 generally fluctuated around the long-term average before dropping away in 2022 and stagnating through 2023 and the first half of 2024.

According to the latest report released by ifo, German business sentiment weakened slightly from its already-depressed level. August’s Business Climate Index posted a reading of 86.6, a touch above the generally expected figure of 86.0 as well as July’s final reading of 87.0. The average reading since January 2005 is just over 96.

“The sentiment among companies in Germany is on a downward trend,” said Clemens Fuest, President of the ifo Institute. “The German economy is increasingly falling into crisis.”

German firms’ views of current conditions and the outlook both deteriorated. The current situation index slipped from 87.0 to 86.6 while the expectations index declined from 87.1 after revisions to 86.5.

German and French long-term bond yields both increased moderately on the day. By the close of business, the German 10-year bond yield added 2bps to 2.25% while the French 10-year yield finished 3bps higher at 2.96%.

The ifo Institute’s business climate index is a composite index which combines German companies’ views of current conditions with their outlook for the next six months. It has similarities to consumer sentiment indices in the US such as the ones produced by The Conference Board and the University of Michigan.                                 

It also displays a solid correlation with euro-zone GDP growth rates. However, the expectations index is a better predictor as it has a higher correlation when lagged by three months. August’s expectations index implies a 1.2% year-on-year GDP contraction to the end of November.  

July Westpac-MI leading index back to “trend” level; stabilising, not recovering

21 August 2024

Summary: Leading index growth rate up in July; Westpac: broader picture one of stabilisation rather than recovery; reading implies annual GDP growth of around 2.25%-2.50%; ACGB yields fall; rate-cut expectations firm; Westpac: growth momentum looks likely to remain bogged down for some time; Westpac: forecasts 1.6% GDP growth in calendar 2024, 2.3% in calendar 2025.

Westpac and the Melbourne Institute describe their Leading Index as a composite measure which attempts to estimate the likely pace of Australian economic growth in the short-term. After reaching a peak in early 2018, the index trended lower through 2018 and 2019 before plunging to recessionary levels in the second quarter of 2020. Subsequent readings spiked towards the end of 2020 but then trended lower through 2021 and 2022 before flattening out in 2023 and 2024.

July’s reading has now been released and the six month annualised growth rate of the indicator registered +0.06%, up from June’s figure of -0.13%. The index reading represents a rate relative to “trend” GDP growth, which is generally thought to be around 2.50% to 2.75% per annum in Australia.

“Despite the positive monthly read, the broader picture still looks to be one of stabilisation rather than recovery,” said Westpac senior economist Matthew Hassan. “The last nine months has seen the Index growth rate hover in the –0.3% to +0.2% range, a clear improvement on the twelve months prior which saw much weaker reads in the –0.5% to –1% range.”

Westpac states the index leads GDP growth by “three to nine months into the future” but the highest correlation between the index and actual GDP figures occurs with a three-month lead. The current reading may therefore be considered to be indicative of an annual GDP growth rate of around 2.25% to 2.50% in the next quarter.

Domestic Treasury bond yields fell moderately across the curve on the day. By the close of business, 3-year and 10-year ACGB yields had both shed 6bps to 3.51% and 3.90% respectively while the 20-year yield finished 4bps lower at 4.28%.

Expectations regarding rate cuts in the next twelve months firmed, with a February 2025 rate cut fully priced in. Cash futures contracts implied an average of 4.325% in September, 4.305% in October and 4.24% in November.  February 2025 contracts implied 4.035% while July 2025 contracts implied 3.535%, 80bps less than the current cash rate.

“However, outright positives have proven hard to sustain,” Hassan added. “Sharp falls in commodity prices in recent weeks suggest momentum is likely to weaken again in the August month. Meanwhile, other potential positives appear to be further off, the RBA all but ruling out the prospect of rate cuts this year. All up, growth momentum looks likely to remain bogged down for some time yet.”

Westpac is currently forecasting GDP growth to be 1.6% in calendar 2024, rising to 2.3% in calendar 2025. The RBA’s August Statement on Monetary Policy forecasts were slightly different, with GDP growth for the years ending December 2024 and December 2025 to be 1.7% and 2.3% respectively.

US leading index down 0.6% in July; no recession signal

19 August 2024

Summary: Conference Board leading index down 0.6% in July, decline larger than expected; CB: six-month annual growth rate no longer signals recession ahead; short-term US Treasury yields up, longer-term yields down; rate-cut expectations largely unchanged; CB: weakness widespread among non-financial components; expects annualised growth of 0.6%, 1.0% in Q3, Q4.

The Conference Board Leading Economic Index (LEI) is a composite index composed of ten sub-indices which are thought to be sensitive to changes in the US economy. The Conference Board describes it as an index which attempts to signal growth peaks and troughs; turning points in the index have historically occurred prior to changes in aggregate economic activity. Readings from March and April of 2020 signalled “a deep US recession” while subsequent readings indicated the US economy would recover rapidly. Readings post-2022 implied US GDP growth rates would turn negative but that has not been the case so far.

The latest reading of the LEI indicates it decreased by 0.6% in July. The fall was a larger one than the 0.4% decline which had been generally expected as well as June’s 0.2% decrease.

“The LEI continues to fall on a month-over-month basis but the six-month annual growth rate no longer signals recession ahead,” said Justyna Zabinska-La Monica of The Conference Board.

Short-term US Treasury bond yields increased modestly on the day while longer-term yields declined. By the close of business, the 2-year Treasury yield had gained 2bps to 4.07% while 10-year and 30-year yields both finished 2bps lower at 3.87% and 4.12% respectively.

In terms of US Fed policy, expectations of a lower federal funds rate in the next 12 months remained largely unchanged, with around seven 25bp cuts currently factored in. At the close of business, contracts implied the effective federal funds rate would average 5.20% in September, 4.795% in November and 4.59% in December. July 2025 contracts implied 3.56%, 177bps less than the current rate.

“In July, weakness was widespread among non-financial components,” added Zabinska-La Monica. “A sharp deterioration in new orders, persistently weak consumer expectations of business conditions, and softer building permits and hours worked in manufacturing drove the decline, together with the still-negative yield spread.”

The Conference Board now expects annualised growth rates of 0.6% and 1.0% in the respective third and fourth quarters of 2024. Regression analysis suggests the latest reading implies a flat year-on-year growth rate in October, up from -0.2% for the year-to-September growth rate after revisions.

Slight improvement for US household sentiment in August

16 August 2024

Summary: University of Michigan consumer confidence index rises in August, in line with expectations; views of present conditions deteriorate, future conditions improve; election developments influence future expectations, unlikely to alter current assessments; US Treasury yields fall; rate-cut expectations firm; inflation expectations unchanged.

US consumer confidence started 2020 at an elevated level but, after a few months, surveys began to reflect a growing unease with the global spread of COVID-19 and its reach into the US. Household confidence plunged in April 2020 and then recovered in a haphazard fashion, generally fluctuating at below-average levels according to the University of Michigan. The University’s measure of confidence had recovered back to the long-term average by April 2021 but then it plunged again in the September quarter and remained at historically low levels through 2022 and 2023.

The latest survey conducted by the University indicates confidence among US households has improved slightly in August. The preliminary reading of the Index of Consumer Sentiment registered 67.8, essentially in line with expectations but up from July’s final figure of 66.4.

Consumers’ views of current conditions deteriorated  while their views of future conditions improved relative to those held at the time of the July survey. The Current Economic Conditions Index decreased from 62.7 to 60.9 while the Index of Consumer Expectations Index increased from 68.8 to 72.1.

“Overall, expectations strengthened for both personal finances and the five-year economic outlook, which reached its highest reading in four months, consistent with the fact that election developments can influence future expectations but are unlikely to alter current assessments,” said the University’s Surveys of Consumers Director Joanne Hsu.

US Treasury bond yields declined moderately on the day. By the close of business, the 2-year Treasury yield had shed 4bps to 4.05%, the 10-year yield had lost 2bps to 3.89% while the 30-year yield finished 3bps lower at 4.14%.

In terms of US Fed policy, expectations of a lower federal funds rate in the next 12 months firmed slightly, with around seven 25bp cuts currently factored in. At the close of business, contracts implied the effective federal funds rate would average 5.195% in September, 4.785% in November and 4.575% in December. July 2025 contracts implied 3.56%, 177bps less than the current rate.

US consumer inflation expectations remained unchanged. Year-ahead expectations remained at 2.9%, as did consumers’ long-term expectations at 3.0%.

It was once thought less-confident households are generally inclined to spend less and save more; some decline in household spending could be expected to follow. However, recent research suggests the correlation between household confidence and retail spending is quite weak.

Click for more news