News

Business conditions, confidence improve; “solid expansion underway”

08 December 2020

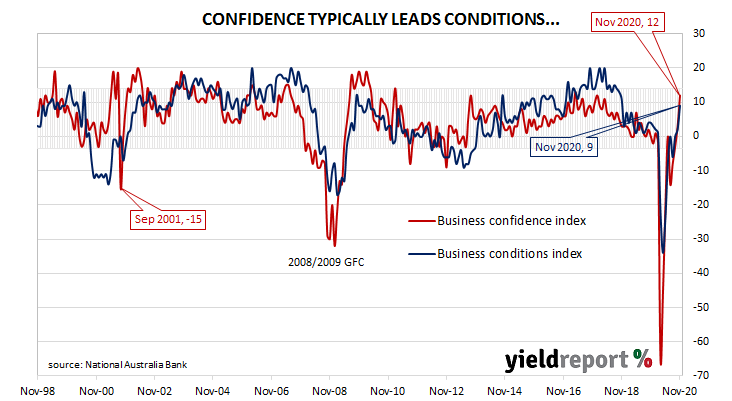
Summary: Business conditions, confidence improve; solid expansion is underway; Victorian conditions “to improve” as lockdown impact fades; capacity usage rate increases again; difference between employment and profitability sub-indices sends “mixed signals”.


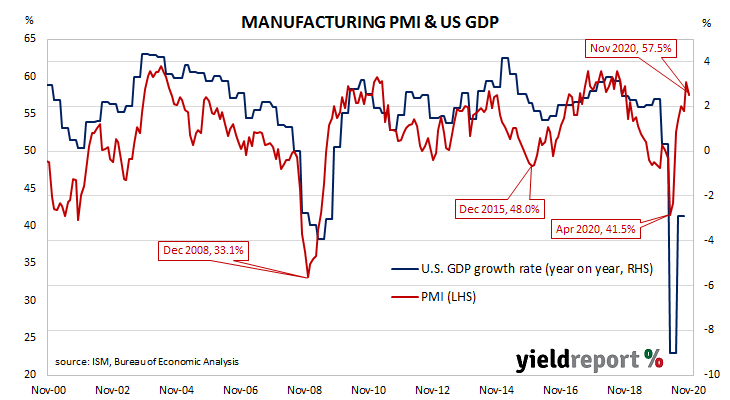
NAB’s business survey indicated Australian business conditions were robust in the first half of 2018, with a cyclical-peak reached in April of that year. Readings from NAB’s indices then began to slip, declining to below-average levels by the end of 2018. Forecasts of a slowdown in the domestic economy began to emerge in the first half of 2019 and the indices trended lower, hitting a nadir in April 2020 as pandemic restrictions were introduced. Conditions have improved markedly since then.

According to NAB’s latest monthly business survey of over 550 firms conducted in the latter part of November, business conditions improved for a third consecutive month. NAB’s conditions index registered 9, up from October’s revised reading of 2.

“The positive readings in most states suggest a solid expansion is underway, although we note the level of activity remains low, given all states saw large hits to activity earlier in the year,” said NAB chief economist Alan Oster.

Business confidence improved for a fourth consecutive month. NAB’s confidence index rose from October’s revised reading of +3 to +12. Typically, NAB’s confidence index leads the conditions index by approximately one month, although some divergences have appeared in the past from time to time.

Oster noted two states had reported worse conditions but he expected Victorian “conditions to improve as the impact of its recent severe lockdown wears off.” Leading indicators such as capacity utilisation and forward orders had improved and the latter’s substantial rise suggested “the pipeline of work has begun to build.”

Job ads kick in November as Vic reopens

07 December 2020

Summary:  Job ads increase significantly in November; just 3.3% lower than in November 2019; Victorian reopening sparks acceleration; jobs rebound “could continue into early-2021 at least”.


From mid-2017 onwards, year-on-year growth rates in the total number of Australian job advertisements consistently exceeded 10%. That was until mid-2018 when the annual growth rate fell back markedly. 2019 was notable for its reduced employment advertising and this trend continued into the first quarter of 2020. Figures plunged in April as pandemic restrictions took effect but subsequent reports have provided evidence a recovery is taking place. 

According to the latest ANZ figures, total advertisements increased by 13.9% in November on a seasonally-adjusted basis. The rise followed an 11.9% increase in October and a 7.5% gain in September after revisions. However, on a 12-month basis, total job advertisements were still 3.3% lower than in November 2019, although this figure was a considerable improvement from October’s comparable figure of -16.7%.

“Victoria’s reopening has sparked an acceleration in the Job Ads recovery through October and November, with ANZ Job Ads up 27% over the two-month period,” said ANZ senior economist Catherine Birch.

Long-term Commonwealth bond yields moved higher, following higher US Treasury yields at the close of trading on Friday night (US time). By the end of the day, the 10-year ACGB yield had gained 5bps to 1.04% and the 20-year yield had gained 4bps to 1.69%. The 3-year yield finished unchanged at 0.19%.

At the current rate, Birch expects total advertisements “to match or even exceed pre-COVID levels by year-end.” She said “the rebound in national employment could continue into early-2021 at least, although the lagged recovery in full-time employment remains a concern.”

The inverse relationship between job advertisements and the unemployment rate has been quite strong (see below chart), although ANZ themselves called the relationship between the two series into question in early 2019.  A rising number of job advertisements as a proportion of the labour force is suggestive of lower unemployment rates in the near-future. A falling ratio suggests higher unemployment rates will follow.

In 2008/2009, advertisements plummeted and Australia’s unemployment rate jumped from 4% to nearly 6% over a period of 15 months. When a more dramatic fall in advertisements took place in April, the unemployment rate responded much more quickly.

ADP report misses but “not enough” to alter NFP forecasts

02 December 2020

Summary: ADP payroll numbers increase in November; less than consensus figure; October number revised up by 39,000; report “probably not enough to meaningfully alter expectations” for upcoming non-farm payroll report; figures up across firms of all sizes; services sector accounts for 90% of gains.


The ADP National Employment Report is a monthly report which provides an estimate of US non-farm employment in the private sector. Since the report began to be published in 2006, its employment figures have exhibited a high correlation with official non-farm payroll figures, although a large difference can arise in any individual month.

The ADP November report indicated private sector employment increased by 0.307 million, less than the 0.5 million which had been generally expected. However, October’s increase was revised up by 39,000 to 404,000.

A month ago, NAB Head of FX Strategy within its FICC division Ray Attrill said the October ADP report had pointed “to slowing employment growth.” After this latest report, he said the figures were “probably not enough to meaningfully alter consensus expectations” for the upcoming non-farm payrolls report even though the ADP figures were noticeably lower than consensus forecasts.

US Treasury yields were largely unchanged by the end of the day, although ultra-long yields rose modestly. By the close of business, 2-year and 10-year Treasury bond yields remained unchanged at 0.17% and 0.93% respectively while the 30-year yield finished 2bps higher at 1.69%.

Employment numbers in net terms increased across businesses of all sizes, although small and medium-sized firms were the main drivers of the month’s gain. Firms with less than 50 employees filled a net 110,000 positions, mid-sized firms (50-499 employees) gained 139,000 positions while large businesses (500 or more employees) accounted for 58,000 additional employees.

Employment at service providers accounted for around 90% of the total net increase, or 276,000 positions. The “Leisure & Hospitality” sector was the largest single source of gains, with 95,000 additional positions filled while the “Education & Health” and “Professional & Business” sectors accounted for around 69,000 and 55,000 positions respectively. Total jobs among goods producers increased by a net 31,000.

Prior to the ADP report, the consensus estimate of the change in October’s non-farm employment figure was 0.5 million. The non-farm payroll report will be released by the Bureau of Labor Statistics this coming Friday night (AEST), 4 December 2020.

ISM November PMI lower but manufacturing “remains robust”

01 December 2020

Summary: ISM purchasing managers index (PMI) down; almost in line with consensus expectation; “remains robust”; reading implies US economy growing at solid pace.


US purchasing managers’ index (PMI) readings reached a cyclical peak in September 2017 before they started a downtrend which stabilised in late 2019 after a truce of sorts was made with the Chinese regarding trade. March’s report signalled a contraction in US manufacturing activity had begun and it stayed in this state until June. Subsequent month’s readings have implied a return to expansion for US manufacturing.

According to the latest Institute of Supply Management (ISM) survey, its Purchasing Managers Index recorded a reading of 57.5% in November. The result was just below the consensus figure of 57.6% and lower than October’s reading of 59.3%. The average reading since 1948 is 52.9% and any reading above 50% implies an expansion in the US manufacturing sector.

ANZ analyst Rahul Khare said, “Growth in the US manufacturing sector eased slightly but remains robust.”

US Treasury bond yields jumped on the day, buoyed by speculation a federal stimulus package may finally be agreed upon. By the close of business, the 2-year Treasury bond yield had gained 3bps to 0.17%, the 10-year yield had increased by 9bps to 0.93% while the 30-year yield finished 10bps higher at 1.67%.

Purchasing Managers’ Indices (PMIs) are economic indicators derived from monthly surveys of executives in private-sector companies. They are diffusion indices, which means a reading of 50% represents no change from the previous period, while a reading under 50% implies respondents reported a deterioration on average. According to the ISM, a reading “above 42.8%, over a period of time, generally indicates an expansion of the overall economy,”

Manufacturing PMI figures appear to lead US GDP by several months despite a considerable error in any given month. The chart below shows US GDP on a “year on year” basis (and not the BEA annualised basis) against US GDP implied by monthly PMI figures.

Private inflation estimate back to 1.4%

30 November 2020

Summary: Melbourne Institute inflation index rises in November; annual rate back to 1.4%.


Despite the RBA’s desire for a higher inflation rate, ostensibly to combat recessions, attempts to accelerate inflation through record-low interest rates have failed to date. The RBA’s stated objective is to achieve an inflation rate of between 2% and 3%, “on average, over time.” Since the GFC, Australia’s inflation rate has been trending lower and lower; the “coronavirus recession” then crushed it in the June quarter.

The Melbourne Institute’s latest reading of its Inflation Gauge index increased by 0.3% in November. The rise follows a 0.1% decline in October and 0.1% increases in both September and August. On an annual basis, the index rose by 1.4%, an acceleration from October’s comparable figure of 1.1%.

Long-term Commonwealth bond yields remained unchanged on the day, ignoring lower US Treasury yields at the close of trading on Friday night. At the close of business, 3-year, 10-year and 20-year ACGB yields finished at 0.17%, 0.90% and 1.54% respectively.

The Melbourne Institute’s Inflation Gauge is an attempt to replicate the ABS consumer price index (CPI) on a monthly basis. It has turned out to be a reliable leading indicator of the CPI, although there are periods in which the Inflation Gauge and the CPI have diverged for as long as twelve months. On average, the Inflation Gauge’s annual rate tends to overestimate the ABS headline rate by an average of a little under 0.1%.

Central bankers desire a certain level of inflation which is “sufficiently low that it does not materially distort economic decisions in the community” but high enough so it does not constrain “a central bank’s ability to combat recessions.” Hence the obsession among central bankers to increase inflation.

“Surprise slowdown” drags on private credit growth

30 November 2020

Summary: Private sector credit flat in October; just under expectations; driven by “surprise slowdown in housing credit”; continued steady growth in owner-occupier segment, offset by falls in business loans, personal debt; housing sector lending “responding to lower rates”; credit growth “likely passed the low point in this cycle.”


The pace of lending to the non-bank private sector by financial institutions in Australia has been trending down since late-2015. Private sector credit growth appeared to have stabilised in the September quarter of 2018 but the annual growth rate then continued to deteriorate through to the end of 2019. The early months of 2020 provided some positive signs but they disappeared in April and they have not re-emerged as yet.

According to the latest RBA figures, private sector credit remained unchanged in October. The result was under the generally expected figure of 0.1% but the same as September’s flat result after it was revised down from 0.1%. The annual growth rate slowed to 1.8% from September’s comparable rate of 1.9% after revisions.

“The slowing, compared to the month prior, was driven by a surprise slowdown in housing credit growth. Given the strength of the housing finance numbers in recent months, we had expected to see housing credit growth lift in October,” said ANZ economist Hayden Dimes.

Owner-occupier loans continued to grow steadily while business loans and personal debt fell again. Growth in the investor lending segment was barely above zero.

Long-term Commonwealth bond yields remained unchanged on the day, ignoring lower US Treasury yields at the close of trading on Friday night. At the close of business, 3-year, 10-year and 20-year ACGB yields finished at 0.17%, 0.90% and 1.54% respectively.

Westpac senior economist Andrew Hanlan noted Australia’s record-low interest rates were helping. “One positive is that the interest-rate-sensitive housing sector is responding to lower rates. New lending for housing jumped by 38% over the four months to September, more than reversing the sharp fall over April and May…That has lending 14% higher than at the end of 2019.”

The traditional driver of loan growth rates, the owner-occupier segment, grew by 0.4% over the month, down from September’s 0.5%. The sector’s 12-month growth rate remained at 5.4%.

Latest euro-zone sentiment indicator “a weak update”

27 November 2020

Summary: Euro-zone composite sentiment index down; above expectations; results from major euro-zone economies all down; sovereign bond yields little changed; index still implies GDP contraction.


The European Commission’s Economic Sentiment Indicator (ESI) is a composite index comprised of five differently-weighted sectoral confidence indicators.  It is heavily weighted towards confidence surveys from the business sector, with the consumer confidence sub-index only accounting for 20% of the ESI. However, it has a good relationship with euro-zone GDP, although not as a leading indicator.

The ESI produced a reading of 87.6 in November, above the market’s expected figure of 86.2 but less than October’s revised reading of 91.1. The average reading since 1985 has been just under 100.

Westpac’s Lochlan Halloway described the report as “a weak update” and said there was “potential for further weakness ahead given activity restrictions.”

Confidence deteriorated across all five of the industry, retail trade, construction, services and consumer sub-indices. On a geographical basis, the ESI fell noticeably in France and Italy but declined by less in Germany and Spain.

German and French 10-year bond yields finished the day little changed. By the close of business, the German bund yield remained unchanged at -0.59% while the French OAT yield had crept up 1bp to -0.34%.

Sep quarter capex continues trend, falls

26 November 2020

Summary: Private capital expenditures down again, less than expected; fall smaller than in June quarter; equipment investment “key source of surprise”; 2020/21 capex estimate 6.3% higher than previous estimate, lower than comparable estimates from 2019/20; non-mining firms upgrade investment plans “substantially”, mining firms make reduction; business investment to “detract from private demand recovery.”


Australia’s capital expenditure (capex) slump was thought to be coming to an end as investment in the mining sector reverted back to its long-term mean after a spike early in the decade. Total investment had begun to grow again, driven by investment in the services sector. However, quarterly contractions have become the norm through 2019 and 2020.

According to the latest ABS figures, seasonally-adjusted private sector capex in the September quarter fell by 3.0%. This latest figure was less than the 1.5% contraction which had been expected but higher than the June quarter’s revised figure of -6.4%. On a year-on-year basis, total capex contracted by 13.8% after recording an annual rate of -11.7% in the previous quarter after revisions.

Westpac senior economist Andrew Hanlan said the change in equipment investment “was the key source of surprise…”

Long-term Commonwealth Government bond yields fell a little on the day. By the close of business, the 10-year Treasury bond yield had lost 2bps to 0.91% and the 20-year yield had slipped 1bp to 1.55%. The 3-year yield remained unchanged at 0.17%.

In the cash futures market, expectations of a change in the actual cash rate, currently at 0.05%, remained unchanged. At the end of the day, contract prices implied the cash rate would slip a touch closer to zero in December and then settle at around 0.04% to 0.05% through 2021.

US core PCE inflation flat in October; “moderating steadily since June”

25 November 2020

Summary: US Fed’s favoured inflation measure flat in October; in line with market expectations; annual rate falls after rising for five months; “inflation moderating steadily since June; little movement from Treasury bond yields.


One of the US Fed’s favoured measures of inflation is the change in the core personal consumption expenditures (PCE) price index. After hitting the Fed’s target at the time of 2.0% in mid-2018, the annual rate then hovered in a range between 1.8% and 2.0% before it eased back to a range between 1.5% and 1.8% through 2019. It then plummeted below 1.0% in April 2020 before rising in the June and September quarters.

The latest figures have now been published by the Bureau of Economic Analysis as part of the October personal income and expenditures report. Core PCE prices remained unchanged after rounding over the month, in line with expectations but lower than September’s 0.2% increase. On a 12-month basis, the core PCE inflation rate slowed from September’s revised rate of 1.6% to 1.4%.

“Monthly inflation has been moderating steadily since June and the annual measure has been below the Fed’s 2.0% target since average inflation targeting was announced in August. Undoubtedly the Fed will be hoping for additional fiscal stimulus to help meet its objectives,” said ANZ economist Daniel Been.

US Treasury bond yields did not move much on the day. By the close of business, the 2-year Treasury bond yield remained unchanged at 0.16%, the 10-year yield had slipped 1bp to 0.88% while the 30-year yield finished 1bp higher at 1.62%.

The core version of PCE strips out energy and food components, which are volatile from month to month, in an attempt to identify the prevailing trend. It’s not the only measure of inflation used by the Fed; it also tracks the Consumer Price Index (CPI) and the Producer Price Index (PPI) from the Department of Labor. However, it is the one measure which is most often referred to in FOMC minutes.

Sep quarter construction down; “underlying weakness, COVID-related disruptions” still present

25 November 2020

Summary: Construction spending contracts again; fall slightly larger than expected; June quarter revised up, now positive; underlying weakness, COVID-related disruptions still affecting sector; residential, non-residential building, engineering all down; September quarter GDP growth likely to be dragged down by result.


Construction expenditure increased substantially in Australia in the early part of last decade following a more-steady expansion through the 2000s. A large portion of the increase came from the commissioning of new projects and the expansion of existing ones to exploit a tripling in price of Australia’s mining exports in the previous decade. The return to “normal” investment levels is still continuing.

According to the latest construction figures published by the ABS, total construction in the September quarter fell by 2.6%. The decline was slightly larger than the 1.9% contraction which had been expected and in contrast to the June quarter’s 0.5% increase after it was revised up from -0.7%. On an annual basis, the growth rate deteriorated from June’s revised figure of -0.3% to -4.2%.

“Activity in the sector declined on underlying weakness evident from mid-2018 and COVID-related disruptions, in particular, Victoria’s second lock-down,” said Westpac senior economist Andrew Hanlan.

Long-term Commonwealth Government bond yields finished the day moderately higher, broadly following overnight movements in US Treasury yields. By the end of the day, 10-year and 20-year yields each finished 4bps higher at 0.93% and 1.56% respectively. The 3-year ACGB yields remained unchanged at 0.17%.

In the cash futures market, expectations of a change in the actual cash rate, currently at 0.05%, barely changed. At the end of the day, contract prices implied the cash rate would slip a little closer to zero in December and then settle at around 0.04% through 2021.

Residential building construction contracted by 1.0%, an improvement from the previous -3.9% after revisions. On an annual basis, expenditure in this segment was 8.9% lower than the September 2019 quarter, higher than the June quarter’s comparable figure of -9.9% after revisions.

Non-residential building spending decreased by 3.4%, a larger contraction than the previous quarter’s revised figure of -1.5%. On an annual basis, expenditures were 4.5% lower than the September quarter of 2019. The June quarter’s comparable figure was +7.4% after revisions. Westpac’s Hanlan said Private non-residential work had “tumbled” and he expected “further falls ahead.”

Click for more news