News

US retail sales jump in July on back of vehicles sales

15 August 2024

Summary: US retail sales up 1.0% in July, more than expected; annual growth rate accelerates to 2.7%; Westpac: result driven by higher vehicle/parts sales; US Treasury yields rise; rate-cut expectations soften; ANZ: do not signal imminent recession; higher sales in ten of thirteen categories; vehicle, parts sales again largest single influence on month’s result.

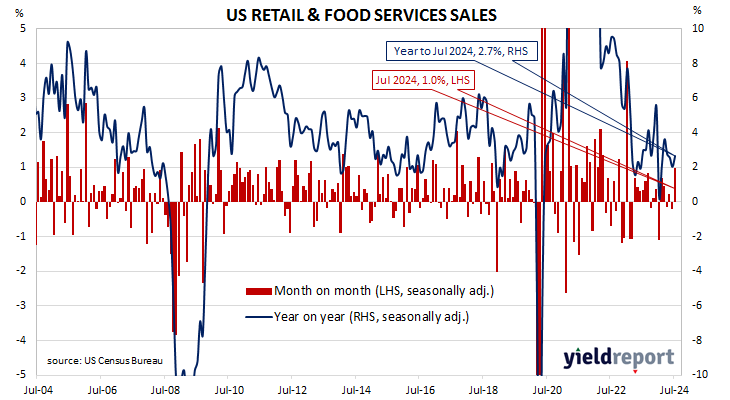
US retail sales had been trending up since late 2015 but, commencing in late 2018, a series of weak or negative monthly results led to a drop-off in the annual growth rate below 2.0%. Growth rates then increased in trend terms through 2019 and into early 2020 until pandemic restrictions sent them into negative territory. A “v-shaped” recovery then took place which was followed by some short-term spikes as federal stimulus payments hit US households in 2021. However, growth rates have slowed significantly since mid-2022.

According to the latest “advance” numbers released by the US Census Bureau, total retail sales increased by 1.0% in July. The result was considerably greater than the 0.3% rise which had been generally expected and in contrast with June’s 0.2% fall after it was revised down from zero. On an annual basis, the growth rate accelerated from June’s revised rate of 2.0% to 2.7%.

“It was the biggest increase since January 2023, with sales at motor vehicle and part dealers rising the most,” said Westpac senior economist Pat Bustamante. “Excluding sales of motor vehicles, retail turnover was up 0.4%.”

Short-term US Treasury bond yields increased significantly on the day while longer-term yields rose more moderately. By the close of business, the 2-year Treasury yield had jumped 13bps to 4.09%, the 10-year yield had gained 8bps to 3.91% while the 30-year yield finished 5bps higher at 4.17%.

In terms of US Fed policy, expectations of a lower federal funds rate in the next 12 months softened, although around seven 25bp cuts are still currently factored in. At the close of business, contracts implied the effective federal funds rate would average 5.195% in September, 4.785% in November and 4.575% in December. July 2025 contracts implied 3.595%, 173bps less than the current rate.

“Retail sales account for around 35% of consumer spending in the US and do not signal an imminent recession,” said ANZ Head of FX Research Mahjabeen Zaman.

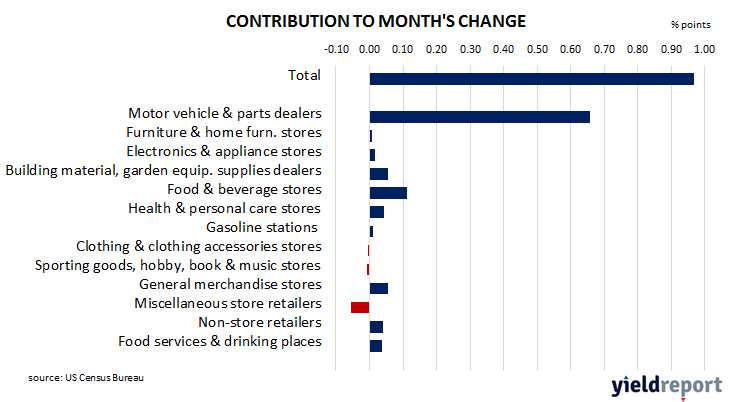
Ten of the thirteen categories recorded higher sales over the month. The “Motor vehicle & parts dealers” segment again provided the largest single influence on the overall result as it rose by 3.6% over the month and contributed 0.66 percentage points to the total. 

The non-store segment includes vending machine sales, door-to-door sales and mail-order sales but nowadays this segment has become dominated by online sales. It accounts for around 17% of all US retail sales and it is the second-largest segment after vehicles and parts.

Going sideways: US industrial output falls back in July

15 August 2024

Summary: US industrial output down 0.6% in July, contrasts with expected flat result; down 0.2% over past 12 months; Barclays: underlying trajectory “roughly sideways”; US Treasury yields up; rate-cut expectations soften; capacity utilisation rate falls to 77.8%.

The Federal Reserve’s industrial production (IP) index measures real output from manufacturing, mining, electricity and gas company facilities located in the United States. These sectors are thought to be sensitive to consumer demand and so some leading indicators of GDP use industrial production figures as a component. US production collapsed through March and April of 2020 before recovering the ground lost over the fifteen months to July 2021. However, production levels has largely stagnated since early 2022.

According to the Federal Reserve, US industrial production fell by 0.6% on a seasonally adjusted basis in July. The contraction contrasted with the flat result which had been generally expected as well as June’s downwardly-revised 0.3% rise. The annual growth rate went into reverse, from June’s downwardly revised figure of 1.1% to -0.2%.

“Industrial production fell 0.6% in July, dragged down by a drop in auto assemblies, disruptions from Hurricane Beryl, and lower utilities production,” said Barclays senior economist Barclays Jonathan Millar. “Looking through these transitory influences, we continue to regard the underlying trajectory of industrial activity and manufacturing as roughly sideways.”

The figures came out on the same morning as the latest retail sales numbers and short-term US Treasury bond yields increased significantly on the day while longer-term yields rose more moderately. By the close of business, the 2-year Treasury yield had jumped 13bps to 4.09%, the 10-year yield had gained 8bps to 3.91% while the 30-year yield finished 5bps higher at 4.17%.

In terms of US Fed policy, expectations of a lower federal funds rate in the next 12 months softened, although around seven 25bp cuts are still currently factored in. At the close of business, contracts implied the effective federal funds rate would average 5.195% in September, 4.785% in November and 4.575% in December. July 2025 contracts implied 3.595%, 173bps less than the current rate.

The same report includes capacity utilisation figures which are generally accepted as an indicator of future investment expenditure and/or inflationary pressures. Capacity usage hit a high for the last business cycle in early 2019 before it began a downtrend which ended with April 2020’s multi-decade low of 64.2%. July’s reading fell by 0.6 percentage points after revisions to 77.8%, 2.3 percentage points below the long-term average.

While the US utilisation rate’s correlation with the US jobless rate is solid, it is not as high as the comparable correlation in Australia.

US July CPI figures as expected; risks around inflation, growth leaning towards downside

14 August 2024

Summary: US CPI up 0.2% in July, in line with expectations; annual inflation rate slows from 3.0% to 2.9%; “core” rate up 0.2%, up 3.2% over year; Westpac risks around inflation, growth increasingly leaning towards downside; short-term Treasury yields rise, longer-term yields fall; rate-cut expectations soften, eight cuts still expected; non-energy services main driver of overall result; Citigroup: catch-up of slowing shelter prices has begun.

The annual rate of US inflation as measured by changes in the consumer price index (CPI) halved from nearly 3% in the period from July 2018 to February 2019. It then fluctuated in a range from 1.5% to 2.0% through 2019 before rising above 2.0% in the final months of that year. Substantially lower rates were reported from March 2020 to May 2020 and they remained below 2% until March 2021. They then rose significantly before declining from mid-2022.

The latest US CPI figures released by the Bureau of Labor Statistics indicated seasonally-adjusted consumer prices increased by 0.2% on average in July. The rise was in line with expectations and in contrast with June’s 0.1% decline after it was revised down from zero. On a 12-month basis, the inflation rate slowed from 3.0% to 2.9%.

“Headline” inflation is known to be volatile and so references are often made to “core” inflation for analytical purposes. The core prices index, the index which excludes the more variable food and energy components, also increased by 0.2% on a seasonally-adjusted basis over the month, in line with expectations. The annual growth rate slowed from June’s rate of 3.3% to 3.2%.

“The inflation report is further evidence that the risks around inflation and growth are increasingly leaning towards downside growth outcomes and support the assessment that restrictive policy conditions should be gradually unwound,” said Westpac economist Jameson Coombs. 

Short-term US Treasury bond yields increased on the day while longer-term yields fell. By the close of business, the 2-year Treasury yield had gained 3bps to 3.96%, the 10-year yield had slipped 1bp to 3.83% while the 30-year yield finished 4bps lower at 4.12%.

In terms of US Fed policy, expectations of a lower federal funds rate in the next 12 months softened, although around eight 25bp cuts are still currently factored in. At the close of business, contracts implied the effective federal funds rate would average 5.185% in September, 4.725% in November and 4.495% in December. July 2025 contracts implied 3.41%, 192bps less than the current rate.

The largest influence on headline results is often the change in fuel prices. Prices of “Energy commodities”, the segment which contains vehicle fuels, increased by 0.1% and contributed zero percentage points to the total after rounding. However, prices of non-energy services, the segment which includes actual and implied rents, had the largest single effect on the total as they contributed 0.18 percentage points following a 0.3% increase on average.

“Some surprising strength in shelter inflation was offset with softer core goods prices,” said Citigroup senior economist Veronica Clark. “We would not read too much into month-to-month volatility in shelter, led by stronger rents in the West in July, a region that had been particularly weak in recent months. We still think the long-awaited catch-up of slowing shelter to softer market rents has begun and will continue over the coming months.”

Euro-zone production woes continue; down 0.1% in June

14 August 2024

Summary: Euro-zone industrial production down 0.1% in June, contrasts with expected gain; down 3.9% on annual basis; German, French 10-year yields unchanged; expansion in all four largest economies.

Following a recession in 2009/2010 and the debt-crisis which flowed from it, euro-zone industrial production recovered and then reached a peak four years later in 2016. Growth rates then fluctuated for two years before beginning a steady and persistent slowdown from the start of 2018. That decline was transformed into a plunge in March and April of 2020 which then took over a year to claw back. Production levels since early 2023 have generally declined.

According to the latest figures released by Eurostat, euro-zone industrial production contracted by 0.1% in June on a seasonally-adjusted and calendar-adjusted basis. The fall contrasted with the 0.5% increase which had been generally expected but it was not as large May’s 0.9% drop after revisions. On an annual basis, the contraction rate accelerated from May’s revised rate of 3.3% to 3.9%.

Long-term German and French sovereign bond yields both finished unchanged on the day. By the close of business, the German 10-year bond yield had returned to its starting point at 2.19% as did the  French 10-year yield at 2.92%.

Despite the overall contraction, industrial production expanded in all of the euro-zone’s four largest economies. Germany’s production rose by 1.6% over the month while the comparable figures for France, Spain and Italy were 0.7%, 0.4% and 0.5% respectively.

“Muted inflationary pressures”; US July PPI up 0.1%

13 August 2024

Summary: US producer price index (PPI) up 0.1% in July, below expected increase; annual rate slows to 2.3%; “core” PPI flat over month, up 2.4% over year; Citigroup: suggests muted inflationary pressures; US Treasury yields fall; rate-cut expectations harden; Westpac: consistent with benign July PCE reading; goods prices up 0.6%, services prices down 0.2%.

Around the end of 2018, the annual inflation rate of the US producer price index (PPI) began a downtrend which continued through 2019. Months in which producer prices increased suggested the trend may have been coming to an end, only for it to continue, culminating in a plunge in April 2020. Figures returned to “normal” towards the end of that year but then moved well above the long-term average in 2021 and 2022 before falling back over 2023.

The latest figures published by the Bureau of Labor Statistics indicate producer prices increased by 0.1% in July after seasonal adjustments. The result was below the 0.2% increase which had been generally expected as well as June’s 0.2%. On a 12-month basis, the rate of producer price inflation after seasonal adjustments slowed from 2.7% to 2.3%.

Producer prices excluding foods and energy, or “core” PPI, remained unchanged after rounding and seasonal adjustments. The result was less than the 0.2% increase which had been generally expected as well as June’s 0.3% rise. The annual growth rate slowed noticeably, from 3.1% after revisions to 2.4%.

“While core PPI was modestly stronger in July and revised higher in June, softer headline and mixed details still suggest overall muted inflationary pressures,” said Citigroup senior economist Veronica Clark. “We expect this trend of easing inflation will be reaffirmed in July CPI data tomorrow.”

Short-term US Treasury bond yields fell noticeably while longer-term yields fell more moderately on the day. By the close of business, the 2-year Treasury yield had shed 9bps to 3.93%, the 10-year had lost 6bps to 3.84% while the 30-year yield finished 4bps lower at 4.16%.

In terms of US Fed policy, expectations of a lower federal funds rate in the next 12 months hardened, with around eight 25bp cuts currently factored in. At the close of business, contracts implied the effective federal funds rate would average 5.155% in September, 4.66% in November and 4.46% in December. July 2025 contracts implied 3.37%, 196bps less than the current rate.

“Components of the PPI that feed into the Personal Consumption Expenditure (PCE) inflation gauge were consistent with a benign reading for July,” said Westpac economist Jameson Coombs.

The BLS stated the fall of the index was attributable to a 0.6% increase in good prices. The final demand services index fell by 0.2%.

The producer price index is a measure of prices received by producers for domestically produced goods, services and construction. It is put together in a fashion similar to the consumer price index (CPI) except it measures prices received from the producer’s perspective rather than from the perspective of a retailer or a consumer. It is another one of the various measures of inflation tracked by the US Fed, along with core personal consumption expenditure (PCE) price data. 

“A small sigh of relief”; consumer sentiment improves in August

13 August 2024

Summary: Westpac-Melbourne Institute consumer sentiment index rises in August; Westpac: consumers relieved as RBA leaves interest rates unchanged, support from tax cuts, other fiscal measures becomes apparent; ACGB yields fall moderately; rate-cut expectations firm; Westpac: rate rise fears subsided noticeably in month; four of five sub-indices rise; more respondents expecting higher jobless rate.

After a lengthy divergence between measures of consumer sentiment and business confidence in Australia which began in 2014, confidence readings of the two sectors converged again in mid-July 2018. Both measures then deteriorated gradually in trend terms, with consumer confidence leading the way. Household sentiment fell off a cliff in April 2020 but, after a few months of to-ing and fro-ing, it then staged a full recovery. However, consumer sentiment then weakened considerably and has languished at pessimistic levels since mid-2022 while business sentiment has been more robust.

According to the latest Westpac-Melbourne Institute survey conducted over the first full week of August, household sentiment has improved, albeit to a level which is still quite pessimistic. Their Consumer Sentiment Index increased from July’s reading of 82.7 to 85.0, a reading which is significantly lower than the long-term average reading of just over 101 and well below the “normal” range.

“Consumers breathed a small sigh of relief in August as the RBA Board left interest rates unchanged and the support coming from tax cuts and other fiscal measures became more apparent,” said Westpac senior economist Matthew Hassan.

Any reading of the Consumer Sentiment Index below 100 indicates the number of consumers who are pessimistic is greater than the number of consumers who are optimistic.

Domestic Treasury bond yields fell moderately across the curve on the day, largely in line with movements of US Treasury yields on Monday night. By the close of business, the 3-year ACGB yield had lost 4bps to 3.60%, the 10-year yield had shed 5bps to 4.01% while the 20-year yield finished 3bps lower at 4.40%.

Expectations regarding rate cuts in the next twelve months firmed, with a February 2025 rate cut fully priced in. Cash futures contracts implied an average of 4.32% in September, 4.285% in October and 4.20% in November.  February 2025 contracts implied 4.03% while July 2025 contracts implied 3.63%, 71bps less than the current cash rate.

“Rate rise fears subsided noticeably in the month,” added Hassan, “Notably, about 10% of that move came before the RBA announced its decision to leave interest rates on hold in August, suggesting rate rise fears had already eased significantly following the June quarter inflation update, and perhaps in response to a clearer signs of a monetary-easing cycle emerging abroad.”

Four of the five sub-indices registered higher readings, with the “Family finances versus a year ago” sub-index posting the largest monthly percentage gain. 

The Unemployment Expectations index, formerly a useful guide to RBA rate changes, rose from 128.6 to 133.5, slightly above the long-term average. Higher readings result from more respondents expecting a higher unemployment rate in the year ahead.

NAB July business indices mixed; supply, demand moving back into balance

13 August 2024

Summary: Business conditions improve in July; business confidence deteriorates, below average; NAB: supply, demand moving back into balance, inflationary pressures continue easing; ACGB yields fall moderately; rate-cut expectations firm; NAB: capacity utilisation falling on trend basis; capacity utilisation rate down, still at elevated level.

NAB’s business survey indicated Australian business conditions were robust in the first half of 2018, with a cyclical-peak reached in April of that year. Readings from NAB’s index then began to slip and forecasts of a slowdown in the domestic economy began to emerge in the first half of 2019 as the index trended lower. It hit a nadir in April 2020 as pandemic restrictions were introduced but then improved markedly over the next twelve months and subsequently remained at robust levels until recently.

According to NAB’s latest monthly business survey of around 380 firms conducted in the second half of July, business conditions improved after four consecutive months of deteriorating and are now back to a level just below the long-term average. NAB’s conditions index registered 6 points, up 2 points from June’s reading.

Conversely, business confidence deteriorated.  NAB’s confidence index fell 2 points to +1 point, a reading which is below the long-term average.  NAB’s confidence index typically leads the conditions index by one month, although some divergences have appeared from time to time.

“The survey continues to show that supply and demand in the economy are moving back into balance and that inflationary pressures continue to ease,” said NAB Chief Economist Alan Oster.

Domestic Treasury bond yields fell moderately across the curve on the day, largely in line with movements of US Treasury yields on Monday night. By the close of business, the 3-year ACGB yield had lost 4bps to 3.60%, the 10-year yield had shed 5bps to 4.01% while the 20-year yield finished 3bps lower at 4.40%.

Expectations regarding rate cuts in the next twelve months firmed, with a February 2025 rate cut fully priced in. Cash futures contracts implied an average of 4.32% in September, 4.285% in October and 4.20% in November.  February 2025 contracts implied 4.03% while July 2025 contracts implied 3.63%, 71bps less than the current cash rate.

“There was a sizable decline in capacity utilisation in July, and while we would caution against putting too much emphasis on a single month’s result, particularly as it was driven by a few sectors, it is also falling on a trend basis,” Oster added. “ This provides further evidence that the rebalancing in supply and demand that the RBA is looking for is occurring.”

NAB’s measure of national capacity utilisation declined from June’s revised reading of 83.4% to 82.7%, a level which is still quite elevated from a historical perspective. Seven of the eight sectors of the economy were reported to be operating at or above their respective long-run averages, the wholesale sector remaining the one exception.

Capacity utilisation is generally accepted as an indicator of future investment expenditure and it also has a strong inverse relationship with Australia’s unemployment rate.

Cooling continues; job ads down another 3% in July

06 August 2024

Summary: Job ads down 3.0% in July; 20.8% lower than July 2023; ANZ: sixth consecutive monthly decline; ACGB yields generally rise; rate-cut expectations soften; ANZ: risk labour market could slow more sharply than forecast; ad index-to-workforce ratio declines.

From mid-2017 onwards, year-on-year growth rates in the total number of Australian job advertisements consistently exceeded 10%. That was until mid-2018 when the annual growth rate fell back markedly. 2019 was notable for its reduced employment advertising and this trend continued into the first quarter of 2020. Advertising then plunged in April and May of 2020 as pandemic restrictions took effect but recovered quite quickly, reaching historically-high levels in 2022.

According to the latest reading of the ANZ-Indeed Job Ads Index, total job advertisements in July decreased by 3.0% on a seasonally adjusted basis. The index fell from 116.8 in June to 113.3, with the loss following falls of 2.7% in June and 2.1% in May. On a 12-month basis, total job advertisements were 20.8% lower than in July 2023, down from June’s revised figure of -18.0%.

“ANZ-Indeed Australian Job Ads recorded its sixth consecutive monthly decline in July, with the series down 16.7% since January,” said ANZ economist Madeline Dunk. “This points to continued cooling in the labour market.”

Government bond yields generally moved higher on the day, mostly reversing the previous day’s plunge. By the close of business, the 3-year ACGB yield had gained 29bps to 3.60%, the 10-year yield had added 16bps to 4.03% while the 20-year yield finished 5bps lower at 4.41%.

Expectations regarding rate cuts in the next twelve months softened, although a February 2025 rate cut is still priced in. In the cash futures market, contracts implied an average of 4.315% in September, 4.29% in October and 4.195% in November.  February 2025 contracts implied 4.04% while August 2025 implied 3.665%, 67bps less than the current cash rate.

“We’ve also seen the share of employers recruiting fall sharply in June to levels last seen during the east coast 2021 lockdowns, while average hours worked per employed person has declined 30 minutes a week since February 2023,” Dunk added. “Taken together, there is a risk the labour market could slow more sharply than we and the RBA are forecasting.”

The inverse relationship between job advertisements and the unemployment rate or the underemployment rate has been quite strong (see below chart), although ANZ themselves called the relationship between the series into question in early 2019. 

A higher job advertisement index as a proportion of the labour force is suggestive of lower unemployment rates in the near future while a lower ratio suggests higher unemployment rates will follow. July’s ad index-to-workforce ratio declined from 0.78 to 0.76.

In 2008/2009, advertisements plummeted and Australia’s unemployment rate jumped from 4% to nearly 6% over a period of 15 months. When a more dramatic fall in advertisements took place in April 2020, the unemployment rate responded much more quickly.

Inflation Gauge posts 0.4% rise in July; annual rate falls below 3%

05 August 2024

Summary: Melbourne Institute Inflation Gauge index up 0.4% in July; up 2.8% on annual basis; ACGB yields plunge; rate-cut expectations harden, November cut priced in.

The Melbourne Institute’s Inflation Gauge is an attempt to replicate the ABS consumer price index (CPI) on a monthly basis. It has turned out to be a reliable leading indicator of the CPI, although there are periods in which the Inflation Gauge and the CPI have diverged for as long as twelve months. On average, the Inflation Gauge’s annual rate tends to overestimate the ABS rate by around 0.1%, or at least until recently.

The Melbourne Institute’s latest reading of its Inflation Gauge index indicates consumer prices increased by 0.4% in July, up from the increases of 0.2% and 0.3% posted in June and May respectively. However, inflation on an annual basis slowed from 3.2% to 2.8%.

Commonwealth Government bond yields generally plunged on the day, although ultra-long yields remained steady with a likely catch-up coming tomorrow. The falls followed large drops of US Treasury yields on Friday night and, by the close of business, the 3-year ACGB yield had lost 33bps to 3.31%, the 10-year yield had shed 19bps to 3.87% while the 20-year yield finished steady at 4.46%.

Expectations regarding rate cuts in the next twelve months hardened, with a November rate cut now pretty much priced in. In the cash futures market, contracts implied an average of 4.30% in August, 4.06% in November and 3.86% in February 2025. August 2025 contracts implied 3.34%, 100bps less than the current cash rate.

Central bankers desire a certain level of inflation which is “sufficiently low that it does not materially distort economic decisions in the community” but high enough so it does not constrain “a central bank’s ability to combat recessions.”

US July jobs report disappoints; at point of “non-linear weakening”

02 August 2024

Summary: US non-farm payrolls up 114,000 in July, below expectations; previous two months’ figures revised down by 29,000; jobless rate rises to 4.3%, participation rate ticks up to 62.7%; Citigroup: labour market reaching point of further non-linear weakening; US Treasury yields dive; expectations of Fed rate cuts harden; employed-to-population ratio slips to 60.0%; underutilisation rate rises to 7.8%; annual hourly pay growth slows to 3.6%.

The US economy ceased producing jobs in net terms as infection controls began to be implemented in March 2020. The unemployment rate had been around 3.5% but that changed as job losses began to surge through March and April of 2020. The May 2020 non-farm employment report represented a turning point and subsequent months provided substantial employment gains which have continued to the present.

According to the US Bureau of Labor Statistics, the US economy created an additional 114,000 jobs in the non-farm sector in July. The increase was considerably  less than the 206,000 rise which had been generally expected as well as the 179,000 jobs which had been added in June. Employment figures for June and May were revised down by a total of 29,000.

The total number of unemployed increased by 352,000 to 7.163 million while the total number of people who were either employed or looking for work increased by 419,000 to 168.429 million. These changes led to the US unemployment rate rises from 4.1% in June to 4.3%. The participation rate ticked up from 62.6% to 62.7%.

“The more-rapid rise in the unemployment in the last few months, which is now accompanied by clearer  slowing in payroll job growth, is consistent with a labour market reaching a point of further non-linear weakening,” said Citigroup senior economist Veronica Clark.

US Treasury bond yields dived across the curve on the day, with falls heaviest at the short end. By the close of business, the 2-year yield had plunged 27bps to 3.88%, the 10-year yield had shed 19bps to 3.79% while the 30-year yield finished 17bps lower at 4.11%.

In terms of US Fed policy, expectations of a lower federal funds rate in the next 12 months hardened, with around eight 25bp cuts currently factored in. At the close of business, contracts implied the effective federal funds rate would average 5.11% in September, 22bps less than the current spot rate, 4.535% in November and 4.305% in December. July 2025 contracts implied 3.28%, 205bps less than the current rate.

One figure which is indicative of the “spare capacity” of the US employment market is the employment-to-population ratio. This ratio is simply the number of people in work divided by the total US population. It hit a cyclical-low of 58.2 in October 2010 before slowly recovering to just above 61% in early 2020. July’s reading slipped from 60.1% to 60.0%, some way from the April 2000 peak reading of 64.7%.

Apart from the unemployment rate, another measure of tightness in the labour market is the underutilisation rate and the latest reading of it registered 7.8%, up from 7.4% in June. Wage inflation and the underutilisation rate usually have an inverse relationship; private hourly pay growth in the year to July slowed from 3.8% to 3.6%.

Click for more news