News

Home loan approvals increasingly driven by investors

02 August 2024

Summary: Value of loan commitments up 1.3% in June, above expectations; 19.1% higher than June 2023; Westpac: new lending increasingly led by investors; ACGB yields fall; rate-cut expectations firm; value of owner-occupier loan approvals up 0.5%; value of investor approvals up 2.7%; number of owner-occupier home loan approvals down 0.5%.

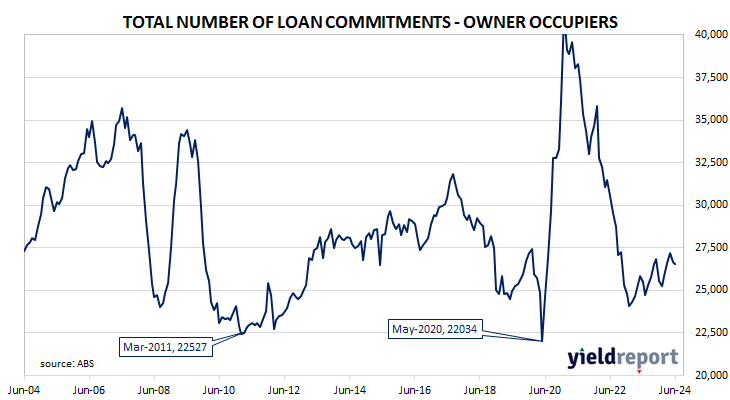
The number and value of home-loan approvals began to noticeably increase after the RBA reduced its cash rate target in a series of cuts beginning in mid-2019, potentially ending the downtrend which had been in place since mid-2017. Figures from February through to May of 2020 provided an indication the downtrend was still intact but subsequent figures then pushed both back to record highs in 2021. After a considerable pullback in 2022 both the value and number of approved loans resumed rising in 2023.

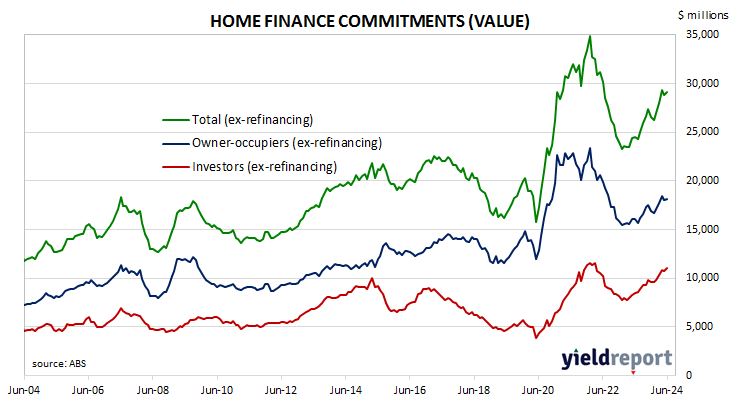
June’s housing finance figures have now been released and total loan approvals excluding refinancing increased by 1.3% In dollar terms over the month, greater than the flat result which had been generally expected and in contrast with May’s 1.7% decline. On a year-on-year basis, total approvals excluding refinancing were 19.1% higher than in June 2023, up from May’s comparable figure of 18.0%.

“The detail continues to show similar themes to previous months; gains in new lending being increasingly led by investors and Western Australia the stand-out state in terms of strength,” said Westpac senior economist Matthew Hassan.

Commonwealth Government bond yields fell moderately on the day. By the close of business, the 3-year ACGB yield had shed 6bps to 3.64% while 10-year and 20-year yields both finished 3bps lower at 4.06% and 4.46% respectively.

Expectations regarding official rate cuts in the next twelve months firmed. In the cash futures market, contracts implied an average of 4.33% in August, 4.255% in November and 4.09% in February 2025. May 2025 contracts implied 3.865%, 47bps less than the current cash rate.

The total value of owner-occupier loan commitments excluding refinancing increased by 0.5%, a partial reversal of May’s 1.9% fall. On an annual basis, owner-occupier loan commitments were 13.2% higher than in June 2023, up from May’s comparable figure of 12.2%.

The total value of investor commitments excluding refinancing increased by 2.7%. The rise follows a 1.3% decline in May, taking the growth rate over the previous 12 months from 29.3% to 30.2%.

The total number of loan commitments to owner-occupiers excluding refinancing decreased by 0.5% to 26521 on a seasonally adjusted basis, a smaller decline than May’s 2.0% decrease. The annual growth rate accelerated from 3.1% after revisions to 4.0%.

“Material contraction”; ISM July PMI falls further below 50

01 August 2024

Summary: ISM PMI down in July, below expectations; Westpac: consistent with material contraction in sector; US Treasury yields fall; expectations of Fed rate cuts firm; ISM: reading corresponds to 1.2% US GDP growth annualised.

The Institute of Supply Management (ISM) manufacturing Purchasing Managers Index (PMI) reached a cyclical peak in September 2017. It then started a downtrend which ended in March 2020 with a contraction in US manufacturing which lasted until June 2020. Subsequent month’s readings implied growth had resumed, with the index becoming stronger through to March 2021. Readings then declined fairly steadily until mid-2023 and have since generally stagnated.

According to the ISM’s July survey, its PMI recorded a reading of 46.8%, below the generally expected figure of 49.0% as well as June’s 48.5%. The average reading since 1948 is roughly 53.0% and any reading below 50% implies a contraction in the US manufacturing sector relative to the previous month.

 “This has been the sharpest contraction in factory activity since November,” said Westpac senior economist Pat Bustamante. “Production and new orders both deteriorated to levels consistent with a material, sustained contraction in the sector. Employment was also very weak, around 5 percentage points below its 5-year average at 43.4 points.”

US Treasury bond yields fell across the curve on the day, with falls heaviest at the short end. By the close of business, the 2-year Treasury bond yield had shed 11bps to 4.15%, the 10-year yield had lost 5bps to 3.98% while the 30-year yield finished 3bps lower at 4.28%.

In terms of US Fed policy, expectations of a lower federal funds rate in the next 12 months firmed, with at least six 25bp cuts currently factored in. At the close of business, contracts implied the effective federal funds rate would average 5.18% in September, 15bps less than the current spot rate, 4.795% in November and 4.62% in December. July 2025 contracts implied 3.655%, 167bps less than the current rate

Purchasing managers’ indices (PMIs) are economic indicators derived from monthly surveys of executives in private-sector companies. They are diffusion indices, which means a reading of 50% represents no change from the previous period, while a reading under 50% implies respondents reported a deterioration on average. A reading “above 42.5%, over a period of time, generally indicates an expansion of the overall economy”, according to the ISM’s latest calculations.      

The ISM’s manufacturing PMI figures appear to lead US GDP by several months despite a considerable error in any given month. The chart below shows US GDP on a “year on year” basis (and not the BEA annualised basis) against US GDP implied by monthly PMI figures. 

According to the ISM and its analysis of past relationships between the PMI and US GDP, July’s PMI corresponds to an annualised growth rate of 1.2%, or about 0.3% over a quarter. Regression analysis on a year-on-year basis suggests a 12-month GDP growth rate of 1.7% five months after this latest report.

The ISM index is one of two monthly US PMIs, the other being an index published by S&P Global. S&P Global produces a “flash” estimate in the last week of each month which comes out about a week before the ISM index is published. The S&P Global July flash manufacturing PMI registered 49.5%, down 2.1 percentage points from June’s final figure.

End-of-year sales, upcoming tax cuts likely driver of June retail sales increase

31 July 2024

Summary: Retail sales up 0.5% in June, noticeably more than expected; up 2.9% on 12-month basis; ANZ: likely related to end-of-financial year sales, may also suggest households pre-emptively spent some of Stage 3 tax cuts; ACGB yields plunge; rate-cut expectations harden; ANZ: may suggest on cusp of lift in spending; largest influence on result from household goods sales.

Growth figures of domestic retail sales spent most of the 2010s at levels below the post-1992 average. While economic conditions had been generally favourable, wage growth and inflation rates were low. Expenditures on goods then jumped in the early stages of 2020 as government restrictions severely altered households’ spending habits. Households mostly reverted to their usual patterns as restrictions eased in the latter part of 2020 and throughout 2021.

According to the latest ABS figures, total retail sales rose by 0.5% on a seasonally adjusted basis in June. The rise was noticeably more than the 0.2% increase which had been generally expected and just short of May’s 0.6% increase. Sales increased by 2.9% on an annual basis, up from May comparable figure of 1.7%.

“While the lift is likely related to increased spending around end-of-financial year sales, it may also suggest households pre-emptively spent some of the money they were expecting from the Stage 3 tax cuts,” said ANZ economist Catherine Birch.

The update was released on the same day as the latest CPI figures and Commonwealth Government bond yields plunged on the day, with falls at the short end outpacing movements of longer-term yields. By the close of business, the 3-year ACGB yield had shed 23bps to 3.72%, the 10-year yield had lost 17bps to 4.12% while the 20-year yield finished 12bps lower at 4.51%.

Expectations regarding rate cuts in the next twelve months hardened considerably. Cash futures prices at the end of the day implied the cash rate now has some chance of falling below the current rate of 4.34% in the short-term, with an average of 4.33% in August and 4.255% in November. February 2025 contracts implied 4.145% while May 2025 contracts implied 3.93%, 41bps less than the current cash rate.

“When considered alongside the momentum in ANZ-Roy Morgan Australian Consumer Confidence over the past fortnight, it may suggest we are on the cusp of a lift in spending,” Birch added. “That said, we are moving from a weak starting point, with retail volumes falling for six of the last seven quarters.”

Retail sales are typically segmented into six categories (see below), with the “Food” segment accounting for 40% of total sales. However, the largest influence on the month’s total came from the “Household goods” segment where sales rose by 1.1%.

Conf. Board sentiment index up in July, maintains near-average level

30 July 2024

Summary: Conference Board Consumer Confidence Index up in July, slightly above expectations; still concerned about elevated prices, interest rates, uncertainty about future; US Treasury yields fall moderately; expectations of Fed rate cuts firm; views of present conditions deteriorates, short-term outlook improves; expectations for future income improves slightly, consumers generally negative about business, employment conditions ahead.

US consumer confidence clawed its way back to neutral over the five years after the GFC in 2008/2009 and then went from strength to strength until late 2018. Measures of consumer confidence then oscillated within a relatively narrow band at historically high levels until they plunged in early 2020. Subsequent readings then fluctuated around the long-term average until March 2021 when they returned to elevated levels. However, a noticeable gap has since emerged between the two most-widely followed surveys.

The latest Conference Board survey completed in the third week of July indicated its measure of US consumer confidence has continued bumping along at near-average levels. The latest reading of the Consumer Confidence Index registered 100.3 on a preliminary basis, slightly above the generally-expected figure of 99.7 and up from June’s final figure of 97.8.

“Even though consumers remain relatively positive about the labour market, they still appear to be concerned about elevated prices, interest rates and uncertainty about the future, things that may not improve until next year,” said Dana Peterson, Chief Economist at The Conference Board. 

The report was released on the same morning as the latest JOLTS report and US Treasury yields fell moderately across the curve on the day. By the close of business, 2-year and 10-year Treasury bond yields had both shed 4bps to 4.36% and 4.14% respectively while the 30-year yield finished 3bps lower at 4.40%.

In terms of US Fed policy, expectations of a lower federal funds rate in the next 12 months firmed, with at least five 25bp cuts currently factored in. At the close of business, contracts implied the effective federal funds rate would average 5.315% in August, 2bps less than the current spot rate, 5.205% in September and 4.915% in November. June 2025 contracts implied 4.00%, 133bps less than the current rate.

Consumers’ views of present conditions deteriorated while their views of the near-future improved. The Present Situation Index decreased from June’s revised figure of 135.3 to 133.6 while the Expectations Index increased from 72.8 to 78.2.

“Compared to last month, consumers were somewhat less pessimistic about the future,” Peterson added. “Expectations for future income improved slightly but consumers remained generally negative about business and employment conditions ahead. Meanwhile, consumers were a bit less positive about current labour and business conditions.”

The Consumer Confidence Survey is one of two widely followed monthly US consumer sentiment surveys which produce sentiment indices. The Conference Board’s index is based on perceptions of current business and employment conditions, as well as respondents’ expectations of conditions six months in the future. The other survey, conducted by the University of Michigan, is similar and it is used to produce an Index of Consumer Sentiment. That survey differs in that it does not ask respondents explicitly about their views of the labour market and it also includes some longer-term questions.

US June JOLTS report: labour demand, supply “broadly balanced”

30 July 2024

Summary: US quit rate steady at 2.1% in June after revisions; Westpac: US labour demand, supply broadly balanced; US Treasury yields fall; expectations of Fed rate cuts firm; job openings relative to employment broadly in line with pre-pandemic averages; fewer quits, openings, separations.

The number of US employees who quit their jobs as a percentage of total employment increased slowly but steadily after the GFC. It peaked in March 2019 and then tracked sideways until virus containment measures were introduced in March 2020. The quit rate then plummeted as alternative employment opportunities rapidly dried up. Following the easing of US pandemic restrictions, it proceeded to recover back to its pre-pandemic rate in the third quarter of 2020 and trended higher through 2021 before easing through 2022, 2023 and the first half of 2024.

Figures released as part of the latest Job Openings and Labor Turnover Survey (JOLTS) report show the quit rate remained steady in June after revisions. 2.1% of the non-farm workforce left their jobs voluntarily, unchanged from May after rounding. Quits in the month decreased by 121,000 while an additional 206,000 people were employed in non-farm sectors.

“Separation and quit rates also point to labour demand and supply being broadly balanced with a normal degree of churn,” said Westpac economist Jameson Coombs.

The report was released on the same morning as The Conference Board’s latest consumer confidence survey and US Treasury yields fell moderately across the curve on the day. By the close of business, 2-year and 10-year Treasury bond yields had both shed 4bps to 4.36% and 4.14% respectively while the 30-year yield finished 3bps lower at 4.40%.

In terms of US Fed policy, expectations of a lower federal funds rate in the next 12 months firmed, with at least five 25bp cuts currently factored in. At the close of business, contracts implied the effective federal funds rate would average 5.315% in August, 2bps less than the current spot rate, 5.205% in September and 4.915% in November. June 2025 contracts implied 4.00%, 133bps less than the current rate

The fall in total quits was led by 64,000 fewer resignations in the “Construction” sector while the “Professional and business services” sector experienced the largest increase, rising by 82,000. Overall, the total number of quits for the month decreased from May’s revised figure of 3.403 million to 3.282 million.    

“While the number of job openings is still meaningfully above the pre-pandemic average, relative to employment, job openings are broadly in line with pre-pandemic averages,” Coombs added.

Total vacancies at the end of June decreased by 46,000, or 0.6%, from May’s revised figure of 8.230 million to 8.184 million. The fall was driven by 88,000 fewer open positions in the “Durable goods” sector while the “Accommodation and food services” sector experienced 120,000 more offerings, the single largest increase. Overall, 12 out of 18 sectors experienced fewer job openings than in the previous month.  

Total separations decreased by 302,000, or 5.6%, from June’s revised figure of 5.397 million to 5.095 million. The fall was led by the “Construction” sector where there were 80,000 fewer separations while the “Retail trade” sector experienced 6,000 more separations. Separations decreased in 10 of the 18 sectors.

The “quit” rate time series produced by the JOLTS report is a leading indicator of US hourly pay. As wages account for around 55% of a product’s or service’s price in the US, wage inflation and overall inflation rates tend to be closely related. Former Federal Reserve chief and current Treasury Secretary Janet Yellen was known to pay close attention to it.

Bouncing around soft levels; July euro composite confidence index slips

30 July 2024

Summary: Euro-zone composite sentiment indicator down a touch in July, slightly above expectations; Westpac: remains relatively soft compared to pre-pandemic levels; readings up in three of five sectors; up in three of four largest euro-zone economies; German, French 10-year yields fall; index implies annual GDP growth rate of 0.4%.

The European Commission’s Economic Sentiment Indicator (ESI) is a composite index comprising five differently weighted sectoral confidence indicators.  It is heavily weighted towards confidence surveys from the business sector, with the consumer confidence sub-index only accounting for 20% of the ESI. However, it has a good relationship with euro-zone GDP growth rates, although not necessarily as a leading indicator.

According to the latest survey taken by the European Commission, confidence has remained largely unchanged on average across the various sectors of the euro-zone economy in July. The ESI posted a reading of 95.8, slightly above the generally-expected figure of 95.2, but down a touch from June’s revised reading of 95.9. The average reading since 1985 is just under 100.

“Economic confidence has been bouncing around month-to-month but remains relatively soft compared to pre-pandemic levels,” said Westpac economist Jameson Coombs.

Long-term German and French 10-year bond yields both fell on the day. By the close of business, the German 10-year yield had lost 5bps to 2.29% while the French 10-year yield finished 6bps lower at 3.00%.

Confidence improved in three of the five sectors of the euro-zone economy. On a geographical basis, the ESI increased in three of four of the euro-zone’s largest economies.

End-of-quarter ESI readings and annual euro-zone GDP growth rates are highly correlated. This latest reading corresponds to a year-to-July GDP growth rate of 0.4%, unchanged from June’s implied growth rate.

12-year low for home approvals in June

30 July 2024

Summary: Home approval numbers down 6.5% in June, fall more than expected; 3.7% lower than June 2023; Westpac miles below pace required to reach Housing Accord target; ACGB yields mostly slightly higher; rate-rise expectations over next six months firm; house approvals down 0.2%, apartments down 18.4%; non-residential approvals down 16.2% in dollar terms, residential alterations up 10.2%.

Building approvals for dwellings, that is apartments and houses, headed south after mid-2018. As an indicator of investor confidence, falling approvals had presented a worrying signal, not just for the building sector but for the overall economy. However, approval figures from late-2019 and the early months of 2020 painted a picture of a recovery taking place, even as late as April of that year. Subsequent months’ figures then trended sharply upwards before falling back through 2021, 2022 and 2023.

The Australian Bureau of Statistics has released the latest figures for June and they show total residential approvals decreased by 6.5% over the month on a seasonally-adjusted basis. The fall was a greater one the 2.8% decline which had been generally expected and in contrast with May’s 5.7% rise after revisions. Total approvals fell by 3.7% on an annual basis, up from the previous month’s revised figure of -8.2%. Monthly growth rates are often volatile.

“At 13,600 in June, total dwelling approvals are still bumping around a 12-year low and an annualised pace of just under 160,000,” said Westpac senior economist Matthew Hassan. “That is miles below the 240,000 per annum pace required to reach the Housing Accord target of 1.2 million new dwellings over the five years to 2029.”

Commonwealth Government bond yields mostly moved a touch higher on the day, with ultra-long yields the exception. By the close of business, 3-year and 10-year ACGB yields had both added 1bp to 3.95% and 4.29% respectively while the 20-year yield finished 1bp lower at 4.63%.

Expectations regarding rate rises in the next six months firmed slightly. Cash futures prices at the end of the day implied the cash rate has some chance of rising above the current rate of 4.34% in the short-term, with an average of 4.39% in August and 4.415% in November. However, February 2025 contracts implied 4.335% and May 2025 contracts implied 4.165%, 18bps less than the current cash rate.

Approvals for new houses slipped by 0.2% over the month, in contrast with May’s 1.2% rise after revisions. On a 12-month basis, house approvals were 10.9% higher than they were in June 2023, down from the previous month’s comparable figure of 12.1%.                                       

Apartment approval figures are usually a lot more volatile and June approvals for this category dropped by 18.4% after a 15.3% rise in May. However, the 12-month contraction rate slowed from May’s revised rate of 32.4% to 26.0%.

Non-residential approvals dropped by 16.2% in dollar terms over the month and were 50.6% lower on an annual basis. Figures in this segment also tend to be rather volatile.

Residential alteration approvals rose by 10.2% in dollar terms over the month and were still 16.8% higher than in June 2023.

Consistent with “soft landing”; US core PCE inflation up 0.2% in June

26 July 2024

Summary: US core PCE price index up 0.2% in June, in line with expectations; annual rate steady at 2.6%; Westpac: consistent with soft landing for US economy; Treasury yields fall; Fed rate-cut expectations firm;

One of the US Fed’s favoured measures of inflation is the change in the core personal consumption expenditures (PCE) price index. After hitting the Fed’s target at the time of 2.0% in mid-2018, the annual rate then hovered in a range between 1.8% and 2.0% before it eased back to a range between 1.5% and 1.8% through 2019. It then plummeted below 1.0% in April 2020 before rising back to around 1.5% in the September quarter of that year. It has since increased significantly and still remains above the Fed’s target even after recent declines.

The latest figures have now been published by the Bureau of Economic Analysis as part of the June personal income and expenditures report. Core PCE prices rose by 0.2% over the month, in line with expectations but up from May’s 0.1% increase. On a 12-month basis, the core PCE inflation rate remained unchanged at 2.6%.

“The outcomes are consistent with a soft landing; inflation is moderating toward the Fed’s 2% target, while the economy and spending continues to grow, albeit at a moderating pace,” said Westpac senior economist Pat Bustamante.

US Treasury bond yields fell moderately across the curve on the day. By the close of business, the 2-year Treasury bond yield had lost 4bps to 4.39%, the 10-year had shed 5bps to 4.19% while the 30-year yield finished 3bps lower at 4.45%.

In terms of US Fed policy, expectations of a lower federal funds rate in the next 12 months firmed, with at least five 25bp cuts currently factored in. At the close of business, contracts implied the effective federal funds rate would average 5.315% in August, 2bps less than the current spot rate, 5.21% in September and 4.92% in November. June 2025 contracts implied 4.03%, 130bps less than the current rate.

The core version of PCE strips out energy and food components, which are volatile from month to month, in an attempt to identify the prevailing trend. It is not the only measure of inflation used by the Fed; the Fed also tracks the Consumer Price Index (CPI) and the Producer Price Index (PPI) from the Department of Labor. However, it is the one measure which is most often referred to in FOMC minutes.

“Goldilocks outcome”; US June quarter GDP growth beats estimates

25 July 2024

Summary: US GDP up 0.7% (2.8% annualised) in June quarter, above expectations; up 3.1% over year; Westpac: data points to goldilocks outcome; US Treasury yields fall; rate-cut expectations firm; Citigroup: caution against extrapolating Q2 strength to coming quarters, expects weakening labour market: GDP price deflator rate accelerates from 2.4% to 2.6%.

US GDP growth slowed in the second quarter of 2019 before stabilising at about 0.5% per quarter.  At the same time, US bond yields suggested future growth rates would be below trend. The US Fed agreed and it reduced its federal funds range three times in the second half of 2019. Pandemic restrictions in the June quarter of 2020 sent parts of the US economy into hibernation; the lifting of those same restrictions sparked a rapid recovery which lasted until 2022.

The US Bureau of Economic Analysis has now released the June quarter’s advance GDP estimate and it indicates the US economy expanded by 0.7% or at an annualised rate of 2.8%. The result was greater than the 0.4% increase (1.8% annualised) which had been generally expected as well as the March quarter’s 0.4% rise. On an annual basis, GDP expanded by 3.1%, up from 2.9% in the previous quarter.

“US economic data pointed to a goldilocks outcome,” said Westpac senior economist Pat Bustamante. “Growth was stronger than expected in the June quarter, with the economy growing at around trend over the first half of 2024, while inflationary pressures continue to dissipate towards the Fed’s target of 2%.”

US GDP numbers are published in a manner which is different to most other countries; quarterly figures are compounded to give an annualised figure. In countries such as Australia and the UK, an annual figure is calculated by taking the latest number and comparing it with the figure from the same period in the previous year. The diagram above shows US GDP once it has been expressed in the normal manner, as well as the annualised figure.

US Treasury bond yields fell moderately across the curve on the day despite the higher-than-expected figure. By the close of business, the 2-year Treasury bond yields had lost 4bps to 4.43%, the 10-year yield had shed 5bps to 4.24% while the 30-year yield finished 6bps lower at 4.48%.

In terms of US Fed policy, expectations of a lower federal funds rate in the next 12 months firmed, with five 25bp cuts currently factored in. At the close of business, contracts implied the effective federal funds rate would average 5.31% in August, 2bps less than the current spot rate, 5.20% in September and 4.925% in November. June 2025 contracts implied 4.055%, 128bps less than the current rate.

“Overall, Fed officials will breathe some sigh of relief that final private domestic demand at 2.6% was equally as strong as in Q1,” said Citigroup Global Markets economist Veronica Clark. “But we would caution against extrapolating Q2 strength to coming quarters and continue to expect a weakening labour market that will have Fed officials cutting rates at each consecutive meeting starting in September.”

One part of the report which is often overlooked are the figures regarding the GDP price deflator, which is another measure of inflation. The GDP price deflator is restricted to new, domestically-produced goods and services and it is not based on a fixed basket as is the case for the consumer price index (CPI). The annual rate accelerated from 2.4% to 2.6%.

ifo index falls again in July; German economy “stuck in crisis”

25 July 2024

Summary: ifo business climate index declines in July, slightly less than expected; “German economy is stuck in crisis”; current conditions, expectations indices both down; German, French yields fall; expectations index implies euro-zone GDP contraction of 0.7% in year to October.

Following recessions in euro-zone economies in 2009/2010, the ifo Institute’s Business Climate Index largely ignored the European debt-crisis of 2010-2012, mostly posting average-to-elevated readings through to early-2020. However, the index was quick to react in the March 2020 survey, falling precipitously before recovering quickly in subsequent months. Readings through much of 2021 generally fluctuated around the long-term average before dropping away in 2022 and stagnating through 2023.

According to the latest report released by ifo, German business sentiment weakened further from its already-depressed level. July’s Business Climate Index posted a reading of 87.0, below the generally expected figure of 89.0 as well as June’s final reading of 88.6. The average reading since January 2005 is just over 96.

“The companies were less satisfied with the current business situation,” said Clemens Fuest, President of the ifo Institute. “Scepticism regarding the coming months has increased considerably. The German economy is stuck in crisis.”

German firms’ views of current conditions and the outlook both deteriorated. The current situation index slipped from 88.3 to 87.1 while the expectations index declined from 88.8 after revisions to 86.9.

German and French long-term bond yields both declined moderately on the day. By the close of business, German and French 10-year yield had both lost 3bps to 2.43% and 3.13% respectively.

The ifo Institute’s business climate index is a composite index which combines German companies’ views of current conditions with their outlook for the next six months. It has similarities to consumer sentiment indices in the US such as the ones produced by The Conference Board and the University of Michigan.                                 

It also displays a solid correlation with euro-zone GDP growth rates. However, the expectations index is a better predictor as it has a higher correlation when lagged by one quarter. July’s expectations index implies a 0.7% year-on-year GDP contraction to the end of October.  

Click for more news