News

Slow recovery expected; US leading index decline continues in June

18 July 2024

Summary: Conference Board leading index down 0.2% in June, smaller than expected decline; CB: fuelled by gloomy consumer expectations, weak new orders, negative interest rate spread, initial jobless claims; US Treasury yields up; rate-cut expectations soften; CB: activity likely to continue to lose momentum in months ahead; regression analysis implies flat GDP in year to September.

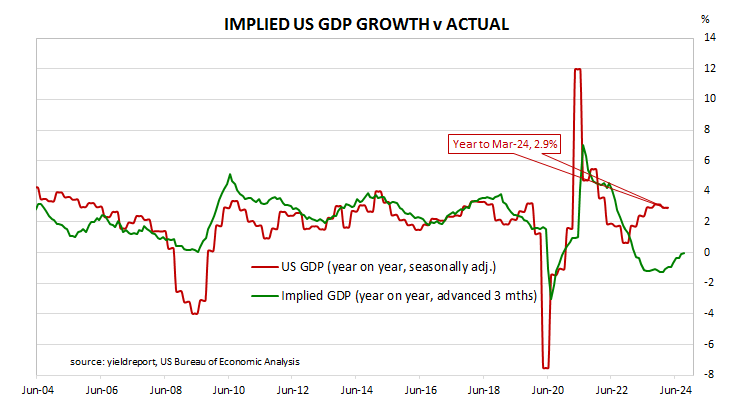
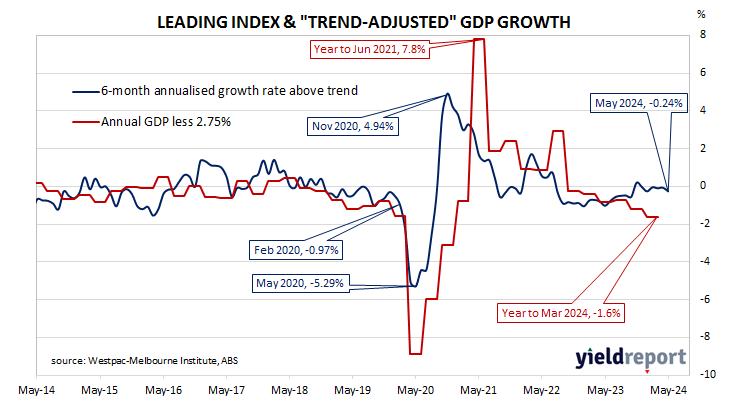
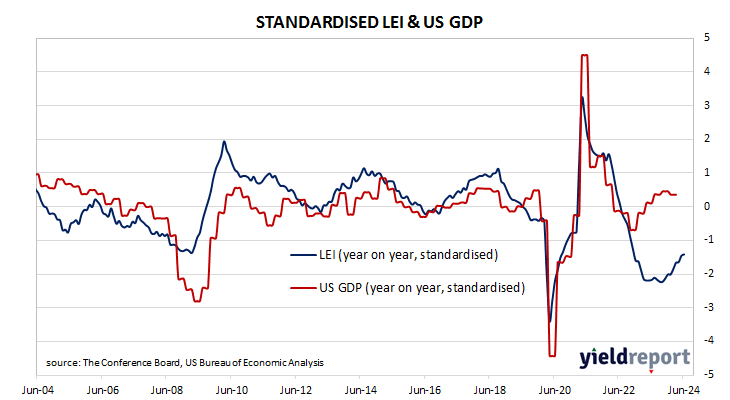
The Conference Board Leading Economic Index (LEI) is a composite index composed of ten sub-indices which are thought to be sensitive to changes in the US economy. The Conference Board describes it as an index which attempts to signal growth peaks and troughs; turning points in the index have historically occurred prior to changes in aggregate economic activity. Readings from March and April of 2020 signalled “a deep US recession” while subsequent readings indicated the US economy would recover rapidly. Readings post-2022 implied US GDP growth rates would turn negative but that has not been the case so far.

The latest reading of the LEI indicates it decreased by 0.2% in June. The fall was a slightly smaller one than the 0.3% decline which had been generally expected as well as May’s 0.4% decrease.

“The decline continued to be fuelled by gloomy consumer expectations, weak new orders, negative interest rate spread and an increased number of initial claims for unemployment,” said Justyna Zabinska-La Monica of The Conference Board. “However, due to the smaller month-on-month rate of decline, the LEI’s long-term growth has become less negative, pointing to a slow recovery.”

US Treasury bond yields increased by moderate amounts along the curve on the day. By the close of business, the 2-year Treasury yield had gained 3bps to 4.47% while 10-year and 30-year yields both finished 4bps higher at 4.20% and 4.42% respectively.

In terms of US Fed policy, expectations of a lower federal funds rate in the next 12 months softened, albeit with five 25bp cuts currently factored in. At the close of business, contracts implied the effective federal funds rate would average 5.315% in August, 2bps less than the current spot rate, 5.22% in September and 4.955% in November. June 2025 contracts implied 4.07%, 126bps less than the current rate.

“Taken together, June’s data suggest that economic activity is likely to continue to lose momentum in the months ahead,” said Justyna Zabinska-La Monica. “We currently forecast that cooling consumer spending will push US GDP growth down to around 1 percent annualized in Q3 of this year.”

Regression analysis suggests the latest reading implies a flat year-on-year growth rate in September, up from -0.1% for the year-to-August growth rate.

“A solid advance”; US industrial output up 0.6% in June

17 July 2024

Summary: US industrial output up 0.6% in June, greater than expected; up 1.6% over past 12 months; Westpac: solid advance suggests US manufacturing activity could be improving; US Treasury yields up modestly; rate-cut expectations soften slightly; capacity utilisation rate rises to 78.8%.

The Federal Reserve’s industrial production (IP) index measures real output from manufacturing, mining, electricity and gas company facilities located in the United States. These sectors are thought to be sensitive to consumer demand and so some leading indicators of GDP use industrial production figures as a component. US production collapsed through March and April of 2020 before recovering the ground lost over the fifteen months to July 2021. However, production levels has largely stagnated since early 2022.

According to the Federal Reserve, US industrial production rose by 0.6% on a seasonally adjusted basis in June. The result was considerably greater than the 0.3% increase which had been generally expected but lower than May’s 0.9% rise. On an annual basis the growth rate rose from May’s downwardly revised figure of 0.3% to 1.6%.

“Industrial production posted a solid advance for a second straight month in June, helped by gains in factory output that suggests manufacturing activity could be improving,” said Westpac Business Bank Chief Economist Besa Deda.

US Treasury bond yields generally increased by modest amounts along the curve on the day. By the close of business, the 2-year Treasury yield had gained 2bps to 4.44%, the 10-year yield had returned to its starting point at 4.16% while the 30-year yield finished 1bp higher at 4.38%.

In terms of US Fed policy, expectations of a lower federal funds rate in the next 12 months softened slightly, albeit with five 25bp cuts currently factored in. At the close of business, contracts implied the effective federal funds rate would average 5.32% in August, 1bp less than the current spot rate, 5.22% in September and 4.95% in November. June 2025 contracts implied 3.96%, 127bps less than the current rate.

The same report includes capacity utilisation figures which are generally accepted as an indicator of future investment expenditure and/or inflationary pressures. Capacity usage hit a high for the last business cycle in early 2019 before it began a downtrend which ended with April 2020’s multi-decade low of 64.2%. June’s reading rose by 0.5 percentage points after revisions to 78.8%, 1.3 percentage points below the long-term average.

While the US utilisation rate’s correlation with the US jobless rate is solid, it is not as high as the comparable correlation in Australia.

Lacklustre growth continuing; June Westpac-MI leading index remains in red

17 July 2024

Summary: Leading index growth rate up in June; Westpac: lacklustre growth momentum continuing; reading implies annual GDP growth of around 2.25%-2.50%; ACGB yields steady; rate-rise expectations soften; main movements over past six months are significantly weaker commodity prices, stabilisation of monthly hours worked.

Westpac and the Melbourne Institute describe their Leading Index as a composite measure which attempts to estimate the likely pace of Australian economic growth in the short-term. After reaching a peak in early 2018, the index trended lower through 2018 and 2019 before plunging to recessionary levels in the second quarter of 2020. Subsequent readings spiked towards the end of 2020 but then trended lower through 2021 and 2022 before flattening out in 2023 and 2024.

June’s reading has now been released and the six month annualised growth rate of the indicator registered -0.13%, up from May’s revised figure of -0.28%. The index reading represents a rate relative to “trend” GDP growth, which is generally thought to be around 2.50% to 2.75% per annum in Australia.

“Despite a marginally improved read in June, the Leading Index growth rate remains subdued, pointing to lacklustre growth momentum continuing through the second half of 2024 and into early 2025,” said Westpac senior economist Matthew Hassan.

Westpac states the index leads GDP growth by “three to nine months into the future” but the highest correlation between the index and actual GDP figures occurs with a three-month lead. The current reading may therefore be considered to be indicative of an annual GDP growth rate of around 2.25% to 2.50% in the next quarter

Domestic Treasury bond yields remained stable on the day. By the close of business, 3-year, 10-year and 20-year  ACGB yields had all returned to their starting points at 3.93%, 4.26% and 4.60% respectively.

Expectations regarding rate rises in the next twelve months softened slightly. Cash futures prices at the end of the day implied the cash rate has some chance of rising above the current rate of 4.34% in the short-term, with an average of 4.37% in August and 4.385% in November. However, February 2025 contracts implied 4.31% and May 2025 contracts implied 4.16%, 18bps less than the current cash rate.

“The Leading Index growth rate has slipped back a little over the first half of 2024, moving from –0.05% in December to the current –0.13%,” Hassan added. “The main component moves over this period have been a significant weakening in commodity prices and a stabilisation in monthly hours worked, the former taking 0.31 percentage points off the Index growth rate and the latter adding 0.22 percentage points.”

Westpac is currently forecasting GDP growth to be 1.6% in calendar 2024, rising to 2.3% in calendar 2025. The RBA’s May Statement on Monetary Policy also forecasts GDP growth for the years ending December 2024 and December 2025 to be 1.6% and 2.3% respectively.

US retail sales flat in June; “displaying some resilience”

16 July 2024

Summary: US retail sales flat in June, more than expected; annual growth rate slows to 2.3%; Westpac: consumers are displaying some resilience; US Treasury yields fall; rate-cut expectations harden; ANZ: control group sales beat expectations, rises 0.9%; higher sales in ten of thirteen categories; vehicle, parts sales fall largest single influence on month’s result

US retail sales had been trending up since late 2015 but, commencing in late 2018, a series of weak or negative monthly results led to a drop-off in the annual growth rate below 2.0%. Growth rates then increased in trend terms through 2019 and into early 2020 until pandemic restrictions sent them into negative territory. A “v-shaped” recovery then took place which was followed by some short-term spikes as federal stimulus payments hit US households in 2021. However, growth rates have slowed significantly since mid-2022.

According to the latest “advance” numbers released by the US Census Bureau, total retail sales remained flat in June. The result was greater than the 0.2% decline which had been generally expected but down from May’s 0.3% rise after it was revised up from 0.1%. On an annual basis, the growth rate slowed from May’s revised rate of 2.6% to 2.3%.

“This better-than-expected report from the Commerce Department shows consumers are displaying some resilience in the US economy,” said Westpac Business Bank Chief Economist Besa Deda.

US Treasury bond yields fell by increasing amounts out along the curve on the day. By the close of business, the 2-year Treasury yield had lost 4bps to 4.42%, the 10-year yield had shed 7bps to 4.16% while the 30-year yield finished 9bps lower at 4.37%.

In terms of US Fed policy, expectations of a lower federal funds rate in the next 12 months hardened, with five 25bp cuts currently factored in. At the close of business, contracts implied the effective federal funds rate would average 5.31% in August, 2bps less than the current spot rate, 5.21% in September and 4.94% in November. June 2025 contracts implied 3.935%, 129bps less than the current rate.

“However, control group sales beat expectations, rising 0.9%,” said ANZ economist Kishti Sen. “Control group sales are important because that element is used to prepare estimates of control private consumption expenditure which is a large part of GDP. That showed resilience in consumer expenditure.”

Ten of the thirteen categories recorded higher sales over the month. However, the “Motor vehicle & parts dealers” segment provided the largest single influence on the overall result, falling by 2.0% over the month and contributing -0.38 percentage points to the total.  “Non-store retailer” sales also had a large influence on the total, with a 1.9% rise for the segment and a 0.32 percentage point contribution to the total.

The non-store segment includes vending machine sales, door-to-door sales and mail-order sales but nowadays this segment has become dominated by online sales. It accounts for around 17% of all US retail sales and it is the second-largest segment after vehicles and parts.

US household sentiment “stubbornly subdued”; UoM index declines in July

12 July 2024

Summary: University of Michigan consumer confidence index falls in July, reading slightly less than expected; views of present conditions, future conditions both deteriorate; nearly half of consumers still object to impact of high prices; US Treasury yields fall; rate-cut expectations firm; inflation expectations decline.

US consumer confidence started 2020 at an elevated level but, after a few months, surveys began to reflect a growing unease with the global spread of COVID-19 and its reach into the US. Household confidence plunged in April 2020 and then recovered in a haphazard fashion, generally fluctuating at below-average levels according to the University of Michigan. The University’s measure of confidence had recovered back to the long-term average by April 2021 but then it plunged again in the September quarter and remained at historically low levels through 2022 and 2023.

The latest survey conducted by the University indicates confidence among US households has deteriorated further in July. The preliminary reading of the Index of Consumer Sentiment registered 66.0, slightly less than the 67.0 which had been generally expected as well as June’s final figure of 68.2.

Consumers’ views of current conditions and their views of future conditions both deteriorated relative to those held at the time of the June survey.

“Although sentiment is more than 30% above the trough from June 2022, it remains stubbornly subdued,” said the University’s Surveys of Consumers Director Joanne Hsu. “Nearly half of consumers still object to the impact of high prices, even as they expect inflation to continue moderating in the years ahead.”

Short-term US Treasury bond yields fell noticeably while longer-term yields fell more modestly on the day. By the close of business, the 2-year Treasury yield had lost 7bps to 4.45% while 10-year and 30-year yields both finished 2bps lower at 4.19% and 4.40% respectively.

In terms of US Fed policy, expectations of a lower federal funds rate in the next 12 months firmed, with five 25bp cuts currently factored in. At the close of business, contracts implied the effective federal funds rate would average 5.315% in August, 2bps less than the current spot rate, 5.22% in September and 4.955% in November. June 2025 contracts implied 4.07%, 126bps less than the current rate.

US consumer inflation expectations continued to decline. Year-ahead expectations slowed from 3.0% to 2.9%, as did consumers’ long-term expectations.

It was once thought less-confident households are generally inclined to spend less and save more; some decline in household spending could be expected to follow. However, recent research suggests the correlation between household confidence and retail spending is quite weak.

US June PPI figures exceed estimates; do little to sway Fed rate cut expectations

12 July 2024

Summary: US producer price index (PPI) up 0.2% in June, slightly higher than expected increase; annual rate accelerates to 2.7%; “core” PPI up 0.4% over month, up 3.0% over year; ANZ: increase is attributable to a 1.9% jump in margins for final demand trade services; US Treasury yields fall; rate-cut expectations firm; Westpac; upside surprises do little to sway expectations of upcoming rate cuts; services prices up 0.6%, goods prices down 0.5%.

Around the end of 2018, the annual inflation rate of the US producer price index (PPI) began a downtrend which continued through 2019. Months in which producer prices increased suggested the trend may have been coming to an end, only for it to continue, culminating in a plunge in April 2020. Figures returned to “normal” towards the end of that year but then moved well above the long-term average in 2021 and 2022 before falling back over 2023.

The latest figures published by the Bureau of Labor Statistics indicate producer prices increased by 0.2% in June after seasonal adjustments. The result was slightly higher than the 0.1% increase which had been generally expected and it was up from May’s flat figure which was revised from -0.2%. On a 12-month basis, the rate of producer price inflation after seasonal adjustments accelerated from May’s upwardly-revised figure of 2.4% to 2.7%.

Producer prices excluding foods and energy, or “core” PPI, increased by 0.4% after seasonal adjustments. The result was greater than the 0.2% increase which had been generally expected as well as May’s 0.3% rise. The annual growth rate increased from 2.6% after revisions to 3.0%.

“Nearly all the June increase is attributable to a 1.9% jump in margins for final demand trade services, [that is], changes in margins received by wholesalers and retailers,” said ANZ Head of FX Research Mahjabeen Zaman.

Short-term US Treasury bond yields fell noticeably while longer-term yields fell more modestly on the day. By the close of business, the 2-year Treasury yield had lost 7bps to 4.45% while 10-year and 30-year yields both finished 2bps lower at 4.19% and 4.40% respectively.

In terms of US Fed policy, expectations of a lower federal funds rate in the next 12 months firmed, with five 25bp cuts currently factored in. At the close of business, contracts implied the effective federal funds rate would average 5.315% in August, 2bps less than the current spot rate, 5.22% in September and 4.955% in November. June 2025 contracts implied 4.07%, 126bps less than the current rate.

“However, the stronger-than-expected headline figures are less of a focus; more important is how the PPI and earlier consumer price index data flow into the Fed’s preferred inflation measure, the personal consumption expenditure deflator,” said Westpac economist Jameson Coombs. “Here, the upside surprises, which were concentrated on retail margins, did little to sway expectations that Fed members will be pleased by June’s PCE figures, strengthening the case to commence easing policy.”

The BLS stated the fall of the index was attributable to a 0.6% increase in services prices. The final demand goods index fell by 0.5%.

The producer price index is a measure of prices received by producers for domestically produced goods, services and construction. It is put together in a fashion similar to the consumer price index (CPI) except it measures prices received from the producer’s perspective rather than from the perspective of a retailer or a consumer. It is another one of the various measures of inflation tracked by the US Fed, along with core personal consumption expenditure (PCE) price data. 

Disinflationary impulse gathering momentum; US CPI down 0.1% in June

11 July 2024

Summary: US CPI down 0.1% in June, contrasts with expected rise; annual inflation rate slows from 3.3% to 3.0%; “core” rate up 0.1%, up 3.3% over year; Westpac: disinflationary impulse quickly gathering momentum; Treasury yields fall significantly; rate-cut expectations harden; energy prices main driver of overall result.

The annual rate of US inflation as measured by changes in the consumer price index (CPI) halved from nearly 3% in the period from July 2018 to February 2019. It then fluctuated in a range from 1.5% to 2.0% through 2019 before rising above 2.0% in the final months of that year. Substantially lower rates were reported from March 2020 to May 2020 and they remained below 2% until March 2021. They then rose significantly before declining from mid-2022 to mid-2023.

The latest US CPI figures released by the Bureau of Labor Statistics indicated seasonally-adjusted consumer prices declined by 0.1% on average in June. The fall contrasted with the 0.1% rise which had been generally expected and it was down from May’s flat result. On a 12-month basis, the inflation rate slowed from 3.3% to 3.0%.

“Headline” inflation is known to be volatile and so references are often made to “core” inflation for analytical purposes. The core prices index, the index which excludes the more variable food and energy components, increased by 0.1% on a seasonally-adjusted basis over the month, less than the 0.2% which had been generally expected. The annual growth rate slowed from May’s rate of 3.4% to 3.3%.

“The outcome suggests that the disinflationary impulse is quickly gathering momentum, supporting the case for US rate cuts in coming months,” said Westpac senior economist Pat Bustamante. 

US Treasury bond yields fell significantly on the day. By the close of business, the 2-year Treasury yield had shed 10bps to 4.52%, the 10-year yield had lost 8bps to 4.21% while the 30-year yield finished 6bps lower at 4.42%.

In terms of US Fed policy, expectations of a lower federal funds rate in the next 12 months hardened, with nearly five 25bp cuts currently factored in. At the close of business, contracts implied the effective federal funds rate would average 5.31% in August, 2bps less than the current spot rate, 5.215% in September and 4.965% in November. June 2025 contracts implied 4.115%, 122bps less than the current rate.

The largest influence on headline results is often the change in fuel prices. Prices of “Energy commodities”, the segment which contains vehicle fuels, decreased by 3.7% and contributed -0.14 percentage points to the total. Prices of non-energy services, the segment which includes actual and implied rents, contributed 0.06 percentage points after they increased by 0.1% on average.

Stuck in deeply pessimistic range; consumer sentiment declines in July

09 July 2024

Summary: Westpac-Melbourne Institute consumer sentiment index declines in July; Westpac: sentiment stuck in deeply pessimistic range for 2 years; ACGB yields decline; rate-rise expectations soften; Westpac: persistent inflation, further interest rate rises fears offsetting tax-cut boost; two of five sub-indices lower; fewer respondents expecting higher jobless rate.

After a lengthy divergence between measures of consumer sentiment and business confidence in Australia which began in 2014, confidence readings of the two sectors converged again in mid-July 2018. Both measures then deteriorated gradually in trend terms, with consumer confidence leading the way. Household sentiment fell off a cliff in April 2020 but, after a few months of to-ing and fro-ing, it then staged a full recovery. However, consumer sentiment then weakened considerably and has languished at pessimistic levels since mid-2022 while business sentiment has been more robust.

According to the latest Westpac-Melbourne Institute survey conducted over the first week of July, household sentiment has deteriorated, partially reversing a modest improvement in June and maintaining a level which is quite pessimistic. Their Consumer Sentiment Index declined from June’s reading of 83.6 to 82.7, a reading which is significantly lower than the long-term average reading of just over 101 and well below the “normal” range.

“Sentiment remains stuck in the same deeply pessimistic range that has dominated for two years now,” said Westpac senior economist Matthew Hassan.

Any reading of the Consumer Sentiment Index below 100 indicates the number of consumers who are pessimistic is greater than the number of consumers who are optimistic.

Australian Commonwealth Government bond yields declined modestly across the curve on the day. By the close of business, the 3-year ACGB yield had slipped 1bp to 4.08% while 10-year and 20-year yields both finished 2bps lower at 4.35% and 4.68% respectively.

Expectations regarding rate rises in the next twelve months softened a touch. Cash futures prices at the end of the day implied the cash rate has some chance of rising above the current rate of 4.34% in the short-term, with an average of 4.39% in August, 4.45% in November and 4.425% in February 2025. However, May 2025 contracts implied 4.32%, 2bps less than the current cash rate.

“The July update shows that fears of persistent inflation and further interest rate rises are again weighing more heavily on the consumer mood,” added Hassan, “offsetting any boost from the arrival of the ‘stage 3’ tax cuts and other fiscal support measures.”

Two of the five sub-indices registered lower readings, with the “Family finances versus a year ago” sub-index posting the largest monthly percentage loss. 

The Unemployment Expectations index, formerly a useful guide to RBA rate changes, fell back from 133.1 to 128.6, in line with the long-term average. Lower readings result from fewer respondents expecting a higher unemployment rate in the year ahead.

NAB June business indices: conditions worsen, confidence improves

09 July 2024

Summary: Business conditions deteriorate for fourth consecutive month in June; business confidence improves, still  below average; NAB: condition weaken across range of sectors; ACGB yields decline; rate-rise expectations soften; NAB: lines up with slowing in activity but demand still high relative to supply; capacity utilisation rate up, at elevated level.

NAB’s business survey indicated Australian business conditions were robust in the first half of 2018, with a cyclical-peak reached in April of that year. Readings from NAB’s index then began to slip and forecasts of a slowdown in the domestic economy began to emerge in the first half of 2019 as the index trended lower. It hit a nadir in April 2020 as pandemic restrictions were introduced but then improved markedly over the next twelve months and subsequently remained at robust levels until recently.

According to NAB’s latest monthly business survey of around 400 firms conducted in the last week of June, business conditions deteriorated for a fourth consecutive month and are now at a level below the long-term average. NAB’s conditions index registered 4 points, down 2 point from May’s reading.

Conversely, business confidence improved.  NAB’s confidence index rose 6 points to +4 points, a reading which is still below the long-term average.  NAB’s confidence index typically leads the conditions index by one month, although some divergences have appeared from time to time.

“Conditions declined in wholesale, construction, manufacturing and finance, business and property in the month, with the non-mining goods sectors now clearly softer than the services sectors,” said NAB Chief Economist Alan Oster. “Retail, despite increasing in the month, remains weakest and the only industry in negative territory in trend terms.”

Australian Commonwealth Government bond yields declined modestly across the curve on the day. By the close of business, the 3-year ACGB yield had slipped 1bp to 4.08% while 10-year and 20-year yields both finished 2bps lower at 4.35% and 4.68% respectively.

Expectations regarding rate rises in the next twelve months softened a touch. Cash futures prices at the end of the day implied the cash rate has some chance of rising above the current rate of 4.34% in the short-term, with an average of 4.39% in August, 4.45% in November and 4.425% in February 2025. However, May 2025 contracts implied 4.32%, 2bps less than the current cash rate.

“This all lines up with the slowing in activity we have seen more broadly but also with a still high level of demand, relative to supply in the economy,” Oster added. “Consistent with this, price and cost growth variables generally remain elevated.”

NAB’s measure of national capacity utilisation ticked up from 83.3% to 83.5%, a level which is quite elevated from a historical perspective. Seven of the eight sectors of the economy were reported to be operating at or above their respective long-run averages, the wholesale sector the one exception.

Capacity utilisation is generally accepted as an indicator of future investment expenditure and it also has a strong inverse relationship with Australia’s unemployment rate.

May home loan approvals slip; still up 8.6% in 2024

08 July 2024

Summary: Value of loan commitments down 1.7% in May, contrasts with expected rise; 18.0% higher than May 2023; ANZ: lending still up 8.6% in 2024; ACGB yields down; rate-rise expectations soften; Westpac: does not alter wider narrative of price-led upswing; value of owner-occupier loan approvals down 2.0%; value of investor approvals down 1.3%; number of owner-occupier home loan approvals down 1.6%.

The number and value of home-loan approvals began to noticeably increase after the RBA reduced its cash rate target in a series of cuts beginning in mid-2019, potentially ending the downtrend which had been in place since mid-2017. Figures from February through to May of 2020 provided an indication the downtrend was still intact but subsequent figures then pushed both back to record highs in 2021. After a considerable pullback in 2022 both the value and number of approved loans resumed rising in 2023.

May’s housing finance figures have now been released and total loan approvals excluding refinancing decreased by 1.7% In dollar terms over the month, in contrast with the 1.8% rise which had been generally expected as well as April’s 4.8% increase. On a year-on-year basis, total approvals excluding refinancing were 18.0% higher than May 2023, down from the previous month’s comparable figure of 24.9% after revisions.

“This is weaker than the market expected but comes after three months of growth, with lending up 8.6% so far in 2024,” said ANZ senior economist Blair Chapman. “Ongoing growth in lending in Western Australian and Queensland was not enough to overcome declines in most other states and territories in May.”

Commonwealth Government bond yields fell moderately on the day, lagging the larger falls of US Treasury yields on Friday night (AEST). By the close of business, 3-year and 10-year ACGB yields had both lost 4bps to 4.09% and 4.37% respectively while the 20-year yield finished 3bps lower at 4.70%.

Expectations regarding rate rises in the next twelve months softened by the end of the day. In the cash futures market, contracts implied the cash rate has some chance of rising above the current rate of 4.34% in the short-term, with an average of 4.395% in August and 4.46% in November. February 2025 contracts implied 4.435% while May 2025 contracts implied 4.335%, essentially in line with the current cash rate.

“Overall, the May update checks some of the strength seen over the last few months but does not alter the wider narrative of a price-led upswing,” said Westpac senior economist Matthew Hassan. “That said, moderating price gains and flattening turnover does appear to be taking some of the pace out of the upswing in the major eastern states.”

The total value of owner-occupier loan commitments excluding refinancing decreased by 2.0%, a partial reversing of April’s 4.5% rise. On an annual basis, owner-occupier loan commitments were 12.2% higher than in May 2023, down from April’s comparable figure of 19.1%.

The total value of investor commitments excluding refinancing decreased by 1.3%. The fall follows a 5.3% increase in April, taking the growth rate over the previous 12 months from 36.3% to 29.5%.

The total number of loan commitments to owner-occupiers excluding refinancing decreased by 1.6% to 26880 on a seasonally adjusted basis, once again contrasting with April’s 2.6% increase. The annual growth rate slowed from 8.9% after revisions to 3.3%.

Click for more news