News

Downward revisions mar US June jobs report

05 July 2024

Summary: US non-farm payrolls up 206,000 in June, above expectations; previous two months’ figures revised down by 111,000; jobless rate ticks up to 4.1%, participation rate inches up to 62.6%; Westpac: signs of cooling; US Treasury yields fall; expectations of Fed rate cuts harden; employed-to-population ratio steady at 60.1%; underutilisation rate steady at 7.4%; annual hourly pay growth slows to 3.9%.

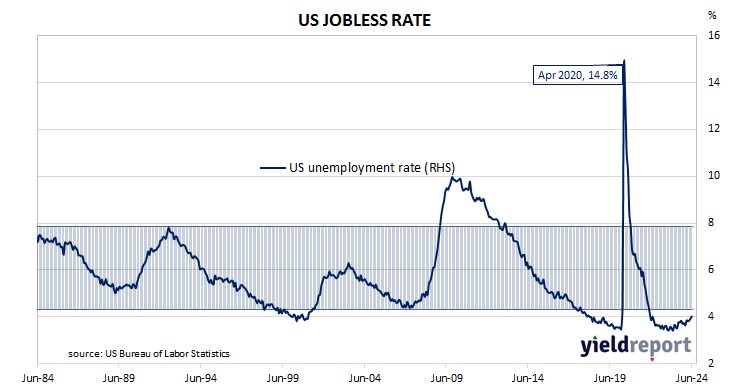
The US economy ceased producing jobs in net terms as infection controls began to be implemented in March 2020. The unemployment rate had been around 3.5% but that changed as job losses began to surge through March and April of 2020. The May 2020 non-farm employment report represented a turning point and subsequent months provided substantial employment gains which have continued to the present.

According to the US Bureau of Labor Statistics, the US economy created an additional 206,000 jobs in the non-farm sector in June. The increase was more than the 188,000 rise which had been generally expected but less than the 218,000 jobs which had been added in May. Employment figures for May and April were revised down by a total of 111,000.

The total number of unemployed increased by 162,000 to 6.811 million while the total number of people who were either employed or looking for work increased by 278,000 to 168.010 million. These changes led to the US unemployment rate ticking up from May’s figure of 4.0% to 4.1%. The participation rate crept up from 62.5% to 62.6%.

“The labour market showed signs of cooling, as the unemployment rate edged higher in June and the pace of jobs growth in recent months was shown to have been lower than previously reported,” said Besa Deda, Chief Economist at Westpac Business Bank.

US Treasury bond yields fell across the curve on the day, with falls heaviest at the short end. By the close of business, the 2-year yield had shed 10bps to 4.61%, the 10-year yield had lost 7bps to 4.28% while the 30-year yield finished 4bps lower at 4.48%.

In terms of US Fed policy, expectations of a lower federal funds rate in the next 12 months hardened, with around four 25bp cuts currently factored in. At the close of business, contracts implied the effective federal funds rate would average 5.31% in August, 2bps less than the current spot rate, 5.235% in September and 5.035% in November. June 2025 contracts implied 4.245%, 108bps less than the current rate.

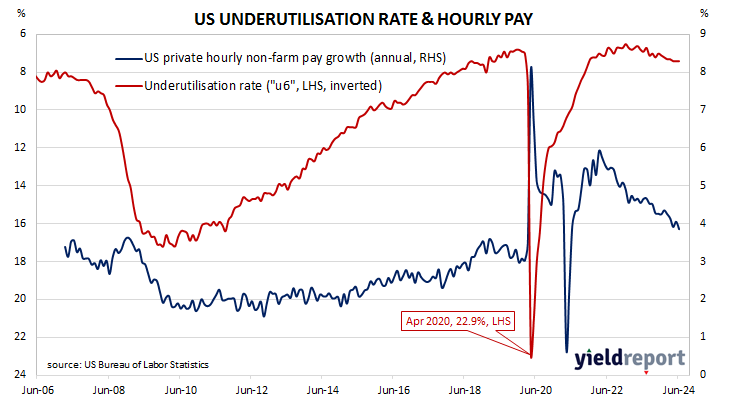
One figure which is indicative of the “spare capacity” of the US employment market is the employment-to-population ratio. This ratio is simply the number of people in work divided by the total US population. It hit a cyclical-low of 58.2 in October 2010 before slowly recovering to just above 61% in early 2020. June’s reading remained unchanged at 60.1%, some way from the April 2000 peak reading of 64.7%.

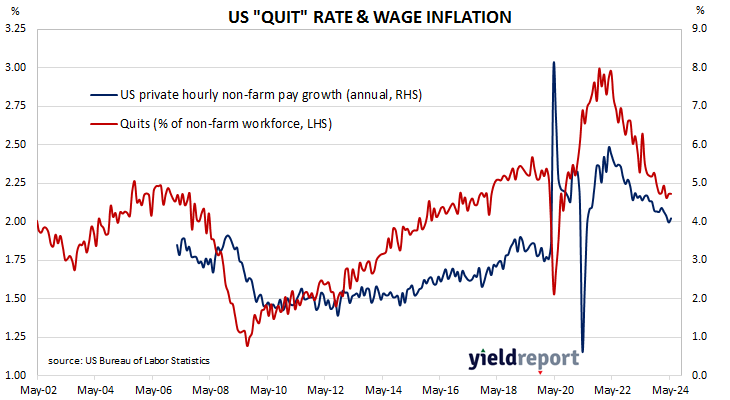
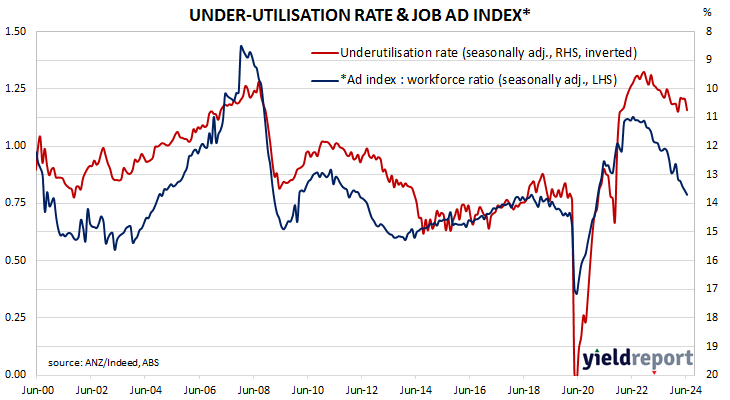
Apart from the unemployment rate, another measure of tightness in the labour market is the underutilisation rate and the latest reading of it registered 7.4%, unchanged from May. Wage inflation and the underutilisation rate usually have an inverse relationship; private hourly pay growth in the year to June fell back from 4.1% to 3.9%.

Seasonal factors, early sales, boost May retail sales

03 July 2024

Summary: Retail sales up 0.6% in May, noticeably more than expected; up 1.7% on 12-month basis; ANZ: seasonal factors at play, end-of-financial year sales ramping up earlier; ACGB yields rise modestly; rate-rise expectations firm; Westpac strong population growth cushioning hit to retailers; largest influence on result from food sales.

Growth figures of domestic retail sales spent most of the 2010s at levels below the post-1992 average. While economic conditions had been generally favourable, wage growth and inflation rates were low. Expenditures on goods then jumped in the early stages of 2020 as government restrictions severely altered households’ spending habits. Households mostly reverted to their usual patterns as restrictions eased in the latter part of 2020 and throughout 2021.

According to the latest ABS figures, total retail sales rose by 0.6% on a seasonally adjusted basis in May. The rise was noticeably more than the 0.3% increase which had been generally expected as well as April’s 0.1% increase. Sales increased by 1.7% on an annual basis, up from 1.2% after revisions.

“On face value it looks like a strong print, but there could be some seasonal factors at play with end-of-financial year sales ramping up earlier this year,” said ANZ economist Madeline Dunk.  

The update was released on the same day as the latest dwelling approval figures and Commonwealth Government bond yields moved modestly higher on the day, in contrast with the falls of US yields on Tuesday night. By the close of business, 3-year, 10-year and 20-year ACGB yields had all added 2bps to 4.13%, 4.44% and 4.76% respectively.

Expectations regarding rate rises in the next twelve months firmed slightly by the end of the day. In the cash futures market, contracts implied the cash rate has some chance of rising above the current rate of 4.32% in the short-term, with an average of 4.40% in August and 4.47% in November. February 2025 contracts implied 4.455% while May 2025 contracts implied 4.37%, 5bps above the current cash rate.

“All up, despite a slightly better tone, the May retail results still point to a consumer under intense pressure, strong population growth doing a lot to cushion the hit to retailers,” said Westpac senior economist Matthew Hassan. “The July tax cuts should see some reprieve as we move into the second half of the year, although exactly how much rests heavily on how much of this consumers choose to save rather than spend.”

Retail sales are typically segmented into six categories (see below), with the “Food” segment accounting for 40% of total sales. Accordingly, the largest influence on the month’s total came from this segment where sales rose by 0.7%.

May home approvals up 5.5%; “still bumping around decade lows”

03 July 2024

Summary: Home approval numbers up 5.5%% in May, more than expected; 8.5% lower than May 2023; Westpac: still bumping around decade lows; ACGB yields rise modestly; rate-rise expectations firm; ANZ: may see more modest growth in unit approvals in next month or two; house approvals up 1.3%, apartments up 14.2%; non-residential approvals down 0.9% in dollar terms, residential alterations down 6.2%.

Building approvals for dwellings, that is apartments and houses, headed south after mid-2018. As an indicator of investor confidence, falling approvals had presented a worrying signal, not just for the building sector but for the overall economy. However, approval figures from late-2019 and the early months of 2020 painted a picture of a recovery taking place, even as late as April of that year. Subsequent months’ figures then trended sharply upwards before falling back through 2021, 2022 and 2023.

The Australian Bureau of Statistics has released the latest figures for May and they show total residential approvals increased by 5.5% over the month on a seasonally-adjusted basis. The rise was greater than the 1.7% gain which had been generally expected as well as April’s 1.9% rise after revisions. However, total approvals fell by 8.5% on an annual basis, a turnaround from the previous month’s revised figure of +5.1%. Monthly growth rates are often volatile.

“Despite this (exceeding expectations), approvals are still bumping around decade lows, stuck in the range that has prevailed since early 2023,” said Westpac senior economist Matthew Hassan. “And to the extent that there are more promising signs around detached houses, at least some of this looks to be a temporary pull forward effect associated with state government regulatory changes.

The figures were released on the same day as the latest retail sales number and Commonwealth Government bond yields moved modestly higher on the day, in contrast with the falls of US yields on Tuesday night. By the close of business, 3-year, 10-year and 20-year ACGB yields had all added 2bps to 4.13%, 4.44% and 4.76% respectively.

Expectations regarding rate rises in the next twelve months firmed slightly by the end of the day. In the cash futures market, contracts implied the cash rate has some chance of rising above the current rate of 4.32% in the short-term, with an average of 4.40% in August and 4.47% in November. February 2025 contracts implied 4.455% while May 2025 contracts implied 4.37%, 5bps above the current cash rate.

“Unit approvals also spiked in May last year, suggesting we may see more modest growth in unit approvals in the next month or two,” said ANZ economist Madeline Dunk.

Approvals for new houses increased by 1.3% over the month, up from April’s 0.5% rise after revisions. On a 12-month basis, house approvals were 12.1% higher than they were in May 2023, up from the previous month’s comparable figure of 10.1%.                                

Apartment approval figures are usually a lot more volatile and May approvals for this category rose by 14.2% after a 5.1% rise in April. However, the 12-month growth rate went further into reverse, from April’s revised rate of -4.1% to -32.1%.

Non-residential approvals decreased by 0.9% in dollar terms over the month and were 16.3% lower on an annual basis. Figures in this segment also tend to be rather volatile.

Residential alteration approvals fell by 6.2% in dollar terms over the month but were still 5.1% higher than in May 2023.

US quit rate stability continues; labour market coming into balance

02 July 2024

Summary: US quit rate steady at 2.2% in May; Westpac: provides further evidence of labour demand, supply coming into balance; US Treasury yields decline; expectations of Fed rate cuts soften; Westpac: job opening rate little changed from May, within 0.5% of pre-pandemic level; more quits, openings, separations.

The number of US employees who quit their jobs as a percentage of total employment increased slowly but steadily after the GFC. It peaked in March 2019 and then tracked sideways until virus containment measures were introduced in March 2020. The quit rate then plummeted as alternative employment opportunities rapidly dried up. Following the easing of US pandemic restrictions, it proceeded to recover back to its pre-pandemic rate in the third quarter of 2020 and trended higher through 2021 before easing through 2022 and 2023.

Figures released as part of the latest Job Openings and Labor Turnover Survey (JOLTS) report show the quit rate remained steady in May. 2.2% of the non-farm workforce left their jobs voluntarily, unchanged from April. Quits in the month increased by 7,000 while an additional 272,000 people were employed in non-farm sectors.

“The May JOLTS survey provided further evidence of labour demand and supply coming into balance,” said Westpac senior economist Pat Bustamante.

US Treasury yields declined modestly across the curve on the day. By the close of business, 2-year, 10-year and 30-year Treasury bond yields had each lost 2bps to 4.74%, 4.44% and 4.61% respectively.

In terms of US Fed policy, expectations of a lower federal funds rate in the next 12 months softened slightly, albeit with close to four 25bp cuts currently factored in. At the close of business, contracts implied the effective federal funds rate would average 5.31% in August, 2bps less than the current spot rate, 5.245% in September and 5.075% in November. June 2025 contracts implied 4.405%, 93bps less than the current rate.

The rise in total quits was led by 32,000 more resignations in the “Professional and business services” sector while the “Accommodation and food services” sector experienced the largest decrease, falling by 61,000. Overall, the total number of quits for the month increased from April’s revised figure of 3.542 million to 3.549 million.       

Total vacancies at the end of May increased by 221,000, or 2.8%, from April’s revised figure of 7.919 million to 8.140 million. The rise was driven by 142,000 more open positions in the “State and local government” sector while the “Accommodation and food services” sector experienced the single largest decrease, falling by 147,000. Overall, 11 out of 18 sectors experienced more job openings than in the previous month.  

“The job opening count was a touch higher than the market expected at 8.14 million, but the job opening rate was little changed from May and within 0.5% of the pre-pandemic level,” Bustamante added.

Total separations increased by 85,000, or 1.6%, from May’s revised figure of 5.337 million to 5.422 million. The rise was led by the “Professional and business services” sector where there were 110,000 more separations while the “Accommodation and food services sector experienced 48,000 fewer separations. Separations increased in 10 of the 18 sectors

The “quit” rate time series produced by the JOLTS report is a leading indicator of US hourly pay. As wages account for around 55% of a product’s or service’s price in the US, wage inflation and overall inflation rates tend to be closely related. Former Federal Reserve chief and current Treasury Secretary Janet Yellen was known to pay close attention to it.

ISM manufacturing PMI stays below 50 in June, points to subdued US demand

01 July 2024

Summary: ISM PMI down in June, below expectations; ANZ: data point to subdued demand; short-term US Treasury yields steady, longer-term yields up; expectations of Fed rate cuts firm; ISM: reading corresponds to 1.7% US GDP growth annualised.

The Institute of Supply Management (ISM) manufacturing Purchasing Managers Index (PMI) reached a cyclical peak in September 2017. It then started a downtrend which ended in March 2020 with a contraction in US manufacturing which lasted until June 2020. Subsequent month’s readings implied growth had resumed, with the index becoming stronger through to March 2021. Readings then declined fairly steadily until mid-2023 and have since generally stagnated.

According to the ISM’s June survey, its PMI recorded a reading of 48.5%, below the generally expected figure of 49.1% as well as May’s reading of 48.7%. The average reading since 1948 is roughly 53.0% and any reading below 50% implies a contraction in the US manufacturing sector relative to the previous month.

“Looking at the components, production and employment fell into contractionary territory,” said ANZ senior economist Catherine Birch. “New orders improved from May but were weak overall. Prices paid fell from 57.0 to 52.1. Imports, exports and inventories fell. Overall, the data point to subdued demand.”

Short-term US Treasury bond yields remained stable on the day while longer=term yields rose noticeably. By the close of business, the 2-year Treasury bond yield had returned to its starting point at 4.76%, the 10-year yield had gained 6bps to 4.46% while the 30-year yield finished 7bps higher at 4.63%.

In terms of US Fed policy, expectations of a lower federal funds rate in the next 12 months firmed slightly, with almost four 25bp cuts currently factored in. At the close of business, contracts implied the effective federal funds rate would average 5.305% in August, 3bps less than the current spot rate, 5.245% in September and 5.085% in November. June 2025 contracts implied 4.375%, 96bps less than the current rate.

Purchasing managers’ indices (PMIs) are economic indicators derived from monthly surveys of executives in private-sector companies. They are diffusion indices, which means a reading of 50% represents no change from the previous period, while a reading under 50% implies respondents reported a deterioration on average. A reading “above 42.5%, over a period of time, generally indicates an expansion of the overall economy”, according to the ISM’s latest calculations.      

The ISM’s manufacturing PMI figures appear to lead US GDP by several months despite a considerable error in any given month. The chart below shows US GDP on a “year on year” basis (and not the BEA annualised basis) against US GDP implied by monthly PMI figures. 

According to the ISM and its analysis of past relationships between the PMI and US GDP, June’s PMI corresponds to an annualised growth rate of 1.7%, or about 0.4% over a quarter. Regression analysis on a year-on-year basis suggests a 12-month GDP growth rate of 2.1% five months after this latest report.

The ISM index is one of two monthly US PMIs, the other being an index published by S&P Global. S&P Global produces a “flash” estimate in the last week of each month which comes out about a week before the ISM index is published. The S&P Global flash June manufacturing PMI registered 51.7%, up 0.4 percentage points from May’s final figure.

Job ads down again in June; still well above pre-pandemic levels

01 July 2024

Summary: Job ads down 2.2% in June; 17.6% lower than June 2023; ANZ: down again but still well above pre-pandemic levels; ACGB yields rise; rate-rise expectations firm slightly; ANZ: similar story in other parts of labour market; ad index-to-workforce ratio declines.

From mid-2017 onwards, year-on-year growth rates in the total number of Australian job advertisements consistently exceeded 10%. That was until mid-2018 when the annual growth rate fell back markedly. 2019 was notable for its reduced employment advertising and this trend continued into the first quarter of 2020. Advertising then plunged in April and May of 2020 as pandemic restrictions took effect but recovered quite quickly, reaching historically-high levels in 2022.

According to the latest reading of the ANZ-Indeed Job Ads Index, total job advertisements in June decreased by 2.2% on a seasonally adjusted basis. The index fell from 120.5 in May to 117.8, with the loss following falls of 1.9% in May and 2.4% in March. On a 12-month basis, total job advertisements were 17.6% lower than in June 2023, up from May’s revised figure of -17.9%.

“Despite this continued moderation, the level of Job Ads is still well above pre-pandemic levels,” said ANZ economist Madeline Dunk.

The update was released on the same day as the Melbourne Institute’s latest Inflation Gauge reading and Commonwealth Government bond yields moved higher across the curve, although they generally lagged the rises of long-term US yields on Friday night. By the close of business, the 3-year ACGB yield had added 5bps to 4.10%, the 10-year yield had gained 7bps to 4.39% while the 20-year yield finished 9bps higher at 4.70%.

Expectations regarding rate rises in the next twelve months firmed slightly by the end of the day. In the cash futures market, contracts implied the cash rate has some chance of rising above the current rate of 4.32% in the short-term, with an average of 4.325% through July, 4.395% in August and 4.47% in November. February 2025 contracts implied 4.44% while May 2025 contracts implied 4.345%, just above the current cash rate.

“We’re seeing a similar story in other parts of the labour market, with indicators easing from strong starting positions,” Dunk added. “So far, a lot of the adjustment in the labour market has been through hours worked. But with average hours worked per person back in line with the long-run trend, we think the pace of employment growth will slow from here.”

The inverse relationship between job advertisements and the unemployment rate or the underemployment rate has been quite strong (see below chart), although ANZ themselves called the relationship between the series into question in early 2019. 

A higher job advertisement index as a proportion of the labour force is suggestive of lower unemployment rates in the near future while a lower ratio suggests higher unemployment rates will follow. June’s ad index-to-workforce ratio declined from 0.81 to 0.79.

In 2008/2009, advertisements plummeted and Australia’s unemployment rate jumped from 4% to nearly 6% over a period of 15 months. When a more dramatic fall in advertisements took place in April 2020, the unemployment rate responded much more quickly.

Inflation Gauge annual rate ticks up to 3.2% in June

01 July 2024

Summary: Melbourne Institute Inflation Gauge index up 0.2% in June; up 3.2% on annual basis; ACGB yields rise; rate-rise expectations firm slightly; implies 0.5% for June quarter CPI.

The Melbourne Institute’s Inflation Gauge is an attempt to replicate the ABS consumer price index (CPI) on a monthly basis. It has turned out to be a reliable leading indicator of the CPI, although there are periods in which the Inflation Gauge and the CPI have diverged for as long as twelve months. On average, the Inflation Gauge’s annual rate tends to overestimate the ABS rate by around 0.1%, or at least until recently.

The Melbourne Institute’s latest reading of its Inflation Gauge index indicates consumer prices increased by 0.2% in June, down from the 0.3% increase posted in May but up from the 0.1% rise in April. Inflation on an annual basis was measured at 3.2%, slightly faster than May’s comparable figure of 3.1%.

The update was released on the same day as ANZ’s latest Job Ads report and Commonwealth Government bond yields moved higher across the curve, lagging the rises of long-term US yields on Friday night. By the close of business, the 3-year ACGB yield had added 5bps to 4.10%, the 10-year yield had gained 7bps to 4.39% while the 20-year yield finished 9bps higher at 4.70%.

Expectations regarding rate rises in the next twelve months firmed slightly by the end of the day. In the cash futures market, contracts implied the cash rate has some chance of rising above the current rate of 4.32% in the short-term, with an average of 4.325% through July, 4.395% in August and 4.47% in November. February 2025 contracts implied 4.44% while May 2025 contracts implied 4.345%, just above the current cash rate.

Given the Inflation Gauge’s tendency to overestimate, the latest figures imply an official CPI reading of 0.5% (seasonally adjusted) for the June quarter or 3.1% in annual terms. However, it is worth noting the annual CPI rate to the end of March 2023 was 7.0% while the Inflation Gauge had implied a 5.7% annual rate at the time.

Core PCE inflation lowest since 2021; up 0.1% in May

28 June 2024

Summary: US core PCE price index up 0.1% in May, in line with expectations; annual rate slows to 2.6%; ANZ: lowest since March 2021; Treasury yields rise; Fed rate-cut expectations soften; ANZ: disinflation process remains in place.

One of the US Fed’s favoured measures of inflation is the change in the core personal consumption expenditures (PCE) price index. After hitting the Fed’s target at the time of 2.0% in mid-2018, the annual rate then hovered in a range between 1.8% and 2.0% before it eased back to a range between 1.5% and 1.8% through 2019. It then plummeted below 1.0% in April 2020 before rising back to around 1.5% in the September quarter of that year. It has since increased significantly and still remains above the Fed’s target even after recent declines.

The latest figures have now been published by the Bureau of Economic Analysis as part of the May personal income and expenditures report. Core PCE prices rose by just 0.1% over the month, in line with expectations  but down from April’s 0.3% increase. On a 12-month basis, the core PCE inflation rate slowed from 2.8% to 2.6%.

“The annual rise in core inflation was the lowest since March 2021 and was supported by a modest 0.1% rise in super-core inflation (services inflation excluding food, energy and housing),” said ANZ Head of Australian Economics Adam Boyton.  

US Treasury bond yields rose by increasing amounts along the curve on the day. By the close of business, the 2-year Treasury bond yield had added 5bps to 4.76%, the 10-year had gained 11bps to 4.40% while the 30-year yield finished 13bps higher at 4.56%.

In terms of US Fed policy, expectations of a lower federal funds rate in the next 12 months softened slightly, although at almost four 25bp cuts are still currently factored in. At the close of business, contracts implied the effective federal funds rate would average 5.305% in August, 3bps less than the current spot rate, 5.245% in September and 5.085% in November. June 2025 contracts implied 4.375%, 96bps less than the current rate.

“The 2.6% rise in core inflation was below the FOMC’s year-end forecast of 2.8% whilst the 2.6% rise in headline inflation was in line with the FOMC’s forecast for Q4,” Boyton added. “The data support our view that the disinflation process remains in place.”

The core version of PCE strips out energy and food components, which are volatile from month to month, in an attempt to identify the prevailing trend. It is not the only measure of inflation used by the Fed; the Fed also tracks the Consumer Price Index (CPI) and the Producer Price Index (PPI) from the Department of Labor. However, it is the one measure which is most often referred to in FOMC minutes.

Credit growth steadies, up 5.2% in year to May

28 June 2024

Summary: Private sector credit up 0.4% in May, in line with expectations; annual growth rate steady at 5.2%; ANZ: credit growth relatively steady over last year, slows from post-COVID above-average growth rates; ACGB yields fall; rate-rise expectations soften; owner-occupier segment accounts for ~50% of net growth.

The pace of lending growth in the non-bank private sector by financial institutions in Australia followed a steady-but-gradual downtrend from late 2015 through to early 2020 before hitting what appears to be a nadir in March 2021. That downtrend ended later in that same year and annual growth rates shot up through 2022, peaking in September/October before easing through 2023.

According to the latest RBA figures, private sector credit increased by 0.4% in May. The result was in line with expectations but down slightly from May’s 0.5% rise. On an annual basis, the growth rate remained unchanged at 5.2%.

“Both housing and business credit growth slowed in May,” said ANZ senior economist Blair Chapman. “Overall credit growth has been relatively steady over the last year, after slowing from above average growth rates post-COVID.”

Commonwealth Government bond yields reversed Thursday’s rises, moving noticeably lower on the day and outpacing the falls of US yields on Thursday night. By the close of business, the 3-year ACGB yield had lost 9bps to 4.05%, the 10-year yield had shed 10bps to 4.32% while the 20-year yield finished 9bps lower at 4.61%.

Expectations regarding rate rises in the next twelve months softened by the end of the day. In the cash futures market, contracts implied the cash rate would average 4.32% through July, 4.40% in August and 4.47% in November. February 2025 contracts implied 4.425% while May 2025 contracts implied 4.315%, just below the current cash rate.

Owner-occupiers accounted for just under 50% of the net growth over the month while business lending accounted slightly under 30%. Investor lending accounted for the balance.   

The traditional driver of overall loan growth, the owner-occupier segment, grew by 0.4% over the month, slightly slower than April’s 0.5%. The sector’s 12-month growth rate ticked up from 5.1% to 5.2%.

Total lending in the non-financial business sector increased by 0.4%, down from April’s growth rate of 0.6%. Growth on an annual basis slowed from 6.8% to 6.6%.

Monthly growth in the investor-lending segment slowed to a near-halt in early 2018 and essentially stayed that way until mid-2021. In May, net lending rose by 0.4%, in line with April’s upwardly-revised rate. The 12-month growth rate increased from 3.2% to 3.5%.

Total personal loans decreased by 0.1%, in contrast with April’s 0.2% increase, while the annual growth rate decreased from 3.2% to 2.7%. This category of debt includes fixed-term loans for large personal expenditures, credit cards and other revolving credit facilities.

More sub-trend growth; May Westpac-MI leading index declines

26 June 2024

Summary: Leading index growth rate down in May; Index points to below-trend growth tracking in second half of 2024, early 2025; reading implies annual GDP growth of around 2.25%-2.50%; ACGB yields jump; rate-rise expectations firm; higher interest rates, reversal of 2023s commodity price gains, difficult conditions in homebuilding sector the main negatives.

Westpac and the Melbourne Institute describe their Leading Index as a composite measure which attempts to estimate the likely pace of Australian economic growth in the short-term. After reaching a peak in early 2018, the index trended lower through 2018 and 2019 before plunging to recessionary levels in the second quarter of 2020. Subsequent readings spiked towards the end of 2020 but then trended lower through 2021 and 2022 before flattening out in 2023.

May’s reading has now been released and the six month annualised growth rate of the indicator registered -0.24%, down from April’s revised figure of -0.05%. The index reading represents a rate relative to “trend” GDP growth, which is generally thought to be around 2.50% to 2.75% per annum in Australia.

“Overall, the Index points to growth tracking slightly below-trend over the second half of 2024 and into early 2025,” said Westpac senior economist Matthew Hassan.

Westpac states the index leads GDP growth by “three to nine months into the future” but the highest correlation between the index and actual GDP figures occurs with a three-month lead. The current reading may therefore be considered to be indicative of an annual GDP growth rate of around 2.25% to 2.50% in the next quarter.

Domestic Treasury bond yields jumped on the day, especially at the short end of the curve, following the release of May CPI figures. By the close of business, the 3-year ACGB yield had gained 18bps to 4.07%, the 10-year yield had added 11bps to 4.32% while the 20-year yield finished 9bps higher at 4.62%.

Expectations regarding rate rises in the next twelve months firmed by the end of the day. In the cash futures market, contracts implied the cash rate would average 4.32% through July, 4.405% in August and 4.47% in November. February 2025 contracts implied 4.44% while May 2025 contracts implied 4.315%, 1bp less than the current cash rate.

“Recent Index reads had suggested momentum was stabilising,” Hassan added. “The lapse back into negative this month gives a much patchier signal. Higher interest rates, an unwind of last year’s commodity price gains and ongoing difficult conditions in Australia’s domestic homebuilding sector have been the main negatives.”

Westpac is currently forecasting GDP growth to be 1.6% in calendar 2024, rising to 2.3% in calendar 2025. The RBA’s May Statement on Monetary Policy also forecasts GDP growth for the years ending December 2024 and December 2025 to be 1.6% and 2.3% respectively.

Click for more news