28 August 2019
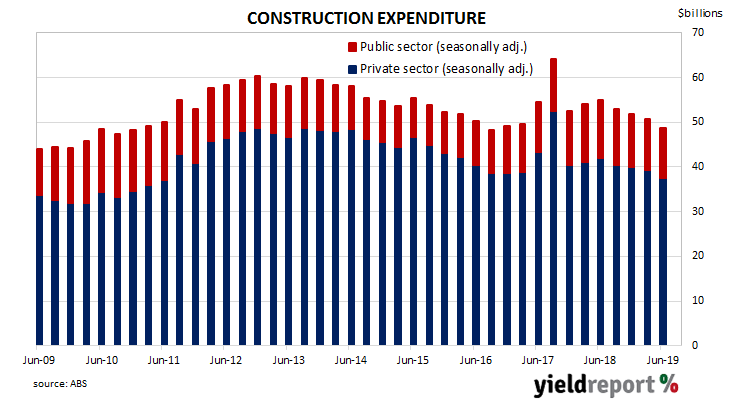
Construction expenditure increased rapidly in Australia in the early part of this decade. A large portion of the increase came from the commissioning of new liquid natural gas projects and the expansion of existing mining projects to exploit a tripling in price of Australia’s mining exports in the previous decade. The return to “normal” investment levels is still continuing.
According to the latest construction figures published by the ABS, the value of construction work has fallen for a fourth consecutive quarter. Total construction in the June quarter fell by 3.8%, which is less than the 1.0% contraction expected and slightly less than the revised 2.2% fall in the March quarter. On an annual basis, the growth rate deteriorated from March’s revised figure of -6.1% to -11.1%.
Westpac senior economist Andrew Hanlon described the figures as “a material negative for Q2 [June quarter] GDP.”
27 August 2019
US consumer confidence collapsed in late 2007 as the US housing bubble burst and the US economy went into recession. By 2016, it had clawed its way back to neutral and then went from strength to strength until late 2018. Since then, measures of consumer confidence have oscillated within a fairly narrow band at historically high levels. Recent figures have continued in this manner despite headlines of international discord and weaker business surveys.
The latest Conference Board survey indicates US consumers remained very optimistic even as trade and geo-political tensions come and go. August’s reading came in at 135.1, a small fall from July’s final figure of 135.8 and still quite close to its all-time high. Consumers’ views of present conditions with regards to the business environment and the labour market improved but the short-term outlook of both was slightly less than at the time of the July survey.
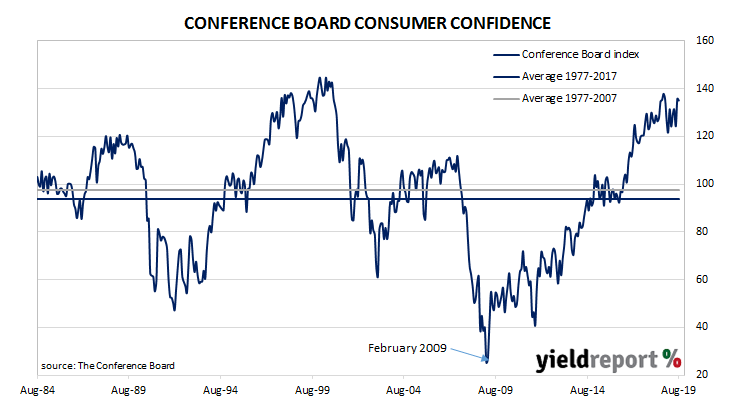
Westpac described the result as “a resilient reading in the face of escalating trade tensions and volatile markets.”
22 August 2019
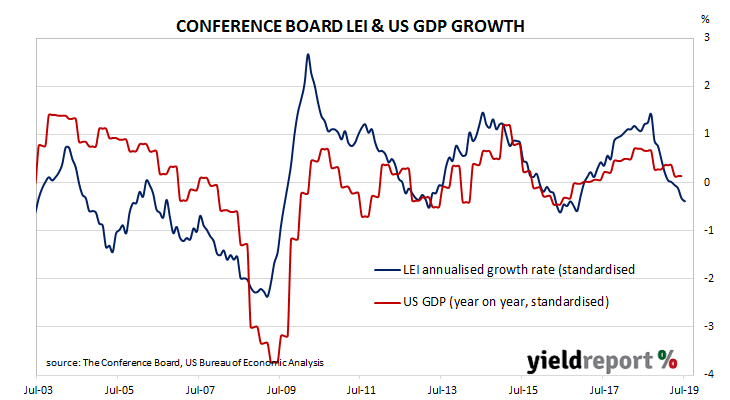
The Conference Board Leading Economic Index (LEI) is a composite index which is composed of ten indices which are thought to be sensitive to changes in the US economy. The Conference Board describes it as an index which attempts to signal peaks and troughs. Turning points in its index have historically occurred prior to changes in aggregate economic activity. Recently, month on month changes in the LEI have produced negative results. However, the latest report has swung in a positive direction.
The Leading Economic Index increased by 0.5% in July, a large increase from June’s comparable figure of -0.1% and more than the expected +0.2%. Even so, the LEI slowed down to 1.8% from June’s rate of 2.0% on an annual basis,
Month-to-month figures produced are volatile but once they are standardised, a clearer relationship with GDP emerges.
22 August 2019
EU consumer confidence plunged during the GFC and again in 2011/12 during the European debt crisis. Since early 2014, it has been at average or above-average levels, rising to a cyclical peak at the beginning of 2018. However, it dropped back significantly in late 2018, albeit to still-elevated levels, at about the same time as doubts emerged over the US economy’s robustness. Since then, it has slowly been recovering in fits and starts. The latest survey of euro-zone households indicates this process has continued in August, at least in trend terms.
The August survey conducted by the European Commission indicates EU household confidence has slipped back, although it remained comfortably above average. The latest published measure of Consumer Confidence index produced a figure of -7.1, indicating households were less confident than in July when the index recorded -6.6.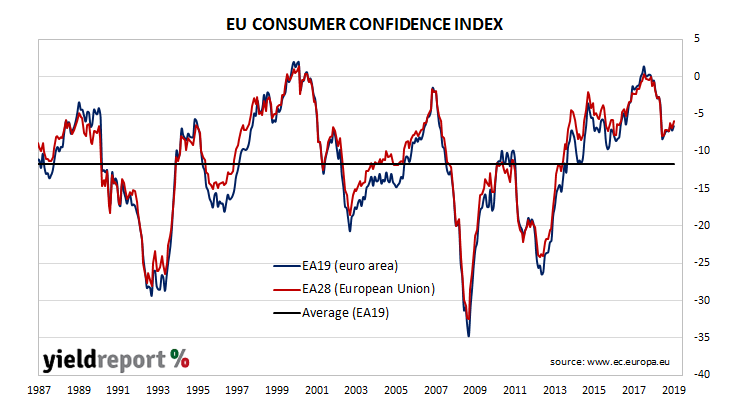
21 August 2019
Westpac and the Melbourne Institute describe their Leading Index as a composite measure which attempts to estimate the likely pace of Australian economic activity relative to trend over the next three to six months. Since its peak in early 2018, the index had progressively headed lower through 2018 and into 2019. However, its recent low was not as negative as the one reached in February and the latest reading from the index is back into positive territory.
The six-month annualised growth rate of the indicator increased again, this time from June’s revised figure of -0.09% to +0.52% in July. These figures represent rates relative to trend-GDP growth, which is generally thought to be around 2.75% per annum. The index is said to lead GDP by 3 to 6 months, so theoretically the current reading represents an annualised GDP growth rate of around 2.75% in late 2019 or early 2020.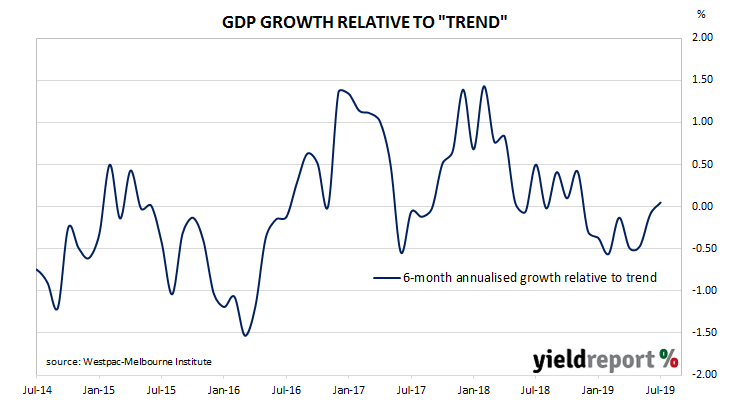
Westpac chief economist Bill Evans described the result as the “first above-trend read since November” and he said further readings of this sort “would be consistent with the economy growing around trend for the last three or four months of 2019 and well into the first half of 2020.” However, he said recent developments in equity and commodity markets and an inverted yield curve “point to a likely softer August reading for the Index. “
20 August 2019
The RBA left the official cash rate target unchanged at its August board meeting, keeping it at 1.00%.
Around February of this year, the RBA began to publicly move away from having a tightening bias. The reference to a higher rate as “more likely” than a lower rate was removed and the phrase “the probabilities around these scenarios were now more evenly balanced than they had been over the preceding year” was introduced.
Two months later, the RBA’s attitude was not inclined to make a change in either direction as “there was not a strong case for a near-term adjustment in monetary policy.”
In May, the transformation to an easing bias had taken place. If “there was no further improvement in the labour market in the period ahead….a decrease in the cash rate would likely be appropriate.” A 25bps rate cut was announced in June and another one followed in July. No change was made at the RBA’s August board meeting.
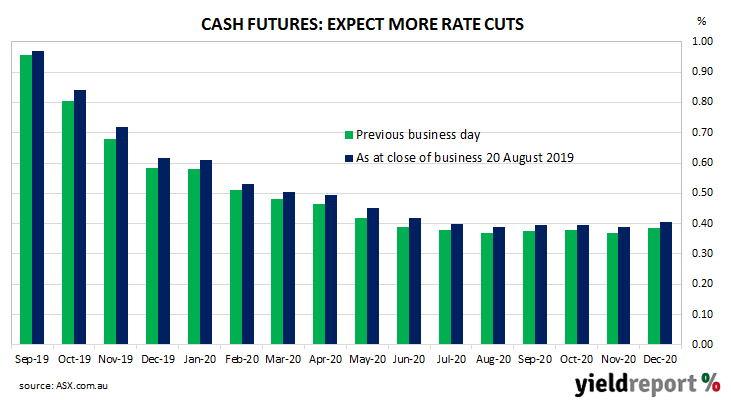 The minutes of that meeting have now been released and apparently the board’s deliberations focussed on “developments in the global and domestic economies…” Despite noting “global growth had remained reasonable” the board expected “downside risks to the global growth outlook” as a result of an escalation in the trade war between the US and China. As such, another cut in the cash rate would be considered “if the accumulation of additional evidence suggests this was needed…”
16 August 2019
US consumer confidence had started 2019 at well above average levels in a longer-term context, although it was markedly lower than the more buoyant readings which typified most of 2018. After rebounding from the falls of January and February, US households had maintained a historically high level of confidence. However, the latest report indicates they have been spooked by recent actions from the US central bank and the Trump Administration’s trade policies.
The latest survey conducted by the University of Michigan indicates the average confidence level of US households has fallen back considerably, albeit from an elevated level. The University’s preliminary estimate of its Index of Consumer Sentiment fell from July’s figure of 98.4 to 92.1 in August, well below the consensus figure of 97.1.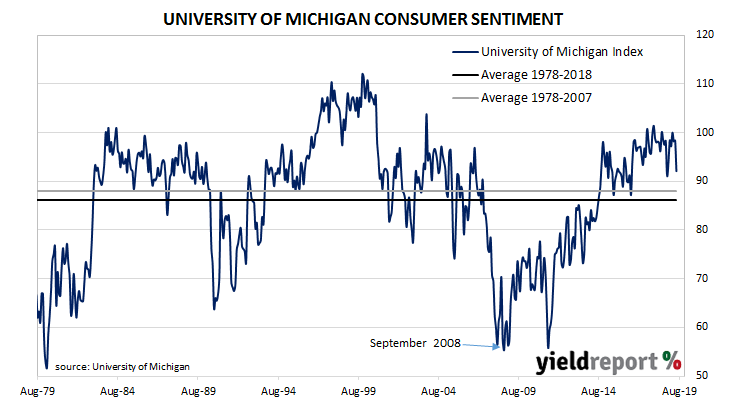
The University’s Surveys of Consumers chief economist, Richard Curtin, said the first cut in the federal funds rate since October 2008 had sent a signal to households. “The main takeaway for consumers from the first cut in interest rates in a decade was to increase apprehensions about a possible recession. Consumers concluded, following the Fed’s lead, that they may need to reduce spending in anticipation of a potential recession. Falling interest rates have long been associated with the start of recessions…”
However, he also noted the role of a strong employment market. “Perhaps the most important remaining pillar of strength for consumer spending is favourable job and income prospects, although the August survey indicated some concerns about the future pace of income and job gains. It is likely that consumers will reduce their pace of spending while keeping the economy out of recession at least through mid-2020.”
15 August 2019
US retail sales had been trending up since late 2015 but, beginning in late 2018, a series of weak or negative monthly results led to a drop-off in the annual growth rate which brought the annual rate below 2.0% by the end of the year. After an unsteady start to 2019, subsequent months’ figures have produced a recovery which has prevailed into the third quarter of the year.
According to the latest “advance” sales numbers released by the US Census Bureau, total retail sales increased by 0.7% in July, well in excess of the +0.2% which had been expected and well above June’s revised growth rate of +0.3%. On an annual basis, the growth rate increased to 3.4% from June’s revised rate of 3.3%.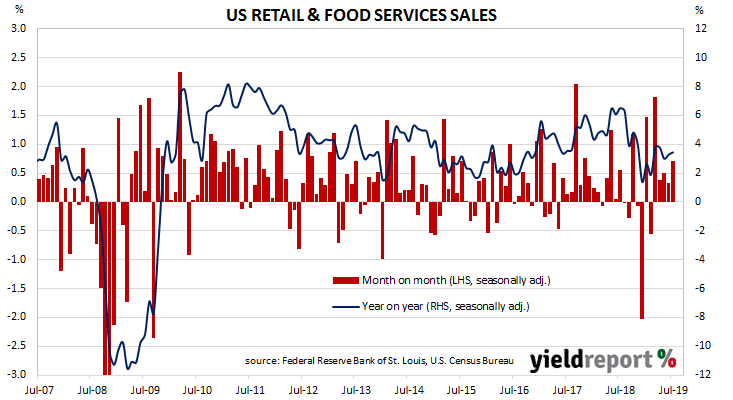
Treasury bond yields finished the day noticeably lower despite the better-than-expected results from the retail report, as traders and investors focussed on Chinese plans for retaliation on the trade front, along with a weak industrial production report and hints of some move at the ECB’s September meeting. By the close of business, 2-year US Treasury yields had dropped by 9bps to 1.49%, the 10-year yield had shed 6bps to 1.52% while 30-year yields finished 5bsp lower at 1.97%.
15 August 2019
The Federal Reserve’s industrial production index measures real output from manufacturing, mining, electricity and gas company facilities located in the United States. These sectors are thought to be sensitive to consumer demand and so some leading indicators of GDP use industrial production figures as a component. The latest report has added to a relatively recent run of months in which US production has gone backwards.
According to the latest figures released by the Fed, US industrial production contracted by 0.2% in July, well under the 0.3% increase which had been expected and a further slowdown from June’s 0.2% increase after revisions. On an annual basis, growth in industrial production slowed to 0.5% from June’s revised rate of 1.1%.
ANZ economist Jack Chambers said, “All up, it seems the drag on US growth from manufacturing has continued into the start of Q3 [the September quarter].”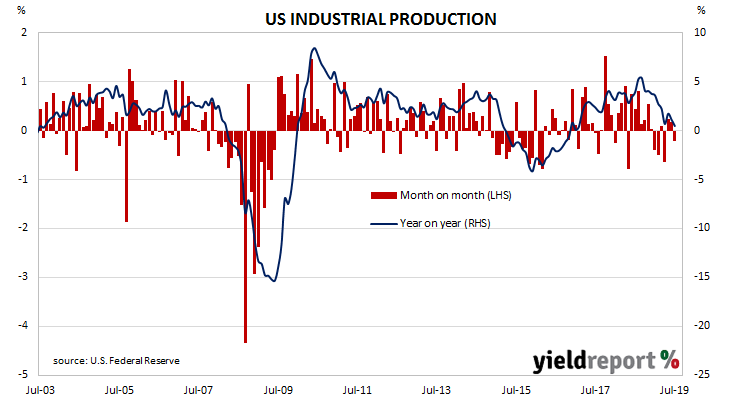
14 August 2019
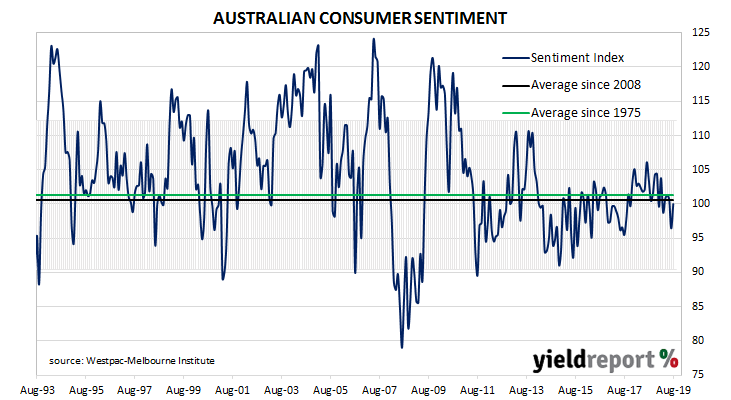
After a lengthy divergence between consumer sentiment and business confidence in Australia which began in 2014, the two sectors converged again around July 2018. Both measures have been around or under neutral levels in recent months but business sentiment has been falling from a high base, whereas consumer sentiment has been stagnating at or close to neutral levels for some years. This latest measurement of consumer sentiment indicates households have recovered from July’s drop and remain stoic in the face of global uncertainties.
According to the latest Westpac-Melbourne Institute survey conducted over a week in early August, average household optimism has rebounded back to broadly neutral levels after it had fallen in July. The Consumer Sentiment Index reversed most of July’s fall as it increased from 96.5 to 100.0, although it is still short of June’s reading of 100.7. Any reading above 100 indicates the number of consumers who are optimistic is greater than the number of consumers who are pessimistic. The long-term average reading is just over 101.