News

US disinflation process resuming; CPI flat in May

12 June 2024

Summary: US CPI flat in May, less than expected; annual inflation rate slows from 3.4% to 3.3%; “core” rate up 0.2%, up 3.4% over year; ANZ: disinflation process resuming; Treasury yields fall noticeably; rate-cut expectations firm; energy prices main driver.

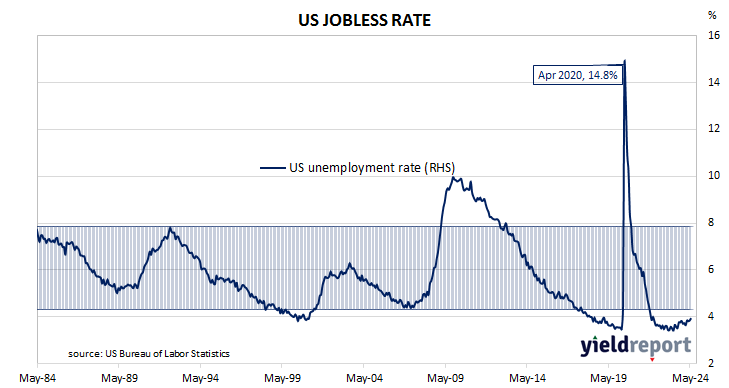
The annual rate of US inflation as measured by changes in the consumer price index (CPI) halved from nearly 3% in the period from July 2018 to February 2019. It then fluctuated in a range from 1.5% to 2.0% through 2019 before rising above 2.0% in the final months of that year. Substantially lower rates were reported from March 2020 to May 2020 and they remained below 2% until March 2021. They then rose significantly before declining from mid-2022 to mid-2023.

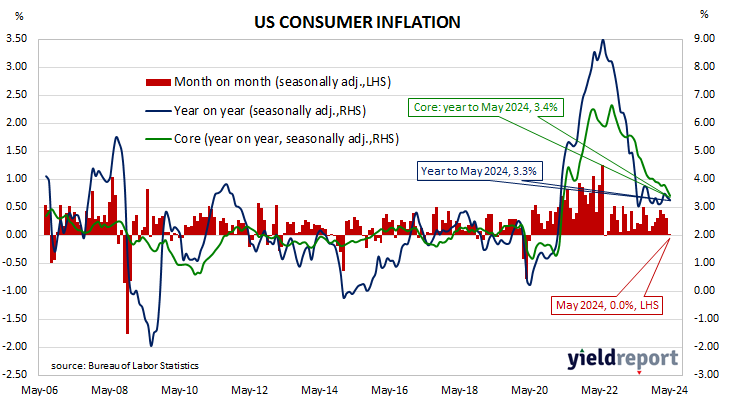
The latest US CPI figures released by the Bureau of Labor Statistics indicated seasonally-adjusted consumer prices were flat on average in May. The result was less than the 0.1% which had been generally expected as well as April’s 0.3% rise after revisions. On a 12-month basis, the inflation rate slowed from 3.4% to 3.3%.

“Headline” inflation is known to be volatile and so references are often made to “core” inflation for analytical purposes. The core prices index, the index which excludes the more variable food and energy components, increased by 0.2% on a seasonally-adjusted basis over the month, less than the 0.3% which had been expected. The annual growth rate slowed from April’s rate of 3.6% to 3.4%.

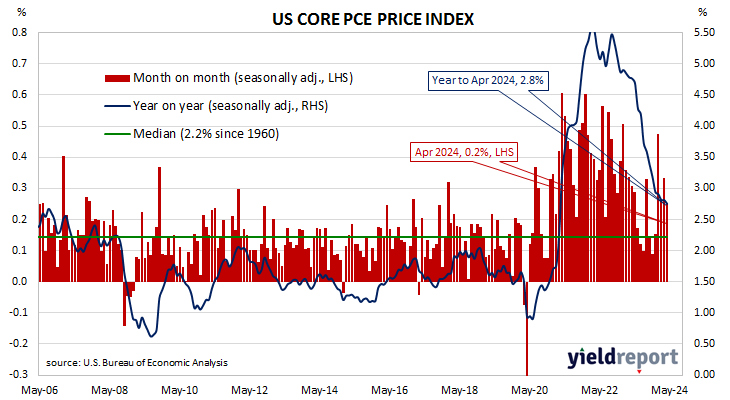
“Core CPI inflation rose 3.4% year-on-year, down from 3.9% in January and 5.3% in May 2023, confirming the disinflation process is resuming, having stalled in Q1,” said ANZ senior economist Catherine Birch. “Given that super-core inflation has a much larger weighting in the PCE deflator, the data bode well for a low May core PCE deflator print.”

The figures came out on the same day as the FOMC’s decision to leave rates unchanged and US Treasury bond yields fell noticeably. By the close of business, the 2-year Treasury yield had shed 9bps to 4.75%, the 10-year yield had lost 8bps to 4.32% while the 30-year yield finished 6bps lower at 4.48%.

In terms of US Fed policy, expectations of a lower federal funds rate in the next 12 months firmed, with at least three 25bp cuts currently factored in. At the close of business, contracts implied the effective federal funds rate would average 5.31% in August, 2bps less than the current spot rate, 5.25% in September and 5.09% in November. June 2025 contracts implied 4.405%, 93bps less than the current rate.

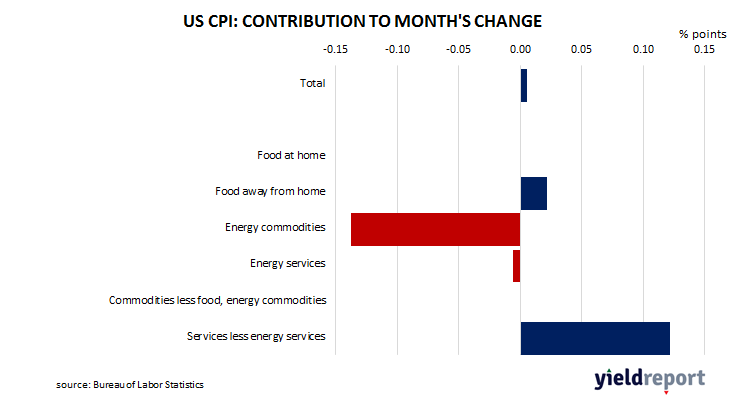
The largest influence on headline results is often the change in fuel prices. Prices of “Energy commodities”, the segment which contains vehicle fuels, decreased by 3.5% and contributed -0.14 percentage points to the total. Prices of non-energy services, the segment which includes actual and implied rents, again had a relatively large effect on the total, adding 0.12 percentage points after increasing by 0.2% on average.

Subdued economic activity continues; NAB business indices fall in May

11 June 2024

Summary: Business conditions deteriorate slightly in May; business confidence also deteriorates, now well below average; NAB: suggests subdued economic activity continues; ACGB yields generally modestly higher; rate-cut expectations soften; NAB: inflation will continue to moderate only gradually; capacity utilisation rate ticks up, at elevated level.

NAB’s business survey indicated Australian business conditions were robust in the first half of 2018, with a cyclical-peak reached in April of that year. Readings from NAB’s index then began to slip and forecasts of a slowdown in the domestic economy began to emerge in the first half of 2019 as the index trended lower. It hit a nadir in April 2020 as pandemic restrictions were introduced but then improved markedly over the next twelve months and has subsequently remained at robust levels.

According to NAB’s latest monthly business survey of around 400 firms conducted in the last week and a half of May, business conditions deteriorated slightly and are now at a level which is in line with the long-term average. NAB’s conditions index registered 6 points, down 1 point from April’s reading.

Business confidence also deteriorated.  NAB’s confidence index fell 5 points to -3 points, a reading which is well below the long-term average.  Typically, NAB’s confidence index leads the conditions index by one month, although some divergences have appeared from time to time.

“Business confidence fell back into negative territory in May as conditions continued to gradually soften, suggesting the subdued economic activity seen in the Q1 GDP data has continued into Q2,” said NAB Chief Economist Alan Oster.

Australian Commonwealth Government bond yields generally moved modestly higher, although the 20-year yield jumped as it played catch-up from Friday. By the close of business, the 3-year ACGB yield had added 1bp to 3.98%, the 10-year yield had gained 3bps to 4.34% while the 20-year yield finished 10bps higher at 4.64%.

Expectations regarding rate cuts in the next twelve months softened by the end of the day. In the cash futures market, contracts implied the cash rate would remain close to the current rate for the next few months and average 4.315% through June, 4.31% in July and 4.325% in August. However, November contracts implied 4.31%, February 2025 contracts implied 4.265% while May 2025 contracts implied 4.16%, 16bps less than the current cash rate.

“Nonetheless, capacity utilisation remains above average and cost and price growth measures rose in the month, including retail price growth, which rebounded back up to 1.6% in quarterly terms,” Oster added. “This suggests that, while growth has slowed, the process of bringing supply and demand back into balance remains incomplete, reinforcing our expectation that inflation will continue to moderate only gradually from here.”

NAB’s measure of national capacity utilisation ticked up from 83.2% to 83.3%, a level which is quite elevated from a historical perspective. Seven of the eight sectors of the economy were reported to be operating at or above their respective long-run averages.

Capacity utilisation is generally accepted as an indicator of future investment expenditure and it also has a strong inverse relationship with Australia’s unemployment rate.

US May job numbers surprise to upside; bond yields surge

07 June 2024

Summary: US non-farm payrolls up 272,000 in May, above expectations; previous two months’ figures revised down by 15,000; jobless rate ticks up to 4.0%, participation rate declines to 62.5%; US Treasury yields rise sharply; expectations of Fed rate cuts soften; employed-to-population ratio slips back to 60.1%; underutilisation rate steady at 7.4%; annual hourly pay growth rises to 4.1%.

The US economy ceased producing jobs in net terms as infection controls began to be implemented in March 2020. The unemployment rate had been around 3.5% but that changed as job losses began to surge through March and April of 2020. The May 2020 non-farm employment report represented a turning point and subsequent months provided substantial employment gains which continued through into 2021, 2022 and 2023.

According to the US Bureau of Labor Statistics, the US economy created an additional 272,000 jobs in the non-farm sector in May. The increase was noticeably more than the 180,000 rise which had been generally expected and the 165,000 jobs which had been added in April. Employment figures for April and March were revised down by a total of 15,000.

The total number of unemployed increased by 157,000 to 6.649 million while the total number of people who were either employed or looking for work decreased by 251,000 to 167.732 million. These changes led to the US unemployment rate ticking up from April’s figure of 3.9% to 4.0%. The participation rate declined from 62.7 to 62.5%.

US Treasury bond yields rose sharply on the day, especially at the short end of the curve. By the close of business, the 2-year yield had jumped 16bps to 4.89%, the 10-year yield had gained 14bps to 4.43% while the 30-year yield finished 12bps higher at 4.56%.

In terms of US Fed policy, expectations of a lower federal funds rate in the next 12 months softened, although almost three 25bp cuts are still currently factored in. At the close of business, contracts implied the effective federal funds rate would average 5.33% in June, in line with the current spot rate, 5.265% in July and 5.23% in September. May 2025 contracts implied 4.245%, 70bps less than the current rate.

One figure which is indicative of the “spare capacity” of the US employment market is the employment-to-population ratio. This ratio is simply the number of people in work divided by the total US population. It hit a cyclical-low of 58.2 in October 2010 before slowly recovering to just above 61% in early 2020. May’s reading slipped back from 60.2% to 60.1%, some way from the April 2000 peak reading of 64.7%.

Apart from the unemployment rate, another measure of tightness in the labour market is the underutilisation rate and the latest reading of it registered 7.4%, unchanged from April. Wage inflation and the underutilisation rate usually have an inverse relationship; private hourly pay growth in the year to May ticked up from 4.0% to 4.1%%.

Higher home prices, larger loans; April home loan approvals up 4.8%

06 June 2024

Summary: Value of loan commitments up 4.8% in April, more than expected; 24.6% higher than April 2023; Westpac: rising dwelling prices a tailwind for housing finance activity; ACGB yields down; rate-cut expectations firm; Westpac: tax cuts may provide boost as borrowing capacity expands but stretched affordability remains a drag; value of owner-occupier loan approvals up 4.3%; value of investor approvals up 5.6%; number of owner-occupier home loan approvals up 3.0%.

The number and value of home-loan approvals began to noticeably increase after the RBA reduced its cash rate target in a series of cuts beginning in mid-2019, potentially ending the downtrend which had been in place since mid-2017. Figures from February through to May of 2020 provided an indication the downtrend was still intact but subsequent figures then pushed both back to record highs in 2021. After a considerable pullback in 2022 both the value and number of approved loans resumed rising in 2023.

April’s housing finance figures have now been released and total loan approvals excluding refinancing increased by 4.8% In dollar terms over the month, more than the 1.5% rise which had been generally expected and up from March’s 3.8% increase after revisions. On a year-on-year basis, total approvals excluding refinancing were 24.6% higher than April 2023, up from the previous month’s comparable figure of 18.9%.

“A broad upswing in dwelling prices nationally remains a structural tailwind for housing finance activity,” said Westpac senior economist Jameson Coombs.

Commonwealth Government bond yields fell modestly on the day, although not quite as much as the falls of US Treasury yields on Wednesday night (AEST). By the close of business, 3-year and 10-year ACGB yields had both lost 2bps to 3.91% and 4.24% respectively while the 20-year yield finished 1bp lower at 4.55%.

Expectations regarding rate cuts in the next twelve months firmed by the end of the day. In the cash futures market, contracts implied the cash rate would remain close to the current rate for the next few months and average 4.315% through June, 4.31% in July and 4.32% in August. However, November contracts implied 4.285%, February 2025 contracts implied 4.215% while May 2025 contracts implied 4.105%, 22bps less than the current cash rate.

“Stage 3 tax cuts may provide a boost to activity as borrowing capacity expands,” Coombs added. “However, stretched affordability will remain a drag and is likely to limit the potential upside, noting the high inflation will also be impacting benchmarks used to assess loan serviceability.”

The total value of owner-occupier loan commitments excluding refinancing increased by 4.3%, up from March’s 3.5%. On an annual basis, owner-occupier loan commitments were 18.7% higher than in April 2023, up from March’s comparable figure of 12.5%.

The total value of investor commitments excluding refinancing increased by 5.6%. The rise follows a 4.4% increase in March, taking the growth rate over the previous 12 months from 31.8% to 36.1%.

The total number of loan commitments to owner-occupiers excluding refinancing increased by 3.0% to 27383 on a seasonally adjusted basis, down a touch from the March’s 3.0% increase. The annual growth rate accelerated from 7.3% after revisions to 9.3%.

US quit rate steadies in April; back to pre-pandemic levels

04 June 2024

Summary: US quit rate steady at 2.2% in April; Westpac: more evidence of labour demand, supply coming into balance; US Treasury yields fall; expectations of Fed rate cuts firm; ANZ: job openings to available workers ratio falls, at lowest level since July 2021; more quits, separations, fewer openings.

The number of US employees who quit their jobs as a percentage of total employment increased slowly but steadily after the GFC. It peaked in March 2019 and then tracked sideways until virus containment measures were introduced in March 2020. The quit rate then plummeted as alternative employment opportunities rapidly dried up. Following the easing of US pandemic restrictions, it proceeded to recover back to its pre-pandemic rate in the third quarter of 2020 and trended higher through 2021 before easing through 2022 and 2023.

Figures released as part of the latest Job Openings and Labor Turnover Survey (JOLTS) report show the quit rate remained steady in April after revisions. 2.2% of the non-farm workforce left their jobs voluntarily, unchanged from March. Quits in the month increased by 98,000 while an additional 175,000 people were employed in non-farm sectors.

“The hiring, separation and quit rates have already converged to pre-pandemic levels,” said Westpac economist Jameson Coombs. “This report is yet more evidence of labour demand and supply coming into balance.”

US Treasury yields fell across the curve on the day. By the close of business, the 2-year Treasury bond yield had lost 4bps to 4.77% while 10-year and 30-year yields both finished 6bps lower at 4.33% and 4.48% respectively.

In terms of US Fed policy, expectations of a lower federal funds rate in the next 12 months firmed, with three 25bp cuts now factored in. At the close of business, contracts implied the effective federal funds rate would average 5.33% in June, in line with the current spot rate, 5.325% in July and 5.23% in September. May 2025 contracts implied 4.525%, 79bps less than the current rate.

“Job openings are now at their lowest since early 2021,” noted ANZ economist Kishti Sen. “The ratio of job openings to available workers fell to 1.24 from 1.32 and is at its lowest level since July 2021, when the data were affected by the pandemic.”

The rise in total quits was led by 67,000 more resignations in the “Other services” sector while the “Professional and business services” sector experienced the largest decrease, falling by 131,000. Overall, the total number of quits for the month increased from March’s revised figure of 3.409 million to 3.507 million.           

Total vacancies at the end of April dropped by 296,000, or 3.5%, from March’s revised figure of 8.355 million to 8.059 million. The fall was driven by 204,000 fewer open positions in the “Health care and social assistance” sector while the “Professional and business services” sector experienced the single largest increase, rising by 122,000. Overall, 13 out of 18 sectors experienced fewer job openings than in the previous month.  

Total separations increased by 42,000, or 0.8%, from March’s revised figure of 5.330 million to 5.372 million. The rise was led by the “Health care and social assistance” sector where there were 66,000 more separations while the “Professional and business services” sector experienced 140,000 fewer separations. Separations increased in 10 of the 18 sectors.

The “quit” rate time series produced by the JOLTS report is a leading indicator of US hourly pay. As wages account for around 55% of a product’s or service’s price in the US, wage inflation and overall inflation rates tend to be closely related. Former Federal Reserve chief and current Treasury Secretary Janet Yellen was known to pay close attention to it.

US economic resilience gradually fading; ISM manufacturing PMI falls further below 50

03 June 2024

Summary: ISM PMI down in May, below expectations; Westpac: another sign US economic resilience gradually fading; US Treasury yields fall; expectations of Fed rate cuts firm; ISM: reading corresponds to 1.7% US GDP growth annualised.

The Institute of Supply Management (ISM) manufacturing Purchasing Managers Index (PMI) reached a cyclical peak in September 2017. It then started a downtrend which ended in March 2020 with a contraction in US manufacturing which lasted until June 2020. Subsequent month’s readings implied growth had resumed, with the index becoming stronger through to March 2021. Readings then declined fairly steadily until mid-2023 and have since generally stagnated.

According to the ISM’s May survey, its PMI recorded a reading of 48.7%, below the generally expected figure of 49.7% as well as April’s reading of 49.2%. The average reading since 1948 is roughly 53.0% and any reading below 50% implies a contraction in the US manufacturing sector relative to the previous month.

“The ISM manufacturing survey surprised to the downside, underpinned by weakness in new orders,” said Westpac economist Jameson Coombs. “The soft reading providing another sign that US economic resilience is gradually fading.”

US Treasury yields fell on the day, with falls heaviest at the long end. By the close of business, the 2-year Treasury bond yield had shed 6bps to 4.81% while 10-year and 30-year yields both finished 11bps lower at 4.39% and 4.54% respectively.

In terms of US Fed policy, expectations of a lower federal funds rate in the next 12 months firmed, with nearly three 25bps cuts currently factored in. At the close of business, contracts implied the effective federal funds rate would average 5.33% in June, in line with the current spot rate, 5.325% in July and 5.235% in September. May 2025 contracts implied 4.61%, 72bps less than the current rate.

Purchasing managers’ indices (PMIs) are economic indicators derived from monthly surveys of executives in private-sector companies. They are diffusion indices, which means a reading of 50% represents no change from the previous period, while a reading under 50% implies respondents reported a deterioration on average. A reading “above 42.5%, over a period of time, generally indicates an expansion of the overall economy”, according to the ISM’s latest calculations.      

The ISM’s manufacturing PMI figures appear to lead US GDP by several months despite a considerable error in any given month. The chart below shows US GDP on a “year on year” basis (and not the BEA annualised basis) against US GDP implied by monthly PMI figures. 

According to the ISM and its analysis of past relationships between the PMI and US GDP, April’s PMI corresponds to an annualised growth rate of 1.9%, or about 0.5% over a quarter. Regression analysis on a year-on-year basis suggests a 12-month GDP growth rate of 2.2% five months after this latest report.

The ISM index is one of two monthly US PMIs, the other being an index published by S&P Global. S&P Global produces a “flash” estimate in the last week of each month which comes out about a week before the ISM index is published. The S&P Global flash April manufacturing PMI registered 49.9%, down 2.0 percentage points from March’s final figure.

Sign of inflation progress? Inflation Gauge slows to 3.1% in year to May

03 June 2024

Summary: Melbourne Institute Inflation Gauge index up 0.3% in May; up 3.1% on annual basis; Westpac: could be sign of better inflation progress in May, too early to draw conclusions; ACGB yields fall; rate-cut expectations firm.

The Melbourne Institute’s Inflation Gauge is an attempt to replicate the ABS consumer price index (CPI) on a monthly basis. It has turned out to be a reliable leading indicator of the CPI, although there are periods in which the Inflation Gauge and the CPI have diverged for as long as twelve months. On average, the Inflation Gauge’s annual rate tends to overestimate the ABS rate by around 0.1%, or at least until recently.

The Melbourne Institute’s latest reading of its Inflation Gauge index indicates consumer prices increased by 0.3% in May, up from the 0.1% increases posted in March and April. However, the index rose by 3.1% on an annual basis, down from April’s comparable figure of 3.7%.

“The inflation measure has tracked above the official ABS monthly and quarterly inflation results since the middle of last year,” said Westpac economist Jameson Coombs. “Taken alone this could be a sign we may see some better inflation progress in May. However, it’s too early to draw too much from the move.”

Commonwealth Government bond yields declined again, largely in line with falls of US Treasury yields on Friday night (AEST). By the close of business, the 3-year ACGB yield had lost 3bps to 4.02%, the 10-year yield had shed 4bps to 4.38% while the 20-year yield finished 3bps lower at 4.68%.

Expectations regarding rate cuts in the next twelve months firmed by the end of the day. In the cash futures market, contracts implied the cash rate would remain close to the current rate for the next few months and average 4.315% through June and July and 4.345% in August. November contracts implied 4.335%, February 2025 contracts implied 4.285% while May 2025 contracts implied 4.18%, 14bps less than the current cash rate.

Central bankers desire a certain level of inflation which is “sufficiently low that it does not materially distort economic decisions in the community” but high enough so it does not constrain “a central bank’s ability to combat recessions.”

Disinflation process still underway; core PCE prices up 0.2% in April

31 May 2024

Summary: US core PCE price index up 0.2% in April, in line with expectations; annual rate unchanged at 2.8%; ANZ: provides some confidence US disinflation process still underway; Treasury yields fall; Fed rate-cut expectations firm.

One of the US Fed’s favoured measures of inflation is the change in the core personal consumption expenditures (PCE) price index. After hitting the Fed’s target at the time of 2.0% in mid-2018, the annual rate then hovered in a range between 1.8% and 2.0% before it eased back to a range between 1.5% and 1.8% through 2019. It then plummeted below 1.0% in April 2020 before rising back to around 1.5% in the September quarter of that year. It has since increased significantly and still remains above the Fed’s target even after recent declines.

The latest figures have now been published by the Bureau of Economic Analysis as part of the April personal income and expenditures report. Core PCE prices rose by 0.2% over the month, in line with expectations as but down from March’s 0.3% increase. On a 12-month basis, the core PCE inflation rate remained unchanged at 2.8%.

“Overall, the price data were in line with expectations,” said ANZ economist Jack Chambers. “So, while it is still too high to make the Fed consider imminent cuts, it will provide some confidence that the disinflation process is still underway, albeit slowly.”

US Treasury bond yields fell on the day. By the close of business, the 2-year Treasury bond yield had shed 6bps to 4.87%, the 10-year had lost 5bps to 4.50% while the 30-year yield finished 3bps lower at 4.65%.

In terms of US Fed policy, expectations of a lower federal funds rate in the next 12 months firmed slightly, with at least two 25bp cuts currently factored in. At the close of business, contracts implied the effective federal funds rate would average 5.33% in June, in line with the current spot rate, 5.325% in July and 5.25% in September. May 2025 contracts implied 4.695%, 63bps less than the current rate.

The core version of PCE strips out energy and food components, which are volatile from month to month, in an attempt to identify the prevailing trend. It is not the only measure of inflation used by the Fed; the Fed also tracks the Consumer Price Index (CPI) and the Producer Price Index (PPI) from the Department of Labor. However, it is the one measure which is most often referred to in FOMC minutes.

Private credit growth up 0.5% in April

31 May 2024

Summary: Private sector credit up 0.5% in April, slightly above expectations; annual growth rate steady at 5.2%; Westpac: credit growth less than post-2000 average, more than post-GFC average; ACGB yields fall; rate-cut expectations firm; owner-occupier segment accounts for 45% of net growth.

The pace of lending growth in the non-bank private sector by financial institutions in Australia followed a steady-but-gradual downtrend from late 2015 through to early 2020 before hitting what appears to be a nadir in March 2021. That downtrend ended later in that same year and annual growth rates shot up through 2022, peaking in September/October before easing through 2023.

According to the latest RBA figures, private sector credit increased by 0.5% in April. The result was slightly above the 0.4% rise which had been generally expected as well as March’s 0.4% rise. On an annual basis, the growth rate remained unchanged at 5.2%.

“Annual credit growth at 5.2% compares with a post-2000 average of 7.5% but is more in line with the subdued post-GFC average of 4.6%,” said Westpac senior economist Matthew Hassan. “Note that this is in the context of relatively high inflation; the CPI [is] up 3.6% over the year to April.”

Commonwealth Government bond yields moved moderately lower across the curve on the day, slightly lagging the falls of US Treasury yields on Thursday night. By the close of business, 3-year and 10-year ACGB yields had both lost 4bps to 4.05% and 4.42% respectively while the 20-year yield finished 4bps lower at 4.71%.

Expectations regarding rate cuts in the next twelve months firmed by the end of the day. In the cash futures market, contracts implied the cash rate would remain close to the current rate for the next few months and average 4.315% through June and 4.345% in August. November contracts implied 4.36%, February 2025 contracts implied 4.31% while May 2025 contracts implied 4.215%, 10bps less than the current cash rate.

Owner-occupier accounted for around 45% of the net growth over the month while business lending accounted for a bit over 35%. Investor lending accounted for a little under 20% while personal lending accounted for the balance.   

The traditional driver of overall loan growth, the owner-occupier segment, grew by 0.5% over the month, in line with the previous month. The sector’s 12-month growth rate ticked up from 5.0% to 5.1%.

Total lending in the non-financial business sector increased by 0.6%, unchanged from March’s growth rate after revisions. Growth on an annual basis slowed from 7.3% to 6.8%.

Monthly growth in the investor-lending segment slowed to a near-halt in early 2018 and essentially stayed that way until mid-2021. In April, net lending rose by 0.3%, the same growth as in March. The 12-month growth rate increased from 3.0% to 3.1%.

Total personal loans increased by 0.2%, down from 0.4% in March, while the annual growth rate increased from 3.1% to 3.2%. This category of debt includes fixed-term loans for large personal expenditures, credit cards and other revolving credit facilities.

Euro-zone economy recovering; composite confidence index up in May

30 May 2024

Summary: Euro-zone composite sentiment indicator up modestly in May, almost in line with expectations; readings up in three of five sectors; up in three of four largest euro-zone economies; German, French 10-year yields fall moderately; index implies annual GDP growth rate of 0.4%..

The European Commission’s Economic Sentiment Indicator (ESI) is a composite index comprising five differently weighted sectoral confidence indicators.  It is heavily weighted towards confidence surveys from the business sector, with the consumer confidence sub-index only accounting for 20% of the ESI. However, it has a good relationship with euro-zone GDP growth rates, although not necessarily as a leading indicator.

According to the latest survey taken by the European Commission, confidence has improved on average across the various sectors of the euro-zone economy in May. The ESI posted a reading of 96.0, almost in line with expectations, but up modestly from April’s revised reading of 95.6. The average reading since 1985 is just under 100.

“The data affirm that the euro area economy is gradually recovering from structural shocks of the past few years,” said ANZ economist Jack Chambers. “A gradual stabilisation against a backdrop of broad-based disinflation will provide the policymakers confidence to cut rates at the ECB’s meeting next week.”

Long-term German and French 10-year bond yields both fell moderately on the day. By the close of business, the German 10-year yield had shed 3bps to 2.66% while the French 10-year yield finished 4bps lower at 3.15%.

Confidence improved in three of the five sectors of the euro-zone economy. On a geographical basis, the ESI increased in three of four of the euro-zone’s largest economies.

End-of-quarter ESI readings and annual euro-zone GDP growth rates are highly correlated. This latest reading corresponds to a year-to-May GDP growth rate of 0.4%, down from April’s implied growth rate of 0.3%.

Click for more news