US industrial output flat in April, less than expected; down 0.4% over past 12 months; Westpac: manufacturing, 80% of total, down 0.3%; US Treasury yields rise; rate-cut expectations soften; capacity utilisation rate slips to 78.4%.
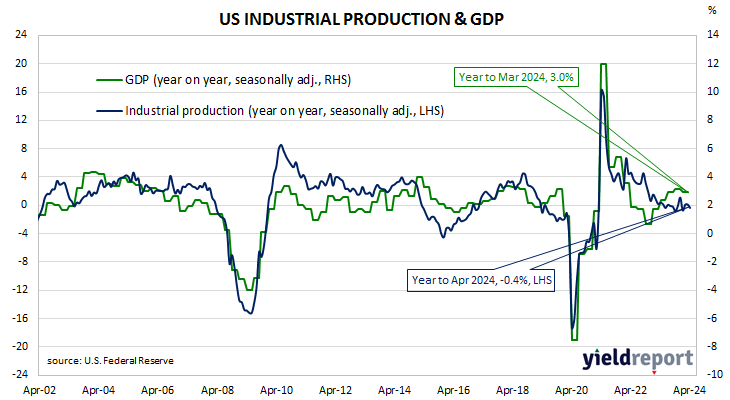
The Federal Reserve’s industrial production (IP) index measures real output from manufacturing, mining, electricity and gas company facilities located in the United States. These sectors are thought to be sensitive to consumer demand and so some leading indicators of GDP use industrial production figures as a component. US production collapsed through March and April of 2020 before recovering the ground lost over the fifteen months to July 2021. However, production levels has largely stagnated since early 2022.
According to the Federal Reserve, US industrial production remained unchanged on a seasonally adjusted basis in April. The flat result was in less than the 0.2% increase which had been generally expected as well as March’s 0.1% rise after it was revised down from 0.4%. On an annual basis the growth rate went into reverse, moving from March’s revised figure of 0.1% to -0.4%.
“Manufacturing output, which makes up around 80% of total production, fell 0.3% over the month of April,” said Westpac senior economist Pat Bustamante.

Short-term US Treasury bond yields rose noticeably on the day with longer-term yields rising by smaller amounts out along the curve. By the close of business, the 2-year Treasury yield had gained 8bps to 4.80%, the 10-year yield had added 4bps to 4.38% while the 30-year yield finished 1bp higher at 4.51%.
In terms of US Fed policy, expectations of a lower federal funds rate in the next 12 months softened, although at least three 25bps cuts are still currently factored in. At the close of business, contracts implied the effective federal funds rate would average 5.32% in June, a touch less than the current spot rate, 5.31% in July and 5.20% in September. May 2025 contracts implied 4.54%, 79bps less than the current rate.
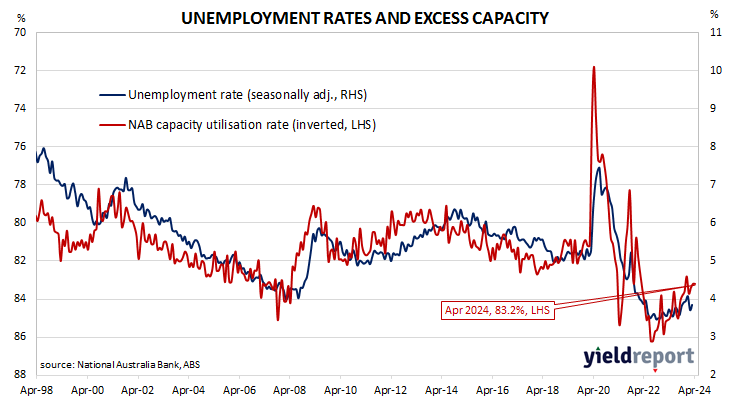
The same report includes capacity utilisation figures which are generally accepted as an indicator of future investment expenditure and/or inflationary pressures. Capacity usage hit a high for the last business cycle in early 2019 before it began a downtrend which ended with April 2020’s multi-decade low of 64.2%. April’s reading slipped by 0.1 percentage points to 78.4%, 1.7 percentage points below the long-term average.
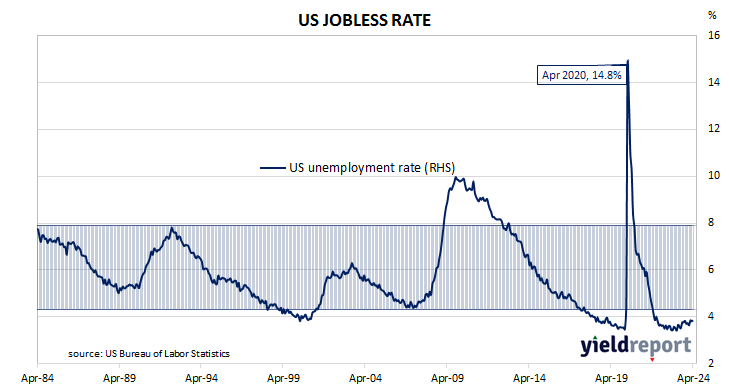
While the US utilisation rate’s correlation with the US jobless rate is solid, it is not as high as the comparable correlation in Australia.