21 February 2018
Westpac and the Melbourne Institute describe their Leading Index as a composite measure which attempts to estimate the likely pace of economic activity relative to trend in Australia. The index combines certain economic variables which are thought to lead changes in economic growth into a single variable. This variable is claimed to be a reliable cyclical indicator for the Australian economy and an indicator of swings in Australia’s overall economic activity.
Since October, the Leading Index has returned values which implied above-trend growth in the near future. However, in January the six month annualised growth rate of the indicator fell back from a revised +1.39% to +0.73%. These figures represent growth rates above trend GDP growth, which is generally thought to be around 2.75% per annum for Australia.
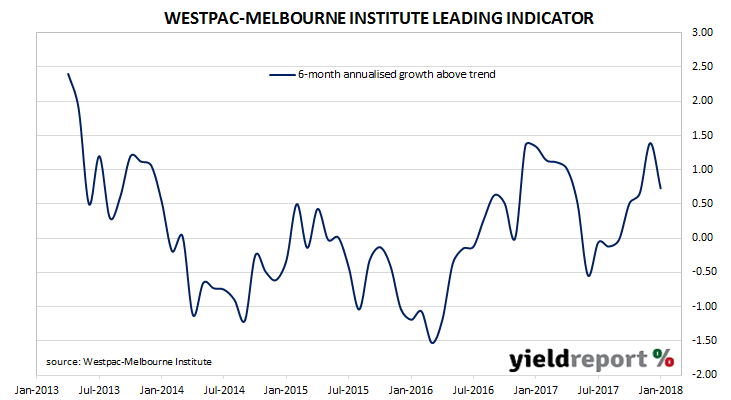
Westpac chief economist Bill Evans was not overly-concerned by the Index’s retreat. “This is a full reversal of the strong 0.7% jump we saw last month…Nevertheless the Index is still registering a comfortably above-trend reading and, following the solid results in October and November, points to above-trend growth in the early part of 2018.”
21 February 2018
There are a diminishing number of notes and corporate bonds listed on the ASX. In recent years, companies have had a tendency to raise funds via capital notes, which are the offspring of converting preference shares which began to emerge in the 1990s. As far as local companies are concerned, raising funds via listed-bonds has become unfashionable in Australia.
Soon there will be one fewer ASX-listed note. In a notice to the ASX, APA Group said its subsidiary APT Pipelines intends to redeem all of its ASX-listed subordinated notes (ASX code: AQHHA) on 31 March 2017. (Ed: 31 March is a Saturday and the following weekday is Easter Monday. Payment will take place on 3 April.)
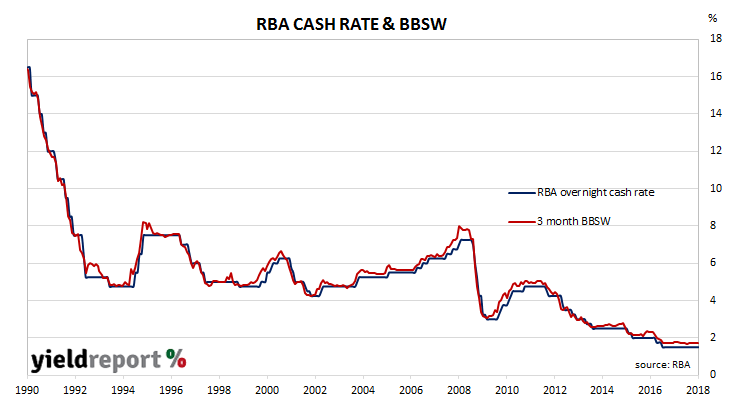
APT Pipeline Notes were issued in September 2012 and they pay a floating rate of interest equivalent to 3 month BBSW + 450bps. The first call date is on 31 March 2018 and, if the redemption notice had not been lodged, the final maturity date was on 30 September 2072.
The redemption will be funded by a $500 million rights issue of ordinary shares which was announced on the day as the redemption notice.
Holders who are on the register on 23 March 2018 will receive $100 plus $1.551 interest per note. Trading of the notes on the ASX will cease at the close of business on 21 March 2018.
The announcement of APT’s intention to redeem was expected and it had little effect on the notes’ yield. At the closing price of $101.00, the internal rate of return (IRR) was just under 4.2% before transaction costs.
20 February 2018
The RBA held the official cash rate steady at its board meeting in February and, given the February Statement on Monetary Policy was only a few days later, nothing new was expected from the minutes of that meeting.
The minutes have now been released and financial markets did not find anything controversial or unexpected. Reactions were mixed. 2 year and 10 year bond yields each increased by 2bps to 2.18% and 2.90% respectively while the local currency finished the day a little weaker at 78.85 U.S. cents, which is about 0.3 U.S. cents lower.
16 February 2018
Sponsored by Laminar Capital
Asymmetric Credit Partners (under terms and conditions set out under the Information Memorandum dated February 2018) will be issuing Senior Secured Fixed Rate Bonds. The issue size is $6 million. The Interest Rate will be fixed at 8.00% p.a. until the Call Date. If the deal is not called the fixed coupon will step-up to 10.00% p.a. until Maturity on 2 December 2019. Interest is paid Quarterly on 2nd March, June, September and December commencing on 2nd June 2018 up to, and including, Maturity Date or any earlier redemption date.
The proceeds of the issue of the Notes will be used to provide bridging debt finance (“Loan”) in an amount of AUD $7.5 million to the Northam Solar Project described below.
The Northam Solar Project involves the construction and operation of a 10 MW Solar Power Station in Northam, Western Australia. The project is currently undertaken by Carnegie Clean Energy Limited (ASX: CCE) (“Carnegie”). The project will consist of approximately 34,0100 solar panels constructed on 25 hectares of strategically-located land to deliver approximately 24,000 MWh of electricity per annum for at least the next 25 years.
15 February 2018
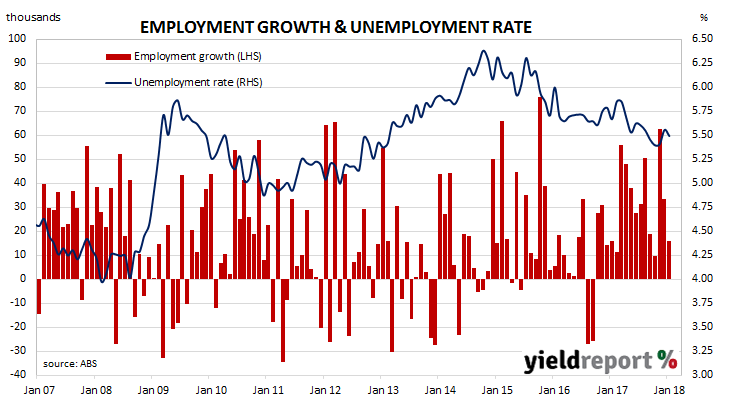
The Australian economy has recorded its sixteenth consecutive month of employment gains. The run of monthly consecutive gains has exceeded the fourteen month stretch from August 1979 to September 1980 and the fifteen month stretch from May 1993 to July 1994.
The ABS released employment estimates for January which indicate the total number of people employed in Australia in either full-time or part-time work increased by 16,000. Market expectations prior to the report’s release were for 15,000 new positions.
Financial markets reacted by sending yields and the AUD higher. Local 3-year and 10-year bond yields had started the day higher on the back of higher U.S. yields but they dropped upon release of the employment figures. However, within 30 minutes, yields bounced and 3-year bond yields finished the day 3bps higher at 2.16% while 10-year bond yields jumped 7bps to finish at 2.92%. The AUD also initially dropped against the USD but it quickly recovered to finish at 79.45 U.S. cents.
The participation rate fell back from a revised figure of 65.7% in December to a near-record 65.6% as an additional 8,100 people entered the labour market. While total employment increased, the total number of unemployed shrank by 7,900 and the unemployment rate fell from an upwardly-revised December figure of 5.6% to 5.5%.
15 February 2018
The Producer Price Index (PPI) is a measure of prices charged by producers for domestically produced goods, services, and construction. It is constructed by the U.S. Bureau of Labor Statistics in a fashion similar to the consumer price index (CPI) except it measures prices received from the producer’s perspective. It is another one of the various measures of inflation tracked by the U.S. Fed, along with the CPI and core personal consumption expenditure (PCE).
The latest January figures have been published by the Bureau and they were in line with expectations at 0.4% for the month. On an annual basis, producer price inflation fell back to 2.6% in January after reading 2.8% in December and 3.0% in November.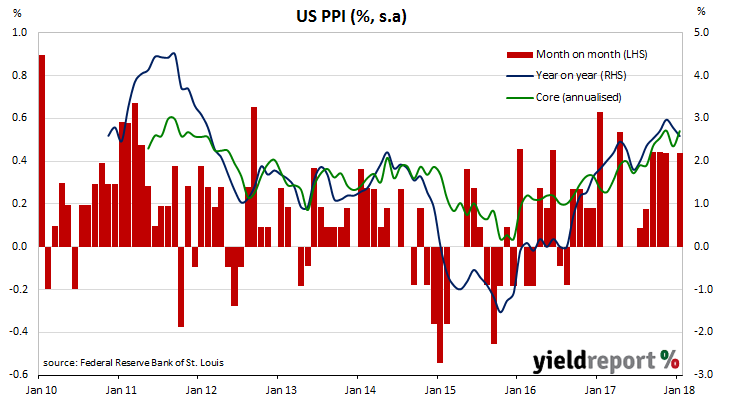
Core PPI, or PPI which excludes food, energy and trade services, also increased by 0.4% in January. On an annual basis, it increased to 2.5% in January after reading 2.2% in December and 2.3% in November.
14 February 2018
During most of the period between 2014 and 2017, there was a divergence between consumer sentiment and business confidence in Australia. Some economists explained the difference by a lack of wages growth; low wages growth is good for business in keeping costs down and margins up. However, households’ propensity to spend is hampered. Other explanations, such as households’ debt levels and the threat of higher mortgage rates have also been put forward.
After the Westpac-Melbourne Institute, December consumer survey was released, there was some talk of a possible alignment of the business and household sectors. The January survey provided some support to this line of thinking but then the latest February report has cast some doubts.
According to the latest Westpac-Melbourne Institute Consumer Sentiment Index, households were less optimistic than a month ago as the Index reading dipped from 105.1 in January to 102.7 in February. Any reading above 100 indicates the number of consumers who are optimistic is greater than the number of consumers who are pessimistic. The long-term average reading is just over 101.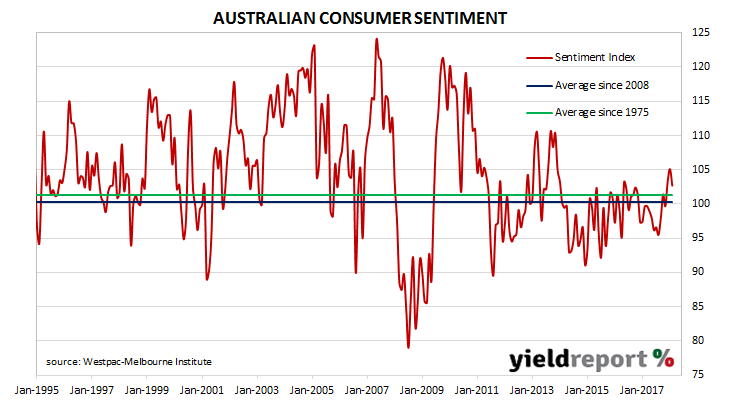
14 February 2018
U.S. household spending fell back in January, as higher fuel prices were outweighed by lower car sales and a drop in the sale of building supplies and garden items. According to the latest advance U.S. retail sales numbers released by the U.S. Census Bureau, retail sales shrank by 0.3% for the month. The decline is well below the expected figure of +0.2% and lower than December’s revised figure of 0.0%. On a yearly basis, the increase was 3.6%, down from December’s comparable figure of 5.2%.
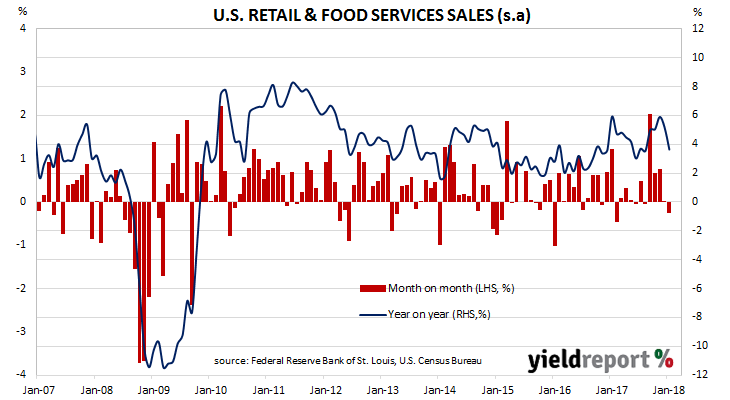
“Non-store retailer” sales, which includes online transactions as well as direct selling and other forms of electronic commerce, remained almost unchanged from December. However, this segment still grew by 10.2% over the last 12 months and it remains the fastest-growing of all segments.
ANZ senior economist Felicity Emmett said the result may be a sign U.S. households are facing pressures. “The combination of higher wage growth and declining consumption momentum may suggest the fall in the savings rate, rise in credit, and interest rates could be starting to pinch households a bit. The data are volatile, however we are keeping a close eye on the consumer with saving rates so low.”
14 February 2018
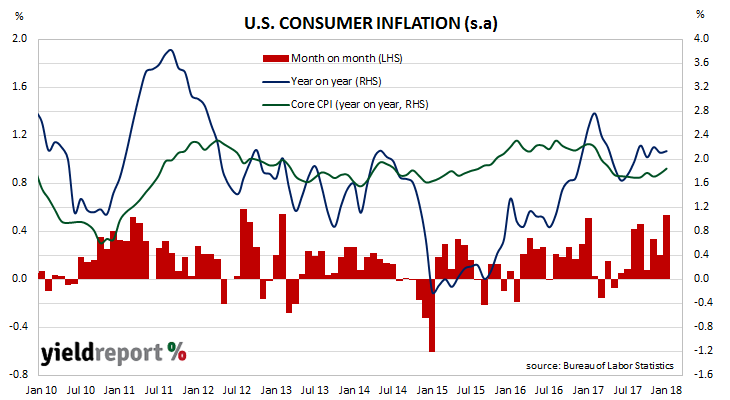
The U.S. consumer price index increased in December as fuel and clothing prices rose significantly. Consumer price index (CPI) figures released by the Bureau of Labor Statistics indicated consumer prices rose by 0.5% in January, instead of the 0.3% increase expected and higher than December’s comparable figure of 0.2%. On a 12-month basis, the consumer inflation rate remained unchanged at 2.1%.
Financial markets had an unusual reaction. U.S. bond yields were sent higher but at the same time, USD was off by around 0.8% against other major currencies. 2 year bond yields increased by 5bps to 2.16% and 10 year yields increased by 7bps to 2.90%. Prices of overnight cash futures increased after the data was released and the chance of a March rate rise moved to 79%.
Core prices remained unchanged from December’s comparable figures. CPI excluding food and energy rose by 0.3% over the month and 1.8% for the year.
13 February 2018
Early in December, business conditions had been described as “solid” by NAB economists. Then they were upgraded to “strong” in January. Now they are described as “elevated” but in reality they are just short of “never better”. According to NAB’s latest monthly business survey of 400 firms conducted in the last week of January, its Business Conditions Index jumped to 19, just short of its all-time high of 20.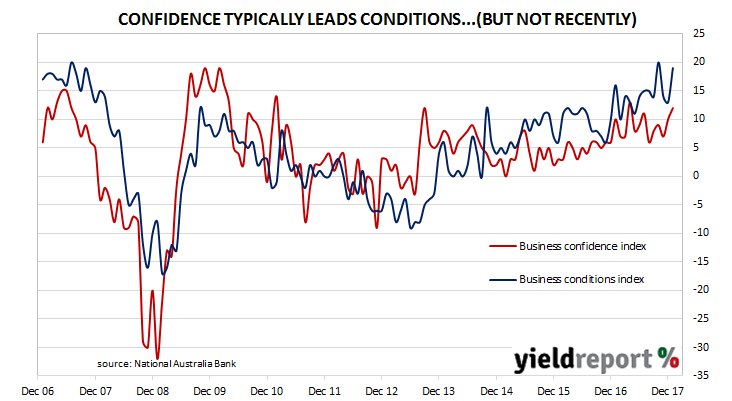
Typically, NAB’s confidence index leads the conditions index by approximately one month, although in recent months the two surveys have diverged and the condition index has led the confidence index higher in trend terms since late 2014. The latest figures have not changed this situation. The confidence index increased from a revised figure of 10 at the end of December to 12 at the end of January, a figure which is just within the “normal” bound above the long term average reading of 5.
The capacity utilisation rate, generally accepted as an indicator of future investment expenditure, jumped from 82.2% to 82.7%, well above its long-term average reading. According to NAB chief economist Alan Oster, this is a good sign for business investment in plant and equipment. “This bodes well for business investment, although surveyed capex pulled back a little this month.” It also is a good sign for additional employment. “Capacity issues can also be addressed by taking on workers; a rise in the capacity utilisation indicator also tends to be associated with a decline in unemployment levels.”
