13 February 2018
Central bankers wanted higher inflation rates and, in the U.K, they now have it. However, the latest batch of consumer inflation figures out of the U.K reflects a pause in what has been a rapid increase in British inflation.
Figures released by the Office of National Statistics indicate the headline consumer price index (CPI) fell back by 0.5% in January but still grew by 3.0% over the last 12 months. While the increase in the CPI in January marks a sharp turnaround from December’s 0.3% increase, the annual growth rate remained unchanged at 3.0%.
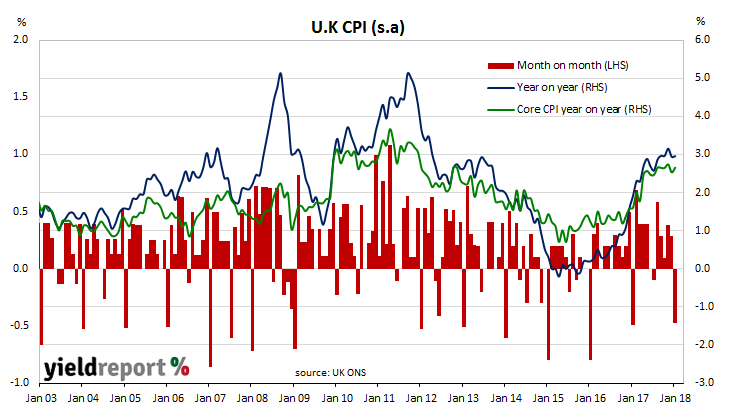
Core inflation rates, which strip out energy, food, alcohol and tobacco prices, are generally less volatile than headline rates. The latest figures are unsupportive of this claim and core CPI fell by 0.9% in January. However, the annual growth rate increased from 2.5% in December to 2.7% in January.
13 February 2018
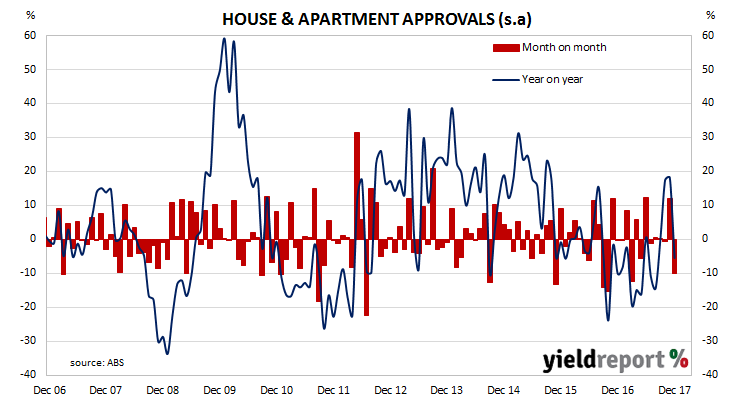
The Australian Bureau of Statistics (ABS) collects data on housing finance commitments made by significant lenders and their figures include secured (mortgage) finance commitments for the construction or purchase of owner-occupier dwellings and investment properties. It has some overlap with the RBA’s monthly private sector credit statistics which also includes investor lending and owner-occupier lending.
The ABS has released housing finance figures for December which indicate the number of owner-occupier approvals excluding refinancing fell by 3.4% over the month. While the figures show a fall over the month, compared to a year ago, December’s total approvals represent an increase of 2.1%. In November, the comparable figures were +1.5% for the month and +8.5% over the previous 12 months.
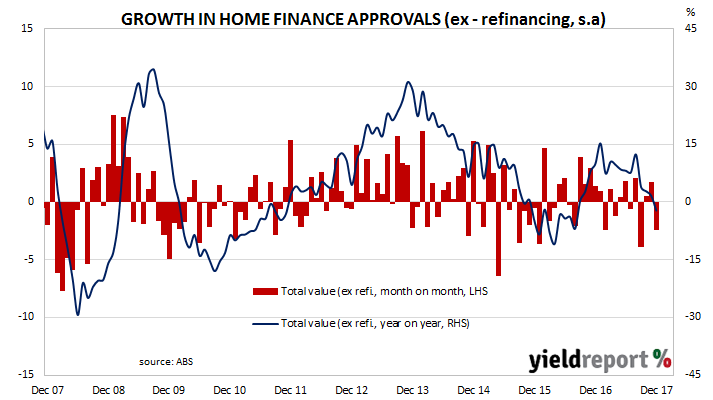
In dollar terms, total loan approvals (excluding refinancing) fell by 2.5% for the month and 2.2% when compared to total loan approvals for December 2016. Both figures are lower than November’s comparable growth rates of +1.7% and +1.6% (after revisions).
Owner-occupier loan approvals (excluding refinancing) fell by 2.3% for the month, down from November’s revised figure of +2.3%. In annual terms, the value of owner-occupier approvals rose by 5.6%, which is also lower than November’s revised annual rate of 11.5%.
06 February 2018
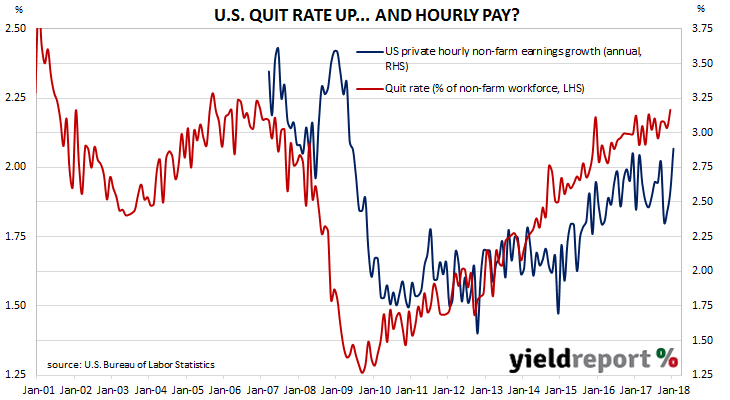
The quit rate time series produced by the Job Openings and Labor Turnover Survey (JOLTS) is a leading indicator of U.S hourly pay. As wages account for around 55% of a product’s or service’s price*, wage inflation and overall inflation rates tend to be closely related. Former Federal Reserve chief Janet Yellen was known to pay close attention to the quit rate but whether new Fed chief Jerome Powell regards the indicator with as much interest is as yet unknown.
Figures released as part of the December JOLTS report show the quit rate increased from 2.1% of the non-farm workforce at the end of November to 2.2% at the end of December. The increase was driven by higher quit figures in the accommodation and food services sectors and, to a lesser extent, in the retail sector.
06 February 2018
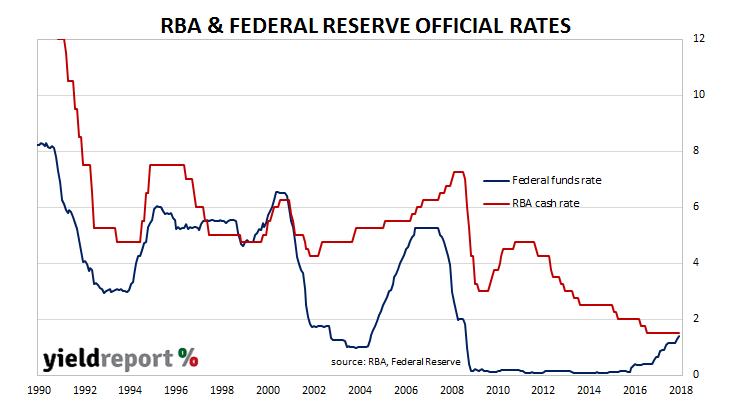
The February board meeting of the RBA is historically one of the four months of the year in which the likelihood of a rate change is highest. This is not to say every February meeting results in a rate change; February, along with May, August and November happen to be the four months of the year in which previous rate changes have typically occurred.
As expected, the RBA announced Australia’s overnight cash rate would remain at 1.50%. “The low level of interest rates is continuing to support the Australian economy”, as the accompanying statement puts it. The current rate is the lowest in the RBA’s history despite Australia’s economy not being in a recession or looking as if it is heading into one.
The statement is not dramatically different to the one in December. According to the RBA Board, the global economy has experienced “a broad-based pick-up”, oil prices and other commodity prices have increased over recent months, Australian GDP growth is expected to average “a bit above 3% over the next couple of years” and various forward-looking indicators imply “solid growth” in employment numbers.
Even so, the cash futures markets still only imply a near-50% chance of a rate increase by the end of 2018. According the RBA statement, “Inflation is low” and “wage growth remains low” with each expected to rise gradually over time. Economists agree and it is this line of thinking which is driving the market’s current expectation of RBA policy through the rest of this year. On balance, the statement was interpreted as a sign the RBA was still “neutral” in regards to its interest-rate policy.
06 February 2018
After going crazy in November, Australians appear to have put away their purses and wallets, according to the latest retail sales figures for December.
While five out of the six sales categories fell, lower expenditures on household goods, the category which includes electronic goods such as iPhone X, accounted for almost all of the overall fall in total retail sales during the month. Increased sales of food was largely offset by lower sales of recreational goods, toiletries and cosmetics.
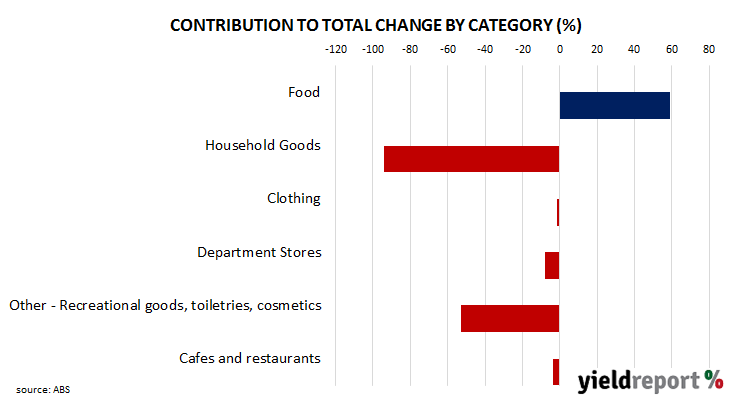
Total retail sales (seasonally adjusted) fell by 0.5% in December, after rising by 1.3% (revised up from 1.2%) in November. On a year-on-year basis, sales grew by 2.5%, down from the previous month’s 2.9% annual rate.
05 February 2018
The Melbourne Institute’s Inflation Gauge is an attempt to replicate the ABS consumer price index (CPI) on a monthly basis instead of quarterly. It has turned out to be a reliable leading indicator of the CPI, although there are periods in which the Inflation Gauge series and the CPI have diverged, only for the two series to eventually converge over the space of six to twelve months. Generally, the Inflation Gauge’s annual rate tends to overestimate changes in the CPI inflation by about 0.08%.
During January, the Inflation Gauge increased by 0.3%, taking the annual rate to 2.0%. In December, the comparable figures were 0.1% and 2.3%. While the latest month’s inflation rate was higher than December’s rate, the annual rate fell as the January 2017 index reading had been 0.6% higher than the December 2016 figure. Therefore, the year-on-year rate started from a higher base. Perversely, this effect may lead to a jump in the annual rate next month as the base month moves to February 2017.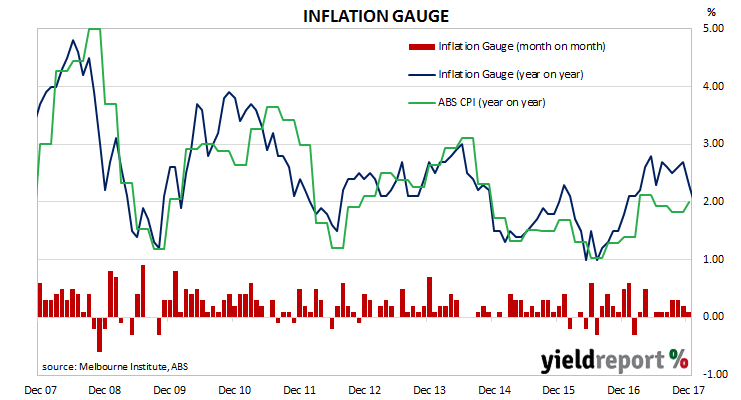
05 February 2018
ANZ’s job advertisement survey is well-known as a leading indicator of employment numbers in Australia. It reflects changes in demand for labour and it provides another measure of activity in the economy. There is also a fairly good inverse relationship between changes in Australia’s unemployment rates and changes in the RBA cash rate. Understanding the path of Australia’s unemployment rate has historically provided a reliable indicator of RBA rate changes.
January’s figures have been released and, after revisions, total advertisements were 6.2% higher at 177,961 (seasonally adjusted), up from December’s revised figure of 167,521. On a 12 month basis, job advertisements were 13.82% higher while December’s comparable figure was 11.4%.
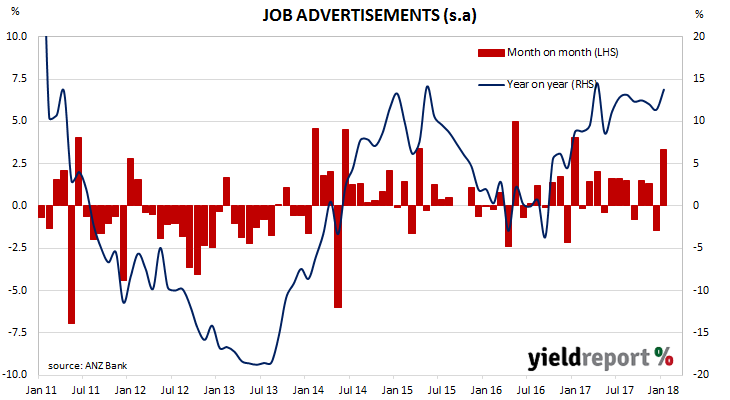
ANZ Head of Australian Economics David Plank said these latest figures were consistent with strong business conditions and a sign of renewed employment growth. “The bounce in January is in line with ongoing strength in business conditions, capacity utilisation and other surveys of employment conditions. Taken together, there is some evidence that the slowdown in the trend we saw…last year may reverse in the coming months.” However, he cautioned the figures could vary considerably from month to month at this time of the year.
02 February 2018
The U.S economy has produced another month of robust job creation and kept the U.S un-employment rate at its lowest level since February 2001. According to the U.S. Bureau of Labor Statistics, the U.S. economy created 200,000 jobs in the non-farm sector in January while December’s figure was revised up from +148,000 to +160,000 but the November number was revised down from +252,000 to +216,000. The market’s median expectation for employment growth in January was +180,000.
U.S. financial markets initially reacted by sending yields higher before they retraced. By the end of the day, 2 year yields were 2bps weaker at 2.14% while the 10 year yield increased by 5bps to 2.84% and 30 year yields were 7bps higher at 3.09%. The U.S currency was stronger against all major currencies, including the Aussie. According to cash futures prices, the implied probability of a rate rise by the U.S. FOMC at its upcoming March meeting slipped back from around 79% to 76%.
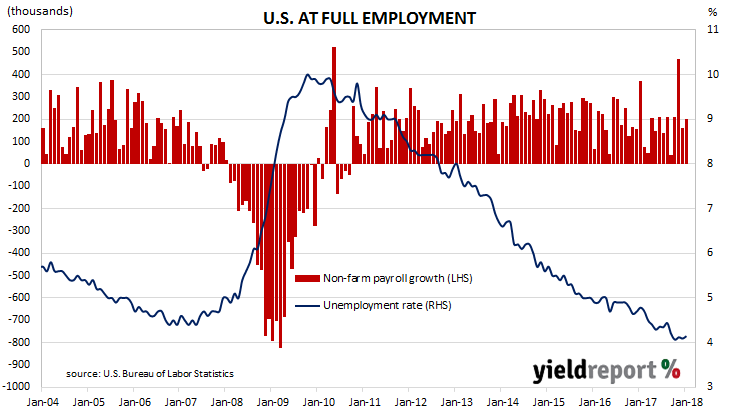
After revisions to previous months’ figures, the unemployment rate remained unchanged at 4.1% as the total number of unemployed people grew by 108,000 while the total number of people employed in both the farm and non-farm sectors grew by 409,000. Average hourly pay rates increased by 0.3% for the month and 2.9% for the 12 months to January.
The total number of employed persons in the non-farm sector at the end of January was 147.8 million and 154.4 million overall. Over the past twelve months, 2.4 million jobs have been created in the U.S. with around 90% of them in the non-farm sector. Another figure which is indicative of the state of the U.S. economy is the employment-to-population ratio. After a volatile few months, this ratio has settled down at 60.1% for a third month in a row.
01 February 2018
Aside from engineering and architectural design, one of the earliest requirements of a building project is to obtain approval from the relevant statutory body. As a result, building approvals data is a leading economic indicator of future construction. While not all projects which have been approved are completed, all completed projects will have been granted approval. Approvals data thus provides a useful indicator of future construction.
The latest building approval figures have been released by the Australian Bureau of Statistics and they indicate total approvals went into reverse in December. Compared to November, total December dwelling approvals were 10.0% lower after revisions. On a 12 month basis, total approvals were 5.5% lower than in December 2016 (after revisions).
House approvals increased by 1.4% in December, which translates to a 5.5% rise over the previous 12 months. After revisions, the corresponding figures for November were +11.9% for the month and +18.1% for the year.
31 January 2018
For the greater part of the last two decades, inflation rates in advanced economies have been low. Up until around the start of this decade, low inflation had been viewed as a positive. High inflation in the 1970s and early 1980s was thought responsible for distorting investment decisions and it had been accompanied by economic stagnation in western countries. Once the back of inflation had been broken in the U.S in the early 1980s and in Australia in the early 1990s, locking in low inflation rates was a goal of central banks around the world. However, since 2009, central banks in advanced economies have regularly pointed to low inflation rates as a reason for continuing ultra-low interest rate policies.
Figures for the December quarter have now been released by the ABS. The headline number was weaker than the expected 0.70%, as were seasonally-adjusted and core inflation figures. Unadjusted inflation was 0.60% for the quarter while seasonally-adjusted inflation also came in at 0.60%. On a 12-month basis, headline consumer inflation recorded 1.90%, up from the September quarter’s comparable figures of 1.80%. On a seasonally-adjusted basis, inflation increased from 1.80% to 2.0%.
Financial markets reacted to the figures by sending bond yields and the local currency lower. Bond yields fell, especially at the short end in a repeat of the bond market response to September’s figures. 3 year yields initially lost 7bps to 2.16% while 10 year bond yields fell 4bps to 2.80% before they closed at 2.20% and 2.82% respectively. The AUD dropped around 0.45 U.S. cents from 81.00 U.S. cents immediately after the report’s release cents before it settled at around 80.60 U.S. cents. Cash futures reduced the chances of the RBA raising the cash rate in 2018, although contracts still imply a 74% chance of an increase before the end of November.
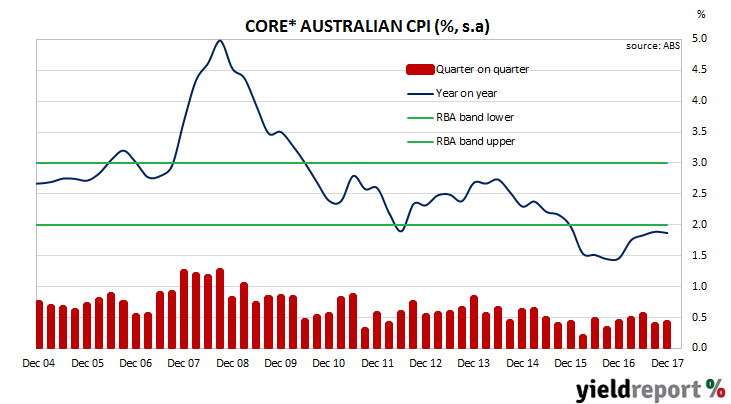
*average of Trimmed Mean & Weighted Median
“Core” inflation measures favoured by the RBA, such as the average of the “trimmed mean” and the “weighted median”, did not change from the September quarter. The average of the two measures were in line with the market’s expected figure 0.40% for the quarter and 1.90% for the year.
