News

March home approvals up after three months of falls

02 May 2024

Home approval numbers up 1.9% in March, less than expected; 2.2% lower than March 2023; Westpac: uncertain as to continuation of weakness from December-February period; ACGB yields down; cash rate expectations sending mixed messages; Westpac: more-volatile private units segment may be playing larger role; house approvals up 3.6%, apartments down 1.8%; non-residential approvals up 28.7% in dollar terms, residential alterations up 8.3%.

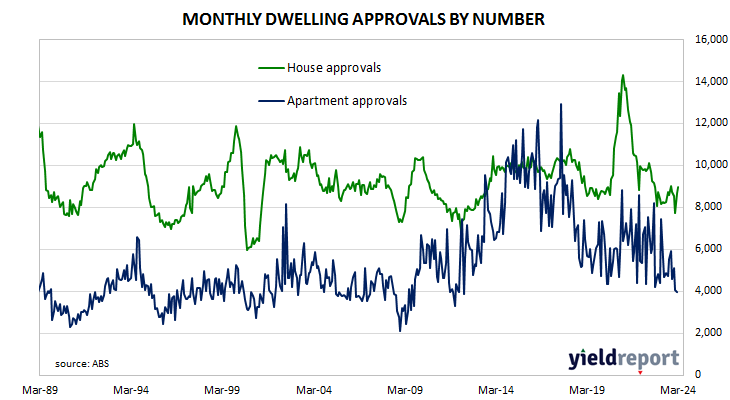
Building approvals for dwellings, that is apartments and houses, headed south after mid-2018. As an indicator of investor confidence, falling approvals had presented a worrying signal, not just for the building sector but for the overall economy. However, approval figures from late-2019 and the early months of 2020 painted a picture of a recovery taking place, even as late as April of that year. Subsequent months’ figures then trended sharply upwards before reversing course and falling back through 2021, 2022 and 2023.

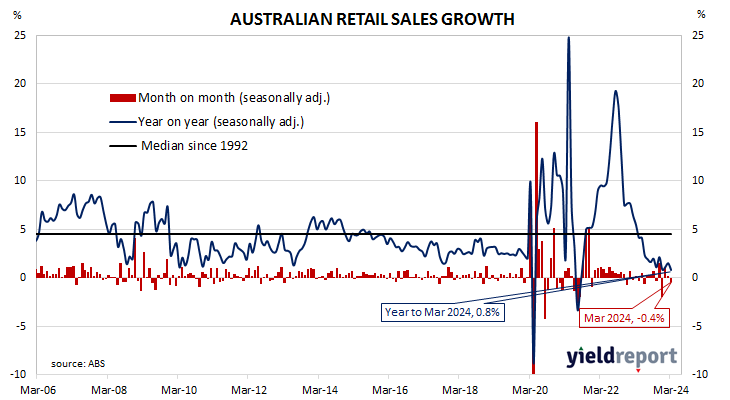
The Australian Bureau of Statistics has released the latest figures from March and they show total residential approvals rose by 1.9% over the month on a seasonally-adjusted basis. The rise was less than the 3.0% gain which had been generally expected but it contrasted with February’s 0.9% decline after revisions. Total approvals fell by 2.2% on an annual basis, up from the previous month’s revised figure of -5.3%. Monthly growth rates are often volatile.

“Overall, it remains uncertain whether the signs of weakness over December-February is signalling a renewed underlying downtrend in dwelling approvals,” said Westpac economist Ryan Wells.

Commonwealth Government bond yields fell nearly uniformly across the curve on the day, somewhat in line with the falls of US Treasury yields on Wednesday night. By the close of business, the 3-year ACGB yield had lost 5bps to 4.06%, the 10-year had shed 6bps to 4.46% while the 20-year yield finished 5bps lower at 4.74%.

In the cash futures market, expectations regarding the cash rate changes over the next 12 months continued to send mixed messages.  At the end of the day, contracts implied the cash rate would remain close to the current rate for the next few months and average 4.325% through May and 4.345% in June. However, November contracts implied a 4.42% average cash rate, February contracts implied 4.33%, while May 2025 contracts implied 4.23%.

“At face value, March’s lift in headline approvals was not as strong as expected, but its compositional detail suggests that the more-volatile private units segment may be playing a larger role,” Wells added. “More data is needed to form a judgement on the underlying trend.”

Approvals for new houses rose by 3.6% over the month, down from February’s 12.2% after revisions. On a 12-month basis, house approvals were 7.0% higher than they were in March 2023, up from February’s comparable figure of -0.9%.                                    

Apartment approval figures are usually a lot more volatile and March approvals for this category declined by 1.8% after a 20.7% fall in February. The 12-month growth rate fell from February’s revised rate of -13.4% to -18.1%.

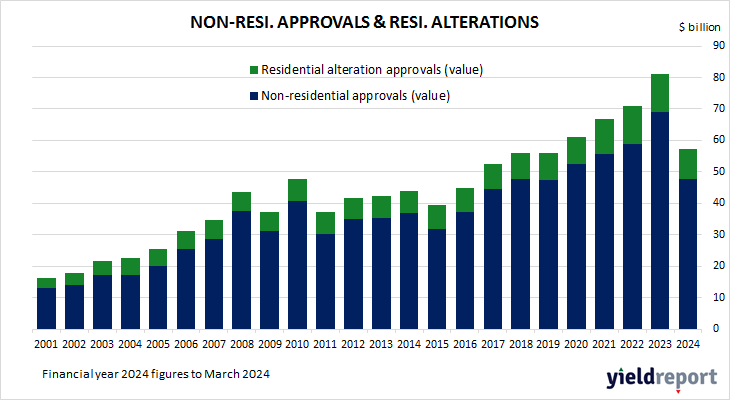
Non-residential approvals increased by 28.7% in dollar terms over the month but were 5.7% lower on an annual basis. Figures in this segment also tend to be rather volatile.

Residential alteration approvals rose by 8.3% in dollar terms over the month and were 9.2% higher than in March 2023.

US quit rate continues downtrend in March

01 May 2024

Summary: US quit rate declines to 2.1% in March; Citi: falling quits consistent with weakening perceptions of employment prospects; US Treasury yields fall; expectations of Fed rate cuts firm; fewer quits, openings, separations.

The number of US employees who quit their jobs as a percentage of total employment increased slowly but steadily after the GFC. It peaked in March 2019 and then tracked sideways until virus containment measures were introduced in March 2020. The quit rate then plummeted as alternative employment opportunities rapidly dried up. Following the easing of US pandemic restrictions, it proceeded to recover back to its pre-pandemic rate in the third quarter of 2020 and trended higher through 2021 before easing through 2022 and 2023.

Figures released as part of the latest Job Openings and Labor Turnover Survey (JOLTS) report show the quit rate declined in March. 2.1% of the non-farm workforce left their jobs voluntarily, down from 2.2% in February. Quits in the month decreased by 198,000 while an additional 303,000 people were employed in non-farm sectors.

“Falling quits are consistent with survey data showing quickly weakening perceptions of employment prospects and softer hiring has been accompanied by a rise in unemployment,” said Citi economist Veronica Clark. ”We continue to see downside risks for upcoming employment reports, including April payrolls on Friday.”

The report came out on the same day as the ISM’s April manufacturing PMIs and the announcement of no change at the FOMC’s May meeting. US Treasury yields fell on the day, with decline heaviest at the short end. By the close of business, the 2-year Treasury bond yield had shed 8bps to 4.96%, the 10-year yield had lost 5bps to 4.63% while the 30-year yield finished 4bps lower at 4.75%.

In terms of US Fed policy, expectations of a lower federal funds rate in the next 12 months firmed, with two 25bps cuts currently factored in. At the close of business, contracts implied the effective federal funds rate would average 5.305% in July, 2bps lower than the current spot rate, 5.225% in September and 5.11% in November. However, April 2025 contracts implied 4.785%, 54bps less than the current rate.

The fall in total quits was led by 59,000 fewer resignations in the “Other services” sector while the “Professional and business services” sector experienced the largest increase, rising by just 9,000. Overall, the total number of quits for the month decreased from February’s revised figure of 3.527 million to 3.329 million.     

Total vacancies at the end of March dropped by 325,000, or 3.7%, from February’s revised figure of 8.813 million to 8.488 million. The fall was driven by 182,000 fewer open positions in the “Construction” sector while the “State and local government” sector experienced the single largest increase, rising by 46,000. Overall, 10 out of 18 sectors experienced fewer job openings than in the previous month.  

Total separations decreased by 339,000, or 6.1%, from February’s revised figure of 5.539 million to 5.200 million. The fall was led by the “Retail trade” sector where there were 52,000 fewer separations while the “Educational services” sector experienced 21,000 more separations. Separations decreased in 14 of the 18 sectors.

The “quit” rate time series produced by the JOLTS report is a leading indicator of US hourly pay. As wages account for around 55% of a product’s or service’s price in the US, wage inflation and overall inflation rates tend to be closely related. Former Federal Reserve chief and current Treasury Secretary Janet Yellen was known to pay close attention to it.

April ISM PMI falls below 50; US manufacturing contracting

01 May 2024

Summary: ISM PMI down in April, below expectations; US manufacturing sector drops back into contraction; US Treasury yields fall; expectations of Fed rate cuts firm; ISM: reading corresponds to 1.9% US GDP growth annualised.

The Institute of Supply Management (ISM) manufacturing Purchasing Managers Index (PMI) reached a cyclical peak in September 2017. It then started a downtrend which ended in March 2020 with a contraction in US manufacturing which lasted until June 2020. Subsequent month’s readings implied growth had resumed, with the index becoming stronger through to March 2021. Readings then declined fairly steadily until mid-2023.

According to the ISM’s April survey, its PMI recorded a reading of 49.2%, below the generally expected figure of 50.1% and March’s reading of 50.3%. The average reading since 1948 is roughly 53.0% and any reading below 50% implies a contraction in the US manufacturing sector relative to the previous month.

“The US manufacturing sector dropped back into contraction after growing in March, the first time since September 2022 that the sector reported expansion,” said Timothy Fiore of the ISM Manufacturing Business Survey Committee. “Although demand improvement slowed, output remains positive and inputs stayed accommodative.”

The report came out on the same day as March JOLTS numbers and the announcement of no change at the FOMC’s May meeting and US Treasury yields fell on the day, with decline heaviest at the short end. By the close of business, the 2-year Treasury bond yield had shed 8bps to 4.96%, the 10-year yield had lost 5bps to 4.63% while the 30-year yield finished 4bps lower at 4.75%.

In terms of US Fed policy, expectations of a lower federal funds rate in the next 12 months firmed, with two 25bps cuts currently factored in. At the close of business, contracts implied the effective federal funds rate would average 5.305% in July, 2bps lower than the current spot rate, 5.225% in September and 5.11% in November. However, April 2025 contracts implied 4.785%, 54bps less than the current rate.

Purchasing managers’ indices (PMIs) are economic indicators derived from monthly surveys of executives in private-sector companies. They are diffusion indices, which means a reading of 50% represents no change from the previous period, while a reading under 50% implies respondents reported a deterioration on average. A reading “above 48.7%, over a period of time, generally indicates an expansion of the overall economy”, according to the ISM.    

The ISM’s manufacturing PMI figures appear to lead US GDP by several months despite a considerable error in any given month. The chart below shows US GDP on a “year on year” basis (and not the BEA annualised basis) against US GDP implied by monthly PMI figures. 

According to the ISM and its analysis of past relationships between the PMI and US GDP, April’s PMI corresponds to an annualised growth rate of 1.9%, or about 0.5% over a quarter. Regression analysis on a year-on-year basis suggests a 12-month GDP growth rate of 2.2% five months after this latest report.

The ISM index is one of two monthly US PMIs, the other being an index published by S&P Global. S&P Global produces a “flash” estimate in the last week of each month which comes out about a week before the ISM index is published. The S&P Global flash April manufacturing PMI registered 49.9%, down 2.0 percentage points from March’s final figure.

April Conf. Board sentiment index falls, back to long-term average

30 April 2024

Summary: Conference Board Consumer Confidence Index down in April, reading less than expected; consumers less positive about current labour market, more concerned about future business conditions, job availability, income; US Treasury yields increase; expectations of Fed rate cuts soften; confidence declined among consumers of all age groups, all income groups except for $25,000 to $49,999 bracket; views of present conditions, short-term outlook both deteriorate.

US consumer confidence clawed its way back to neutral over the five years after the GFC in 2008/2009 and then went from strength to strength until late 2018. Measures of consumer confidence then oscillated within a relatively narrow band at historically high levels until they plunged in early 2020. Subsequent readings then fluctuated around the long-term average until March 2021 when they returned to elevated levels. However, a noticeable gap has since emerged between the two most-widely followed surveys.

The latest Conference Board survey held during the first three weeks of April indicated US consumer confidence has deteriorated further. April’s Consumer Confidence Index registered 97.0 on a preliminary basis, well below the generally-expected figure of 104.1 and March’s final figure of 103.1 after it was revised from 104.7.

“Confidence retreated further in April, reaching its lowest level since July 2022 as consumers became less positive about the current labour market situation, and more concerned about future business conditions, job availability, and income,” said Dana Peterson, Chief Economist at The Conference Board. 

US Treasury yields increased uniformly across the curve on the day, propelled by higher-than-expected March quarter employment cost indices. By the close of business, 2-year, 10-year and 30-year Treasury bond yields had all gained 6bps to 5.04%, 4.68% and 4.79% respectively.

In terms of US Fed policy, expectations of a lower federal funds rate in the next 12 months softened, although almost two 25bps cuts are still currently factored in. At the close of business, contracts implied the effective federal funds rate would average 5.33% in May, in line with the current spot rate, 5.315% in June and 5.305% in July. However, April 2025 contracts implied 4.89%, 44bps less than the current rate.

“In the month, confidence declined among consumers of all age groups and almost all income groups except for the $25,000 to $49,999 bracket,” Peterson added. “Nonetheless, consumers under 35 continued to express greater confidence than those over 35.”

Consumers’ views of present conditions and their views of the near-future both deteriorated. The Present Situation Index decreased from March’s revised figure of 146.8 to 142.9 while the Expectations Index moved down from 74.0 to 66.4.

The Consumer Confidence Survey is one of two widely followed monthly US consumer sentiment surveys which produce sentiment indices. The Conference Board’s index is based on perceptions of current business and employment conditions, as well as respondents’ expectations of conditions six months in the future. The other survey, conducted by the University of Michigan, is similar and it is used to produce an Index of Consumer Sentiment. That survey differs in that it does not ask respondents explicitly about their views of the labour market and it also includes some longer-term questions.

March retail sales report “soft”; sales fall 0.4%

30 April 2024

Summary: Retail sales down 0.4% in March, contrasts with expected gain; up 0.8% on 12-month basis; Westpac: another soft update, consumer environment remains flat at best; ACGB yields fall; rate-change expectations somewhat mixed; ANZ: highlights current pressures facing retail sector as households limit spending in response to cost of living pressures; largest influence on result from clothing, food sales.

Growth figures of domestic retail sales spent most of the 2010s at levels below the post-1992 average. While economic conditions had been generally favourable, wage growth and inflation rates were low. Expenditures on goods then jumped in the early stages of 2020 as government restrictions severely altered households’ spending habits. Households mostly reverted to their usual patterns as restrictions eased in the latter part of 2020 and throughout 2021.

According to the latest ABS figures, total retail sales fell by 0.4% on a seasonally adjusted basis in March. The fall contrasted with the 0.2% increase which had been generally expected as well as  February’s 0.2% gain after it was revised down from 0.3%. Sales increased by 0.8% on an annual basis, down from 1.5% after revisions.

“Overall, this was another soft update indicating the consumer environment remains flat at best,” said Westpac senior economist Matthew Hassan. “Our recently released Westpac Card Tracker report suggests April has been on the weak side as well. All of these flat aggregate results imply a continued contraction in per capita terms.”

Commonwealth Government bond yields fell almost uniformly across the curve, outpacing the falls of US Treasury yields on Monday night. By the close of business, the 3-year ACGB yield had lost 7bps to 4.03%, the 10-year yield had shed 6bps to 4.44% while the 20-year yield finished 7bps lower at 4.70%.

In the cash futures market, expectations regarding rate changes later this year or in 2025 were somewhat mixed.  At the end of the day, contracts implied the cash rate would remain close to the current rate for the next few months and average 4.33% through May and 4.35% in June. However, November contracts implied a 4.40% average cash rate, February contracts implied 4.31%, while May 2025 contracts implied 4.22%, 10bps less than the current rate.

“This highlights the current pressures facing the retail sector as households limit spending in response to cost of living pressures,” said ANZ economist Madeline Dunk. “We think retail sales growth will pick up later in the year as consumer confidence improves and disposable incomes get a boost from the Stage 3 tax cuts.”

Retail sales are typically segmented into six categories (see below), with the “Food” segment accounting for 40% of total sales. However, the largest influences on the month’s total came from the “Clothing” segment where sales fell by 4.3%. “Food” sales had nearly as large an effect after sales rose by 0.9%.

Elevated interest rates, sluggish economy: private credit growth modest in March

30 April 2024

Private sector credit up 0.3% in March, less than expected; annual growth rate ticks up to 5.1%; Westpac: modest growth in environment of elevated interest rates, sluggish economy operating at high capacity; ACGB yields fall; rate-change expectations somewhat mixed; business segment accounts for 50% of net growth.

The pace of lending growth in the non-bank private sector by financial institutions in Australia followed a steady-but-gradual downtrend from late 2015 through to early 2020 before hitting what appears to be a nadir in March 2021. That downtrend ended later in that same year and annual growth rates shot up through 2022, peaking in September/October before easing through 2023.

According to the latest RBA figures, private sector credit increased by 0.3% in March. The result was less than the 0.4% increase which had been generally expected as well as February’s 0.5% rise. On an annual basis, the growth rate ticked up from February’s figure of 5.0% to 5.1%.

“This modest growth occurred in an environment of elevated interest rates and a sluggish economy but also an economy operating at a high level of capacity, with unemployment still near historic lows and a housing market where demand is outstripping limited supply,” said Westpac senior economist Matthew Hassan.

Commonwealth Government bond yields fell almost uniformly across the curve, outpacing the falls of US Treasury yields on Monday night. By the close of business, the 3-year ACGB yield had lost 7bps to 4.03%, the 10-year yield had shed 6bps to 4.44% while the 20-year yield finished 7bps lower at 4.70%.

In the cash futures market, expectations regarding rate changes later this year or in 2025 were somewhat mixed.  At the end of the day, contracts implied the cash rate would remain close to the current rate for the next few months and average 4.33% through May and 4.35% in June. However, November contracts implied a 4.40% average cash rate, February contracts implied 4.31%, while May 2025 contracts implied 4.22%, 10bps less than the current rate.

Business lending each accounted for just under 50% of the net growth over the month while owner-occupier lending accounted for around 25%. Investor lending accounted for around 10% while personal lending accounted for the balance.    

The traditional driver of overall loan growth, the owner-occupier segment, grew by 0.4% over the month, in line with the previous seven months. The sector’s 12-month growth rate increased from 4.8% to 5.0%.

Total lending in the non-financial business sector increased by 0.5%, down from 0.6% in February after revisions. Growth on an annual basis picked up from 6.8% to 7.0%.

Monthly growth in the investor-lending segment slowed to a near-halt in early 2018 and essentially stayed that way until mid-2021. In March, net lending rose by 0.3%, up from 0.2% in February, maintaining the 12-month growth rate at 3.0%.

Total personal loans increased by 0.3%, in line with February’s growth rate, while the annual growth rate increased from 2.4% to 2.9%. This category of debt includes fixed-term loans for large personal expenditures, credit cards and other revolving credit facilities.

No progress on core PCE prices, unchanged at 2.8% in March

26 April 2024

Summary: US core PCE price index up 0.3% in March, in line with expectations; annual rate unchanged at 2.8%; Treasury yields rise; Fed rate-cut expectations soften.

One of the US Fed’s favoured measures of inflation is the change in the core personal consumption expenditures (PCE) price index. After hitting the Fed’s target at the time of 2.0% in mid-2018, the annual rate then hovered in a range between 1.8% and 2.0% before it eased back to a range between 1.5% and 1.8% through 2019. It then plummeted below 1.0% in April 2020 before rising back to around 1.5% in the September quarter of that year. It has since increased significantly and still remains above the Fed’s target even after recent declines.

The latest figures have now been published by the Bureau of Economic Analysis as part of the March personal income and expenditures report. Core PCE prices rose by 0.3% over the month, in line with expectations as well as February’s 0.3% increase. On a 12-month basis, the core PCE inflation rate remained steady at 2.8%.

US Treasury bond yields generally rose on the day. By the close of business, 2-year and 10-year Treasury bond yields had both gained 6bps to 4.99% and 4.70% respectively while the 30-year yield finished 4bps higher at 4.81%.

In terms of US Fed policy, expectations of a lower federal funds rate in the next 12 months softened, although at least two 25bps cuts are still currently factored in. At the close of business, contracts implied the effective federal funds rate would average 5.32% in May, just below the current spot rate, 5.31% in June and 5.30% in July. However, April 2025 contracts implied 4.83%, 50bps less than the current rate.

The core version of PCE strips out energy and food components, which are volatile from month to month, in an attempt to identify the prevailing trend. It is not the only measure of inflation used by the Fed; the Fed also tracks the Consumer Price Index (CPI) and the Producer Price Index (PPI) from the Department of Labor. However, it is the one measure which is most often referred to in FOMC minutes.

US March quarter GDP growth misses expectations; GDP deflator of “particular interest”

25 April 2024

Summary: US GDP up 0.4% (1.6% annualised) in March quarter, below expectations; ANZ: GDP price index  accelerates to 3.1% (annualised), of particular interest to markets; US Treasury yields rise; rate-cut expectations soften; GDP price deflator rate slows from 2.6% to 2.4%.

US GDP growth slowed in the second quarter of 2019 before stabilising at about 0.5% per quarter.  At the same time, US bond yields suggested future growth rates would be below trend. The US Fed agreed and it reduced its federal funds range three times in the second half of 2019. Pandemic restrictions in the June quarter of 2020 sent parts of the US economy into hibernation; the lifting of those same restrictions sparked a rapid recovery which lasted until 2022.

The US Bureau of Economic Analysis has now released the March quarter’s advance GDP estimates and they indicate the US economy expanded by 0.4% or at an annualised rate of 1.6%. The result was less than the 0.6% increase (2.3% annualised) which had been generally expected as well as the December quarter’s 0.8% rise.

“The US GDP data showed the economy grew below its potential growth rate in Q1, which the CBO estimates at 2.2%, suggesting pipeline inflation pressures are waning,” said ANZ Head of FX Research Mahjabeen Zama. “However, of particular interest to the market was the GDP price index which accelerated to 3.1% (annualised) from 1.6% in Q4.”

US GDP numbers are published in a manner which is different to most other countries; quarterly figures are compounded to give an annualised figure. In countries such as Australia and the UK, an annual figure is calculated by taking the latest number and comparing it with the figure from the same period in the previous year. The diagram above shows US GDP once it has been expressed in the normal manner, as well as the annualised figure.

US Treasury bond yields rose moderately across the curve on the day despite the lower-than-expected figures. By the close of business, 2-year and 10-year Treasury bond yields had both gained 6bps to 4.99% and 4.70% respectively while the 30-year yield finished 4bps higher at 4.81%.

In terms of US Fed policy, expectations of a lower federal funds rate in the next 12 months softened, although at least two 25bps cuts are still currently factored in. At the close of business, contracts implied the effective federal funds rate would average 5.32% in May, just below the current spot rate, 5.305% in June and 5.30% in July. However, April 2025 contracts implied 4.815%, 51bps less than the current rate.

One part of the report which is often overlooked are the figures regarding the GDP price deflator, which is another measure of inflation. The GDP price deflator is restricted to new, domestically-produced goods and services and it is not based on a fixed basket as is the case for the consumer price index (CPI). The annual rate slowed again, this time from 2.6% to 2.4%.

German economy “stabilising”; April ifo index rises for third consecutive month

24 April 2024

ifo business climate index rises in April, slightly above expected figure; German economy is stabilizing, especially thanks to service providers.”; current conditions index up, expectations index up; German, French 10-year yields up noticeably; expectations index implies euro-zone GDP contraction of 0.5% in year to July.

Following recessions in euro-zone economies in 2009/2010, the ifo Institute’s Business Climate Index largely ignored the European debt-crisis of 2010-2012, mostly posting average-to-elevated readings through to early-2020. However, the index was quick to react in the March 2020 survey, falling precipitously before recovering quickly in subsequent months. Readings through much of 2021 generally fluctuated around the long-term average before dropping away in 2022.

According to the latest report released by ifo, German business sentiment improved for a third  consecutive month. April’s Business Climate Index posted a reading of 89.4, slightly above the generally expected figure of 89.0 as well as March’s final reading of 87.9. The average reading since January 2005 is just over 96.

“Companies were more satisfied with their current business,” said Clemens Fuest, President of the ifo Institute. “Their expectations also brightened. The economy is stabilising, especially thanks to service providers.”

German firms’ views of current conditions and their collective outlook both improved. The current situation index increased from March’s figure of 88.1 to 88.9 while the expectations index increased from 87.7 after revisions to 89.9.

German and French long-term bond yields finished noticeably higher on the day. By the close of business, German and French 10-year yields had both gained 8bps to 2.59% and 3.09% respectively.

The ifo Institute’s business climate index is a composite index which combines German companies’ views of current conditions with their outlook for the next six months. It has similarities to consumer sentiment indices in the US such as the ones produced by The Conference Board and the University of Michigan.

It also displays a solid correlation with euro-zone GDP growth rates. However, the expectations index is a better predictor as it has a higher correlation when lagged by one quarter. April’s expectations index implies a 0.5% year-on-year GDP contraction to the end of July.  

US leading index splutters along; points to “fragile” outlook for US economy

18 April 2024

Summary: Conference Board leading index down 0.3% in March, worse than expected; change driven by multiple activity parameters; US Treasury yields rise; rate-cut expectations soften; points to fragile outlook for the U.S. economy; regression analysis implies 0.8% contraction in year to June.

The Conference Board Leading Economic Index (LEI) is a composite index composed of ten sub-indices which are thought to be sensitive to changes in the US economy. The Conference Board describes it as an index which attempts to signal growth peaks and troughs; turning points in the index have historically occurred prior to changes in aggregate economic activity. Readings from March and April of 2020 signalled “a deep US recession” while subsequent readings indicated the US economy would recover rapidly. More recent readings have implied US GDP growth rates would turn negative in the first half of 2024.

The latest reading of the LEI indicates it decreased by 0.3% in March. The fall was slightly worse than the 0.1% decline which had been generally expected an in contrast with February’s revised figure of 0.2%.

“Negative contributions from the yield spread, new building permits, consumers’ outlook on business conditions, new orders, and initial unemployment insurance claims drove March’s decline,” said Justyna Zabinska-La Monica of The Conference Board.

US Treasury bond yields rose moderately across the curve on the day. By the close of business, the 2-year Treasury yield had gained 6bps to 4.99%, the 10-year yield had added 4bps to 4.63% while the 30-year yield finished 3bp higher at 4.73%.

In terms of US Fed policy, expectations of a lower federal funds rate in the next 12 months softened, although at least two 25bps cuts are still currently factored in. At the close of business, contracts implied the effective federal funds rate would average 5.325% in May, essentially in line with the current spot rate, 5.30% in June and 5.285% in July. However, April 2025 contracts implied 4.775%, 55bps less than the current rate.

“Overall, the Index points to a fragile, even if not recessionary, outlook for the U.S. economy,” added Zabinska-La Monica. “Indeed, rising consumer debt, elevated interest rates and persistent inflation pressures continue to pose risks to economic activity in 2024. The Conference Board forecasts GDP growth to cool after the rapid expansion in the second half of 2023. As consumer spending slows, US GDP growth is expected to moderate over Q2 and Q3 of this year.”

The Conference Board had previously forecast negative GDP growth in the June and September quarters of 2024. Regression analysis suggests the latest reading implies a -0.8% year-on-year growth rate in June, unchanged from the year to May growth rate.

Click for more news