News

US producer prices less than expected in Dec; “little concern” over sticky inflation

14 January 2025

Summary: US producer price index (PPI) up 0.2% in December, less than expected; annual rate rises to 3.3%; “core” PPI flat over month, up 3.5% over year; Citi: suggest little concern over sticky or reaccelerating inflation; US Treasury yields decline; rate-cut expectations firm; goods prices up 0.6%, services prices flat; Citi: stronger airfares in PPI leads to modest increase in Dec CPI forecast.

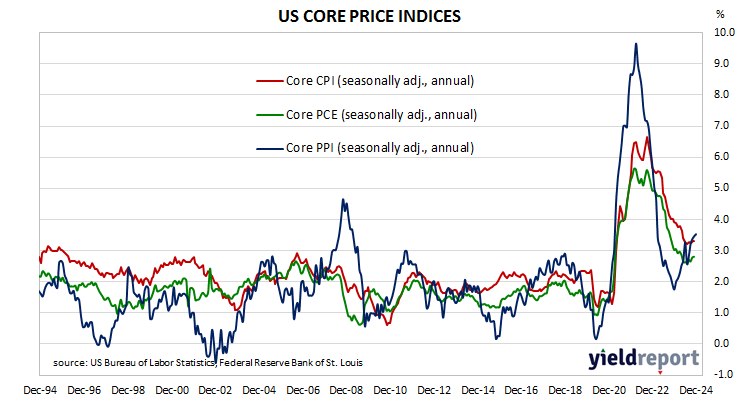
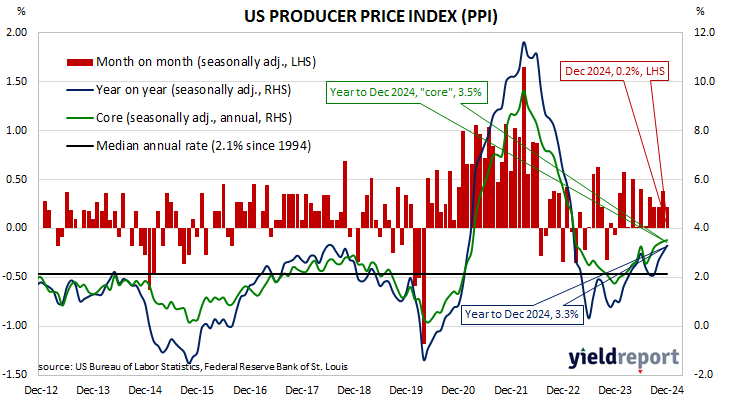
Around the end of 2018, the annual inflation rate of the US producer price index (PPI) began a downtrend which continued through 2019. Months in which producer prices increased suggested the trend may have been coming to an end, only for it to continue, culminating in a plunge in April 2020. Figures returned to “normal” towards the end of that year but then moved well above the long-term average in 2021 and 2022 before falling back over 2023.

The latest figures published by the Bureau of Labor Statistics indicate producer prices increased by 0.2% in December after seasonal adjustments. The rise was less than the 0.4% increase which had been generally expected as well as November’s increase of the same amount. However, on a 12-month basis, the rate of producer price inflation after seasonal adjustments accelerated from 3.0% to 3.3%.

Producer prices excluding foods and energy, or “core” PPI, remained steady after seasonal adjustments. The flat result was less than the expected 0.3% rise as well as November’s 0.2% increase. The annual growth rate remained steady at 3.5%.

“Flat core goods prices and a decline in core services suggest little concern over sticky or reaccelerating inflation,” said Citi Research economist Veronica Clark.

US Treasury bond yields declined across a slightly steeper curve on the day. By the close of business, the 2-year Treasury yield had lost 4bps to 4.36%, the 10-year had slipped 2bps to 4.78% while the 30-year yield finished 1bp lower at 4.97%.

In terms of US Fed policy, expectations of a lower federal funds rate in the next 12 months firmed, although another 25bp cut is still currently priced in. At the close of business, contracts implied the effective federal funds rate would average 4.325% in February, 4.305% in March and 4.275% in April. December contracts implied 4.065%, 27bps less than the current rate.

The BLS stated about 60% of the rise of the index was attributable to a 0.6% increase in goods prices. The final demand services index remained steady.

“A much weaker than expected increase in portfolio management fees offset a substantial increase in airfares,” Clark added. “While not always correlated month-to-month, stronger airfares in PPI did lead us to modestly increase in our forecast for this component in December CPI tomorrow to 0.24%.”

The producer price index is a measure of prices received by producers for domestically produced goods, services and construction. It is put together in a fashion similar to the consumer price index (CPI) except it measures prices received from the producer’s perspective rather than from the perspective of a retailer or a consumer. It is another one of the various measures of inflation tracked by the US Fed, along with core personal consumption expenditure (PCE) price data. 

AUD an issue for households; consumer confidence slides in Jan

14 January 2025

Summary: Westpac-Melbourne Institute consumer sentiment index declines in January; Westpac: the two sub-indexes tracking current conditions decline, forward-looking ones either flat or increasing; ACGB yields decline; rate-cut expectations firm; Westpac: possible consumers reacting to news about AUD depreciation; just one of five sub-indices falls; more respondents expecting higher jobless rate.

After a lengthy divergence between measures of consumer sentiment and business confidence in Australia which began in 2014, confidence readings of the two sectors converged again in mid-July 2018. Both measures then deteriorated gradually in trend terms, with consumer confidence leading the way. Household sentiment fell off a cliff in April 2020 but, after a few months of to-ing and fro-ing, it then staged a full recovery. However, consumer sentiment then weakened considerably and languished at pessimistic levels from mid-2022 while business sentiment generally remained at more robust levels.

According to the latest Westpac-Melbourne Institute survey conducted in the early part of January, household sentiment has deteriorated moderately and is at a level which is somewhat on the pessimistic side. Their Consumer Sentiment Index declined from December’s reading of 92.8 to 92.1, a reading which is noticeably lower than the long-term average reading of just over 101.

“In January, the two sub-indexes tracking current conditions declined while the forward-looking ones were flat or increasing, a reversal of the pattern in December,” said Westpac chief economist Luci Ellis. 

Any reading of the Consumer Sentiment Index below 100 indicates the number of consumers who are pessimistic is greater than the number of consumers who are optimistic.

Commonwealth Government bond yields declined modestly across the curve on the day. By the close of business, 3-year and 10-year ACGB yields had both lost 2bps to 4.04% and 4.65% respectively while the 20-year yield finished 1bp lower at 5.03%.

Expectations regarding rate cuts in the next twelve months firmed, with a February cut now viewed as a good chance. Cash futures contracts implied an average of 4.27% in February, 4.03% in May and 3.85% in August. December contracts implied 3.72%, 62bps less than the current cash rate.

“As well as the ongoing unsettled global backdrop, it is possible that consumers were reacting to news about the depreciation of the Australian dollar against the US dollar, which resulted in some negative headlines about the outlook for interest rates and the broader economy,” Ellis added.

Only one of the five sub-indices registered a lower reading, with the “Family finances versus a year ago” sub-index again posting the sole monthly loss.  

The Unemployment Expectations index, formerly a useful guide to RBA rate changes, rose from 123.7 to 127.2, slightly below the long-term average of 129.1. Higher readings result from more respondents expecting a higher unemployment rate in the year ahead.

First quarterly rise since 2022; job ads index rises in Dec

13 January 2025

Summary:  Job ads rise 0.3% in December; 12.4% lower than December 2023; ANZ: first quarterly rise since Q3 2022; ACGB yields rise; rate-cut expectations soften; Indeed: growth in WA, SA, Qld offsets declines in NSW, Vic; ad index-to-workforce ratio unchanged.


From mid-2017 onwards, year-on-year growth rates in the total number of Australian job advertisements consistently exceeded 10%. That was until mid-2018 when the annual growth rate fell back markedly. 2019 was notable for its reduced employment advertising and this trend continued into the first quarter of 2020. Advertising then plunged in April and May of 2020 as pandemic restrictions took effect but recovered quite quickly, reaching historically-high levels in 2022.

According to the latest reading of the ANZ-Indeed Job Ads Index, total job advertisements in December increased by 0.3% on a seasonally adjusted basis. Their index rose from 114.4 in November after revisions to 114.7, with the gain following a 1.7% decline in November and a 0.6% rise in October. On a 12-month basis, total job advertisements were 12.4% lower than in December 2023, down from November’s revised figure of -12.2%.

“ANZ-Indeed Australian Job Ads steadied in late 2024, with the series rising 0.5% in Q4, the first quarterly rise since Q3 2022,” said ANZ economist Madeline Dunk. “This follows a cumulative decline of 13.8% over the first three quarters of the year.”

Short-term Australian Commonwealth Government bond yields jumped on the day while longer-term yields rose more moderately, somewhat in line with movements of US Treasury yields on Friday night. By the close of business, the 3-year ACGB yield had gained 13bps to 4.06%, the 10-year yield had added 9bps to 4.67% while the 20-year yield finished 4bps higher at 5.04%.

Expectations regarding rate cuts in the next twelve months softened, although a February cut is still currently viewed as a solid chance with at least one additional 25bp cut to follow. Cash futures contracts implied an average of 4.275% in February, 4.035% in May and 3.855% in August. December contracts implied 3.73%, 61bps less than the current cash rate.

“In December, growth in Western Australia, South Australia and Queensland offset declines in New South Wales and Victoria, leading to modest growth nationally,” said Indeed senior economist Callam Pickering. “We continue to have a bit of a two-speed job market with the decline in Job Ads for New South Wales and Victoria far exceeding those in other states and territories.”

The inverse relationship between job advertisements and the unemployment rate or the underemployment rate has been quite strong (see below chart), although ANZ themselves called the relationship between the series into question in early 2019. 

A higher job advertisement index as a proportion of the labour force is suggestive of lower unemployment rates in the near future while a lower ratio suggests higher unemployment rates will follow. December’s ad index-to-workforce ratio remained unchanged at 0.76.

In 2008/2009, advertisements plummeted and Australia’s unemployment rate jumped from 4% to nearly 6% over a period of 15 months. When a more dramatic fall in advertisements took place in April 2020, the unemployment rate responded much more quickly.

Inflation Gauge jumps in December, up 0.6%

13 January 2025

Summary: Melbourne Institute Inflation Gauge index up 0.6% in December; up 2.6% on annual basis; ACGB yields rise; rate-cut expectations soften.


The Melbourne Institute’s Inflation Gauge is an attempt to replicate the ABS consumer price index (CPI) on a monthly basis. It has turned out to be a reliable leading indicator of the CPI, although there are periods in which the Inflation Gauge and the CPI have diverged for as long as twelve months. On average, the Inflation Gauge’s annual rate tends to overestimate the ABS rate by around 0.1%, or at least until recently.

The Melbourne Institute’s latest reading of its Inflation Gauge index indicates consumer prices increased by 0.6% in December, up from 0.2% in November and October’s 0.3%. However, inflation on an annual basis still slowed from 2.9% to 2.6%.

Short-term Australian Commonwealth Government bond yields jumped on the day while longer-term yields rose more moderately, somewhat in line with movements of US Treasury yields on Friday night. By the close of business, the 3-year ACGB yield had gained 13bps to 4.06%, the 10-year yield had added 9bps to 4.67% while the 20-year yield finished 4bps higher at 5.04%.

Expectations regarding rate cuts in the next twelve months softened, although a February cut is still currently viewed as a solid chance with at least one additional 25bp cut to follow. Cash futures contracts implied an average of 4.275% in February, 4.035% in May and 3.855% in August. December contracts implied 3.73%, 61bps less than the current cash rate.

Given the Inflation Gauge’s tendency to overestimate, the latest figures imply an official CPI reading of 0.4% (seasonally adjusted) for the December quarter or 2.5% in annual terms. However, it is worth noting the annual CPI rate to the end of March 2023 was 7.0% while the Inflation Gauge had implied a 5.7% annual rate at the time.

US job market softening in doubt; December NFP beats estimates

10 January 2025

Summary: US non-farm payrolls up 256,000 in December, above expectations; previous two months’ figures revised down by 8,000; jobless rate ticks down to 4.1%, participation rate steady at 62.5%; Westpac: Dec quarter increase in payrolls exceeds Sep, June quarters; US Treasury yields rise; expectations of Fed rate cuts soften; ANZ: labour market weakness previously expected has not materialised; employed-to-population ratio rises to 60.0%; underutilisation rate falls to 7.5%; annual hourly pay growth slows to 3.9%.

The US economy ceased producing jobs in net terms as infection controls began to be implemented in March 2020. The unemployment rate had been around 3.5% but that changed as job losses began to surge through March and April of 2020. The May 2020 non-farm employment report represented a turning point and subsequent months provided substantial employment gains which have continued to the present.

According to the US Bureau of Labor Statistics, the US economy created an additional 256,000 jobs in the non-farm sector in December. The increase was greater than the 165,000 rise which had been generally expected as well as the 212,000 jobs which had been added in November after revisions. Employment figures for October and November were revised down by a total of 8,000.

The total number of unemployed decreased by 235,000 to 6.886 million while the total number of people who were either employed or looking for work increased by 243,000 to 168.547 million. These changes led to the US unemployment rate ticking down from 4.2% in November to 4.1%. The participation rate remained unchanged at 62.5%.

“Some volatility and catch-up are almost certainly at play given weather-related events through the December quarter,” said Westpac economist Jameson Coombs. “That said, payrolls averaged 170,000 per month through the quarter, up from almost 160,000 in the September quarter and near 150,000 in the June quarter. The trend suggesting a stabilisation and possible re-firming in labour market conditions over the back half of 2024.”

Short-term US Treasury bond yields jumped on the day while longer-term yields rose by more moderate amounts. By the close of business, the 2-year yield had gained 12bps to 4.38%, the 10-year yield had added 7bps to 4.76% while the 30-year yield finished 2bps higher at 4.95%.

In terms of US Fed policy, expectations of a lower federal funds rate in the next 12 months softened, although another 25bp cut is still currently priced in. At the close of business, contracts implied the effective federal funds rate would average 4.32% in February, 4.30% in March and 4.265% in April. December 2025 contracts implied 4.065%, 27bps less than the current rate.

“When the Fed cut rates [by] 50bps in September, it feared the labour market could be on the cusp of weakening in an accelerating fashion,” ANZ FX analyst Felix Ryan observed. “That has not materialised and current strength in service sector activity suggests it is unlikely to anytime soon. The labour market is signalling that the FOMC can be patient in its considerations over the future path of policy.”

One figure which is indicative of the spare capacity of the US employment market is the employment-to-population ratio. This ratio is simply the number of people in work divided by the total US population. It hit a cyclical-low of 58.2 in October 2010 before slowly recovering to just above 61% in early 2020. December’s reading rose 0.2 percentage points to 60.0%, still considerably below the April 2000 peak reading of 64.7%.

Another measure of tightness in the labour market is the underutilisation rate, which declined from 7.7% to 7.5% in November. Wage inflation and the underutilisation rate have an inverse relationship over time but not necessarily from month to month. Private hourly pay growth in the year to December slipped from 4.0% to 3.9%.

Consumer spending recovering; November retail spending up 0.8%

09 January 2025

Summary: Retail sales up 0.8% in November, less than expected; up 3.0% on 12-month basis; ANZ: figures affirm consumer spending growth is recovering; ACGB yields generally decline; rate-cut expectations firm; Westpac: retail spending looks to be on solid footing in Q4 so far; largest influence on result from restaurants/cafes.


Growth figures of domestic retail sales spent most of the 2010s at levels below the post-1992 average. While economic conditions had been generally favourable, wage growth and inflation rates were low. Expenditures on goods then jumped in the early stages of 2020 as government restrictions severely altered households’ spending habits. Households mostly reverted to their usual patterns as restrictions eased in the latter part of 2020 and throughout 2021.

According to the latest ABS figures, total retail sales increased by 0.8% on a seasonally adjusted basis in November. The result was less than the 1.0% increase which had been generally expected but up from October’s 0.5% rise after revisions. Sales increased by 3.0% on an annual basis, down from October’s comparable figure of 3.5%.

“Today’s retail print is unlikely to have a material impact on the RBA’s decision in February,” said ANZ economist Aaron Luk. “The data affirm that consumer spending growth is recovering, as the RBA has been expecting. The pick-up in household disposable income, including from cost-of-living relief, tax cuts and easing inflation will continue to support household consumption growth in 2025.”

Australian Commonwealth Government bond yields generally declined on the day, although ultra-long-term yields rose a touch. By the close of business, 3-year and 10-year ACGB yields both lost 2bps to 3.89% and 4.52% respectively while the 20-year yield finished 1bp higher at 4.95%.

Expectations regarding rate cuts in the next twelve months firmed, with a February cut currently viewed as a solid chance and two additional 25bp cuts to follow. Cash futures contracts implied an average of 4.27% in February, 3.965% in May and 3.735% in August. December contracts implied 3.585%, 75bps less than the current cash rate.

“Retail spending looks to be on solid footing in Q4 so far and given the late-November timing of the Black Friday sales this year, today’s result could also be an underestimate as the same months in previous years will be capturing the full boost from this event,” said Westpac economist Nema Sharma.

Retail sales are typically segmented into six categories, with the “Food” segment accounting for 40% of total sales. However, the largest influence on the month’s total came from the “Cafes and restaurants” segment where sales rose by 1.5%.

Euro broad sentiment indicator falls in December

08 January 2025

Summary: Euro-zone composite sentiment indicator down in December, below expectations; German, French 10-year yields rise; readings down in three of five sectors; down in three of four largest euro-zone economies; index implies annual GDP growth rate of 0.2%.

The European Commission’s Economic Sentiment Indicator (ESI) is a composite index comprising five differently weighted sectoral confidence indicators.  It is heavily weighted towards confidence surveys from the business sector, with the consumer confidence sub-index only accounting for 20% of the ESI. However, it has a good relationship with euro-zone GDP growth rates, although not necessarily as a leading indicator.

According to the latest survey taken by the European Commission, confidence has deteriorated on average across the various sectors of the euro-zone economy in December. The ESI posted a reading of 93.7, below expectations and November’s revised reading of 95.6. The average reading since 1985 is just under 100.

Long-term German and French 10-year bond yields moved noticeably lower on the day. By the close of business, the German 10-year yield had gained 3bps to 2.52% while the French 10-year yield finished 6bps higher at 3.36%.

Confidence deteriorated in three of the five sectors of the euro-zone economy. On a geographical basis, the ESI decreased in three of four of the euro-zone’s largest economies.

End-of-quarter ESI readings and annual euro-zone GDP growth rates are highly correlated. This latest reading corresponds to a year-to-December GDP growth rate of 0.2%, down from November’s implied growth rate of 0.6%.

November JOLTS report sends US bond yields higher

07 January 2025

Summary: US quit rate falls back in November; US Treasury yields rise; expectations of Fed rate cuts soften; fewer quits, more openings, fewer separations.

The number of US employees who quit their jobs as a percentage of total employment increased slowly but steadily after the GFC. It peaked in March 2019 and then tracked sideways until virus containment measures were introduced in March 2020. The quit rate then plummeted as alternative employment opportunities rapidly dried up. Following the easing of US pandemic restrictions, it proceeded to recover back to its pre-pandemic rate in the third quarter of 2020 and trended higher through 2021 before easing through 2022, 2023 and 2024.

Figures released as part of the latest Job Openings and Labor Turnover Survey (JOLTS) show the quit rate dropped in November after revisions. 1.9% of the non-farm workforce left their jobs voluntarily, down from 2.1% in October. Quits in the month increased by 218,000 while an additional 227,000 people were employed in non-farm sectors.

US Treasury bond yields rose almost uniformly across the curve on the day. By the close of business, the 2-year Treasury bond yield had gained 6bps to 4.30% while 10-year and 30-year yields both finished 7bps higher at 4.69% and 4.92% respectively.

In terms of US Fed policy, expectations of a lower federal funds rate in the next 12 months softened, although  another 25bp cut is still fully priced in. At the close of business, contracts implied the effective federal funds rate would average 4.315% in February, 4.285% in March and 4.23% in April. December 2025 contracts implied 3.96%, 37bps less than the current rate.

The fall in total quits was led by 85,000 fewer resignations in the “Accommodation and food services” sector, the sector which led October’s rise, while the “Transportation, warehousing and utilities” sector experienced the largest increase, 26,000. Overall, the total number of quits for the month decreased from October’s revised figure of 3.283 million to 3.065 million.                

Total vacancies at the end of November increased by 259,000, or 3.3%, from October’s revised figure of 7.839 million to 8.098 million. The increase was driven by 273,000 more open positions in the “Professional and business services” sector, while the “Accommodation and food services” sector experienced 102,000 fewer offerings, the largest decline by sector. Overall, 10 out of 18 sectors experienced more job openings than in the previous month.

Total separations decreased by 180,000, or 3.4%, from October’s revised figure of 5.306 million to 5.126 million. The fall was led by the “Professional and business services” sector where there were 60,000 fewer separations while the “Accommodation and food services” sector experienced 34,000 more separations. Separations increased in 12 of the 18 sectors.

The “quit” rate time series produced by the JOLTS report is a leading indicator of US hourly pay. As wages account for around 55% of a product’s or service’s price in the US, wage inflation and overall inflation rates tend to be closely related. Former Federal Reserve chief and current Treasury Secretary Janet Yellen was known to pay close attention to it.

“Mildly disappointing” November home approvals coming off 75-year lows

07 January 2025

Summary: Home approval numbers down 3.6% in November, fall greater than expected; 3.2% higher than November 2023; Westpac: report mildly disappointing; ACGB yields rise modestly; rate-cut expectations soften; Westpac: 1.5% rate of additions to dwelling stock coming off 75-year lows; house approvals down 2.2%, apartments down 5.6%; non-residential approvals up 18.4% in dollar terms, residential alterations up 0.3%.

Building approvals for dwellings, that is apartments and houses, headed south after mid-2018. As an indicator of investor confidence, falling approvals had presented a worrying signal, not just for the building sector but for the overall economy. However, approval figures from late-2019 and the early months of 2020 painted a picture of a recovery taking place, even as late as April of that year. Subsequent months’ figures then trended sharply upwards before falling back through 2021, 2022 and 2023.

The Australian Bureau of Statistics has released the latest figures for November and they indicate total residential approvals decreased by 3.6% over the month on a seasonally-adjusted basis. The fall was a greater one the 1.0% decline which had been generally expected and in contrast with October’s 5.2% rise after revisions. Total approvals rose by 3.2% on an annual basis, down from the previous month’s revised figure of 6.8%. Monthly growth rates are often volatile.

“Overall, the November batch of approvals data was mildly disappointing, casting doubt on the modest upturn that formed through most of 2024,” said Westpac senior economist Matthew Hassan.

Commonwealth Government bond yields rose modestly across the curve on the day. By the close of business, the 3-year ACGB yield had gained 2bps to 3.93% while 10-year and 20-year yields both finished 1bp higher at 4.51% and 4.90% respectively.

Expectations regarding rate cuts in the next twelve months softened slightly, although a February cut is still currently viewed as a solid chance. Cash futures contracts implied an average of 4.275% in February, 3.98% in May and 3.78% in August. December contracts implied 3.63%, 71bps less than the current cash rate.

“Annual growth is holding in the 5-6% range, a solid but unspectacular lift from what was a very low starting point; the 164,000 dwellings approved over the twelve months to June 2024 compares to a 10-year average of 203,000 and a 20-year average of 185,000, “Hassan added. “At just 1.5% of existing dwellings, the rate of additions to the dwelling stock is coming off 75-year lows.”

Approvals for new houses decreased by 2.2% over the month, up from October’s 3.8% fall after revisions. On a 12-month basis, house approvals were 4.0% higher than they were in November 2023, slightly lower than the previous month’s comparable figure of 4.1%.                                        

Apartment approval figures are usually a lot more volatile and November’s approvals for this category fell by 5.6%, in contrast with October’s 22.3% rise. The 12-month growth rate slowed from October’s revised rate of 11.2% to 2.0%.

Non-residential approvals rose by 18.4% in dollar terms over the month and by 19.1% on an annual basis. Figures in this segment also tend to be rather volatile.

Residential alteration approvals rose by 0.3% in dollar terms over the month and were 5.9% higher than in November 2023.

US manufacturing contraction easing; ISM PMI up in December

03 January 2025

Summary: ISM manufacturing PMI up in December, above expectations; ISM: US manufacturing contracts for past nine consecutive months; short-term US Treasury yields decline, longer-term yields rise; expectations of Fed rate cuts soften; ISM: reading corresponds to 1.9% US GDP growth annualised.

The Institute of Supply Management (ISM) manufacturing Purchasing Managers Index (PMI) reached a cyclical peak in September 2017. It then started a downtrend which ended in March 2020 with a contraction in US manufacturing which lasted until June 2020. Subsequent month’s readings implied growth had resumed, with the index becoming stronger through to March 2021. Readings then declined fairly steadily until mid-2023 and have since generally stagnated at contractionary levels.

According to the ISM’s December survey, its manufacturing PMI recorded a reading of 49.3%, above the generally expected figure of 48.2% and November’s reading of 48.4. The average reading since 1948 is roughly 53.0% and any reading below 50% implies a contraction in the US manufacturing sector relative to the previous month.

“After breaking a 16-month streak of contraction by expanding in March, the manufacturing sector has contracted for the last nine months,” said Timothy Fiore of the ISM Manufacturing Business Survey Committee. 

Short-term US Treasury bond yields slipped on the day while longer-term yields rose. By the close of business, the 2-year Treasury bond yield had declined 1bp to 4.24%, the 10-year yield had gained 4bps to 4.60% while the 30-year yield finished 2bps higher at 4.81%.

In terms of US Fed policy, expectations of a lower federal funds rate in the next 12 months softened, although  another 25bp cut is still fully priced in. At the close of business, At the close of business, contracts implied the effective federal funds rate would average 4.405% in February, 4.37% in March and 4.20% in April. December 2025 contracts implied 3.945%, 38ps less than the current rate.

Purchasing managers’ indices (PMIs) are economic indicators derived from monthly surveys of executives in private-sector companies. They are diffusion indices, which means a reading of 50% represents no change from the previous period, while a reading under 50% implies respondents reported a deterioration on average. A reading “above 42.5%, over a period of time, generally indicates an expansion of the overall economy” according to the ISM’s most-recent estimate.            

The ISM’s manufacturing PMI figures appear to lead US GDP by several months despite a considerable error in any given month. The chart below shows US GDP on a “year on year” basis (and not the BEA annualised basis) against US GDP implied by monthly PMI figures. 


According to the ISM and its analysis of past relationships between the PMI and US GDP, December’s PMI corresponds to an annualised growth rate of 1.9%, or about 0.5% over a quarter. Regression analysis on a year-on-year basis suggests a 12-month GDP growth rate of 2.3% five months after this latest report.

The ISM index is one of two monthly US PMIs, the other being an index published by S&P Global. S&P Global produces a “flash” estimate in the last week of each month which comes out about a week before the ISM index is published. The S&P Global December flash manufacturing PMI registered 48.3%, down 1.4 percentage points from November’s final figure.

Click for more news