17 May 2017
Australia, as with most, if not all, of the developed economies, is in a low inflation environment. Wage inflation is playing its part well. So well in fact, wages in the private sector have failed to keep up with consumer inflation over the past year.
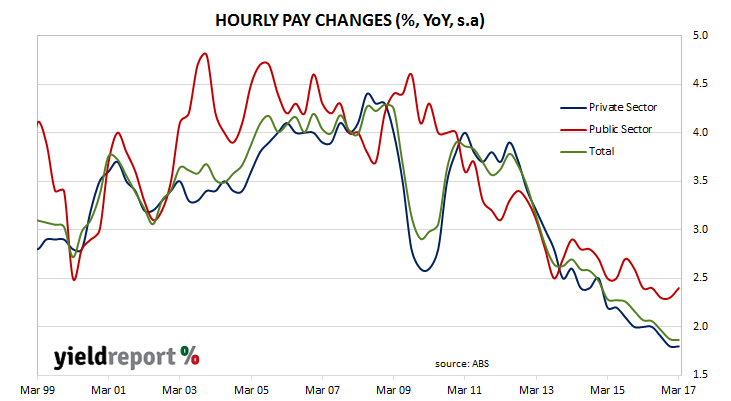
According to the latest March quarter figures published by the Australian Bureau of Statistics (ABS), hourly wages grew by 0.5% in the March quarter, up from the revised December figure of 0.4% and in line with market expectations. Year-on-year growth was steady at 1.9% (after revisions) and still at a record low. The annual growth rate is now less than the annual consumer inflation figures for the March quarter.
Public sector hourly wages growth continued the trend of the last two decades and grew faster than the private sector; wages grew by 2.4% in the year to March, up from 2.3% in the December quarter. Private sector wages grew by 1.8% over the las t 12 months which is the same rate as in the December quarter. However, the consumer price index (CPI) grew by 2.1% over the same period.
Westpac’s senior economist Justin Smirk does not see much to which employees can look forward to. “We have found that the sectors that are growing the fastest are also the sectors where labour supply has been most responsive via rising female participation. In addition low inflation expectation and on-going job insecurity has shifted a loft of bargaining power to the employer. As such we expect that wages will continue to underperform for at least the remainder of this year.”
Deutsche Bank economist Phil Odonaghoe expects the RBA to take this into account with its monetary policy. “[T]the absence of genuine price and wage pressures suggests higher official interest rates are unlikely before mid-2019 in our view.” ANZ economist Giulia Specchia largely agrees. “For the RBA, today’s numbers are broadly in line with its view that wage growth has stabilised. However, wage growth (and in turn underlying inflation) is expected to remain subdued for some time, so the data are likely to have few implications for near-term monetary policy.”
17 May 2017
Australian households may not be feeling particularly confident at the moment but then again, they do not feel particularly pessimistic, either. The Westpac–Melbourne Institute survey of households over the period 8 May to 13 May gave results which in overall terms are not much different from the survey in April although the “evidence around the labour market in this survey is somewhat more encouraging.”
The Westpac-Melbourne Institute consumer sentiment index limped a little lower in May, the second month in a row where the index has barely moved. This time it moved from 99.0 to 98.0, which is not far from a neutral score of 100. Any reading below 100 indicates the number of consumers who are pessimistic is more than the number of consumers who are optimistic.
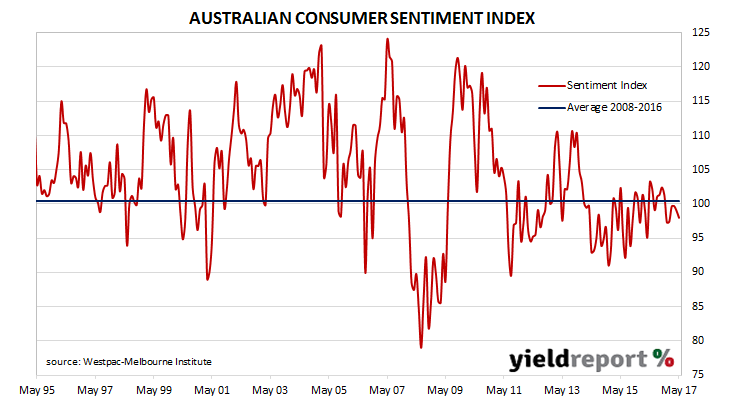
Despite the general acceptance of the Federal budget by the community, it appears to have had very little influence on consumers’ views. According to Bill Evans, Westpac’s chief economist, the RBA will view these figures and other supporting data with some concern. “[W]ith a flat response to the Budget, respondents remaining concerned about their finances and no signs of any improvement in wages prospects, the risks of weak household spending feeding back onto employment and investment will remain a concern for policy makers.” The RBA may not be worried about how households are reacting now, but they will worry about how households react in the months to come.
16 May 2017
The minutes of the RBA’s May meeting were largely unchanged from the April minutes and references to the labour market, house prices and household debt all featured prominently. The RBA board thought “developments in the labour and housing markets warranted careful monitoring” but there does not appear to be any sign of a rate change in the short-term as arguments for higher rates are offset by arguments against.
The outlook for our trading partners in the global economy “remained positive” and the Australian economy appears to have started 2017 well, or at least at a “moderate pace”. Domestic inflation “had been as expected in the March quarter” and while employment figures “had been somewhat mixed”, employment growth was expected as “forward-looking indicators” such as ANZ’s job advertisement survey “suggest…spare capacity in the labour market would decline gradually.”
References to the two ongoing problems of house prices and household debt remained mostly unchanged. With regards to house prices, Sydney, Melbourne and Perth were all mentioned again. In the April minutes, there was reference to signs Perth prices were “stabilising”. Well, not quite. “Conditions in established housing markets in Sydney and Melbourne remained robust, but housing prices had been falling in Perth.”
Household debt, the fuel for house price increases, was a problem. “Growth in housing credit had continued to outpace growth in household incomes, which suggested that the risks associated with household balance sheets had been rising.” The risks are almost certainly still rising.
Here’s what a few economists had to say about the minutes:
Tapas Strickland, NAB
“The RBA is likely to keep rates on hold for some time as it judges the effectiveness of recent macro-prudential policies in controlling housing risks and monitors momentum in the labour market. Last month’s bumper jobs figures should help alleviate concerns the RBA had over the labour market in the short term, but this will be an important area to watch. NAB sees the RBA on hold in 2017 and 2018, though the minutes suggest a macro bias to ease constrained by housing and indebtedness concerns.”
15 May 2017
Some economists and analysts argue an expansion of credit is the main driver of house price inflation and assets in general. Even the RBA acknowledges* an association of house price growth with access to finance. They also argue there are other factors at work such as population, household size and inflation as well but “access to finance” cannot be ignored. Monthly housing finance figures are thus viewed as an indicator of continuing trends and also of turning points.
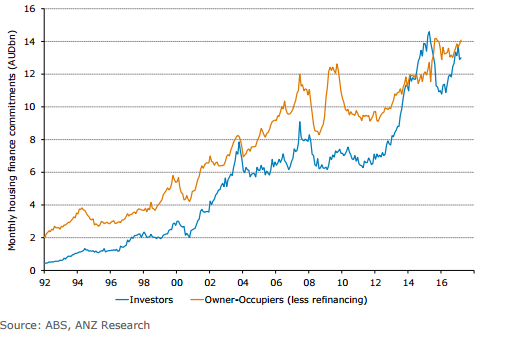
The ABS has released housing finance figures for March and the figures indicate the number of owner-occupier approvals fell 0.5% when compared to February and they are 1.9% less than in March 2016. However, excluding refinancing, the number of approvals was the same as February and 3.8% higher than a year ago. These figures were largely in line with market expectations.
In dollar terms, owner-occupier loan approvals increased by 0.9% in March, a turnaround from the 0.7% fall in February. Compared to March 2016 loans of this type were 0.3% higher. Investor loan growth grew by 0.8% in March but compared to 12 months ago they are 14.2% higher, which represents an acceleration from February’s year-on-year figure of 13.8%. Total loan approvals excluding refinancing was 10% higher than March 2016, exactly the same rate as the maximum housing credit growth designated by APRA.
The macro-prudential curbs introduced in 2015 seem to have lost their effectiveness. Additional restrictions have been introduced by APRA in late March but as Westpac’s senior economist Matthew Hassan said “the exact impact of new regulatory guidelines is unclear. The specific limit for investor credit growth was unchanged at 10% although lenders were instructed to keep growth ‘comfortably below’ the target.”
Unless you have been living in an underground bunker, then you will know Australian property prices on average have been red hot and they are considerably higher than they were five or ten years ago. However, the reality is prices have gone backwards recently in some cities and it is the price of housing in the three most-populated cities in the country which have pushed the average Australian price higher. This latest round of tighter lending standards is not expected to show up in lending figures until next month or later but if Australia truly does have a house price bubble, nothing will make any difference in any case until the herd unexpectedly changes direction.
*“…cheaper and easier access to finance underpinned a secular increase in households’ debt-to-income ratio that was closely associated with high housing price inflation from the early 1990s until the mid-2000s.” RBA Bulletin September quarter 2015, Long-run Trends in Housing Price Growth, Marion Kohler and Michelle van der Merwe.
12 May 2017
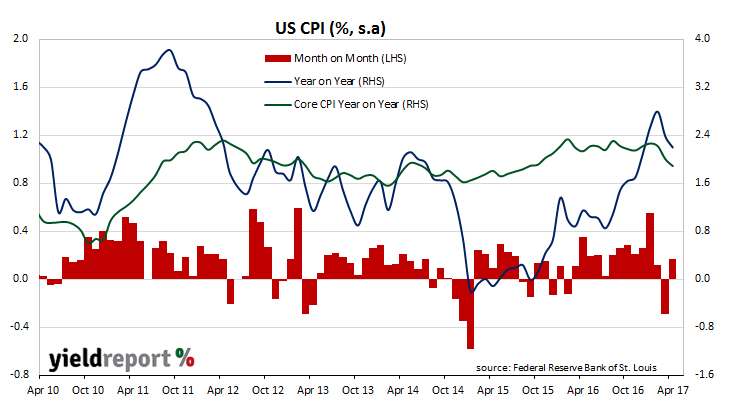
Fresh vegetables, energy and housing expenses drove consumer inflation higher in the U.S. during April. April CPI figures released by the Bureau of Labor Statistics indicate consumer prices rose by 0.2% for the month, which was in line with expectations and a big turn-around from March’s -0.3%.On a 12 month basis, consumer prices increased by 2.2%.
Core prices, a measure of prices which strips out food and energy price changes, rose by 0.1% for the month, below expectations of a 0.2% rise but a reversal of March’s 0.1% decline. Annual core inflation has inched down for a second month in a row to 1.9% from March’s 2.0% (seasonally adjusted).
Although the consumer price index (CPI) is not the U.S. Fed’s preferred measure of inflation, rises and falls in the rate of CPI inflation add to the overall picture of the US economy’s price level. U.S 2 year yields fell 4bps to 1.29%, U.S 10 year yields fell 7bps to 2.32% and the U.S. dollar weakened against other major currencies.
09 May 2017
Australian consumers have continued their aversion to spending, according to March retail sales figures released by the ABS. Despite suggestions of improved retailing conditions in NAB’s business survey which was released a day before, retailing conditions still appear to be tough.
Sales shrank by 0.1% over the month, which is well under the +0.3% growth expected and it follows a 0.2% decline in February. On a year-on-year basis, sales grew by 2.1%, which is down from February’s comparable figure of 2.7% and well below the long term average (see below).
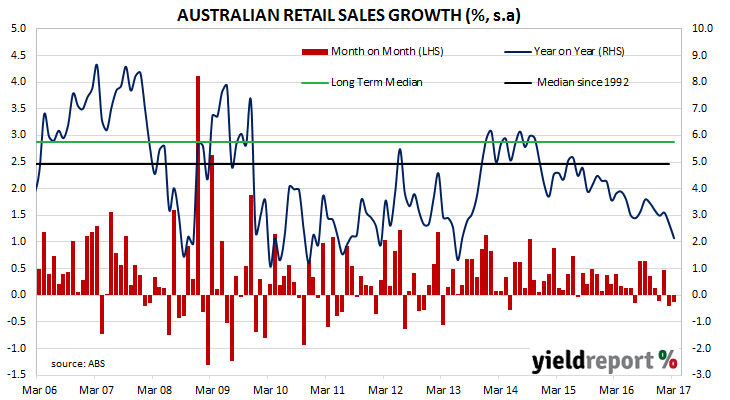
However, March may turn out to be an unusual case. If one looks at the figures on a state-by-state basis, two of the three largest states by population, New South Wales and Victoria, recorded sales increases in both trend and seasonally-adjusted terms. It was Queensland, the third most populous state, which has dragged nationwide figures into the red.
Queensland sales were 1.3% lower on a month on month basis. Part of the reason for such a drastic difference with Victoria and NSW was the effect Cyclone Debbie had on the state in the last week of March and in the first week of April.
However, it was not just a cyclone in one part of the country which had shoppers thinking twice about spending. According to ANZ senior economist Jo Masters, competitive pressures are at the heart of the matter. “Retail sales disappointed in both March and Q1, with soft volumes and weak retail inflation. Trading conditions remain difficult given the combination of strong competition, weak pricing power and low household income growth.”
08 May 2017
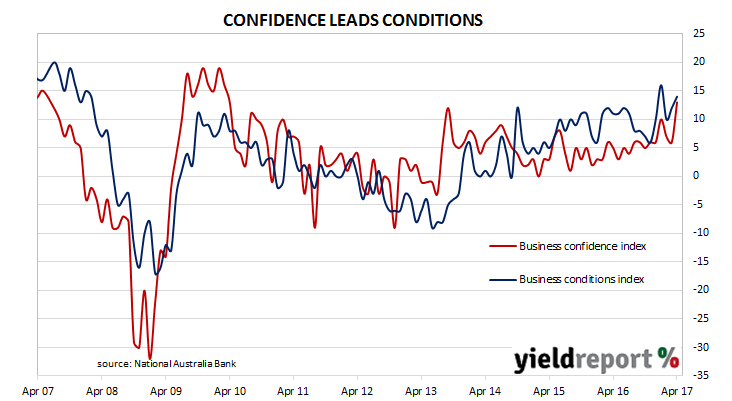
Australian businesses are still enjoying buoyant conditions across most industries and even retailers are starting to enjoy more favourable conditions. According to NAB’s latest monthly business survey of 400 firms in April, its Business Conditions Index rose 2 points to 14 from a revised reading of 12 in March, while its Business Confidence Index jumped from 6 to 13, which is well above its long term average of 6.
While trading conditions slipped back, profitability remained solid and employment conditions improved again. Spare capacity increased but according to NAB’s chief economist Alan Oster, the level of utilisation indicated there was less spare capacity in the Australian economy than the unemployment rate implied. Retail conditions “continue to lag behind the other industries” but the retail and transport sectors were chiefly responsible for April’s higher readings.
ANZ senior economist, Giulia Lavinia Specchia said the figures bode well for the business and employment. “The details of the report were also positive, suggesting that the business sector remains on a solid footing. Importantly, labour market indicators are buoyant and point to a solid improvement in the official labour market data released next week, in our view.”
UBS economist Scott Haslem had an interesting take on the relationship between NAB’s survey and RBA rate changes. He said business conditions were at a post-GFC high which was “historically consistent with RBA rate hikes”, although as readers can see, what has been historically true has not been the case this time around.
08 May 2017
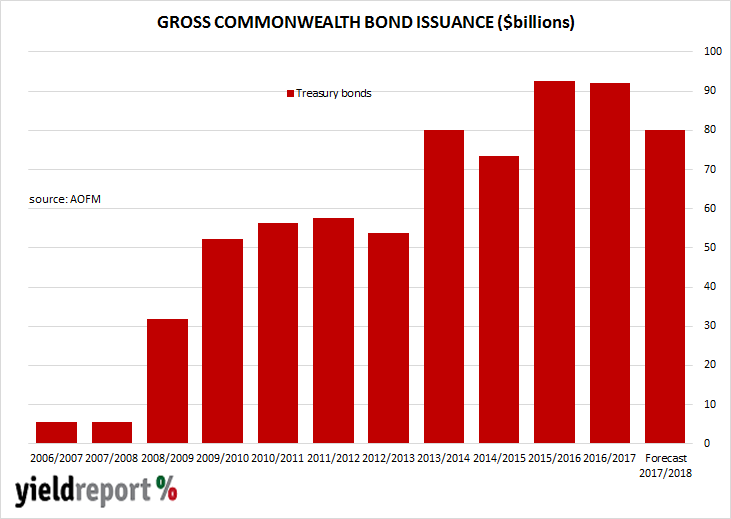
Following the release of the Federal Government 2017/2018 budget, the AOFM has announced it intends to issue around $80 billion of Treasury bonds in the 2017/2018 financial year. $46 billion worth of various bonds will be issued to finance existing bonds which are due to mature or are planned for repurchase, leaving net issuance at $34 billion. On top of this, $5 billion of index-linked bonds (ILBs) will be issued with an as-yet-unspecified amount of November 2018 ILBs to be repurchased.
The planned issuance of $80 billion bonds and $5 billion ILBs represents a fall in bond and ILB issuance from previous years. In the financial year to date, $92 billion bonds and $2.1 billion ILBs have been issued while in the 2015/2016 year $96.2 billion bonds and $2.4 billion ILBs were issued. New lines are planned in the form of November 2022s, November 2029s and May 2041s. There will also be a new line of ILBs which will have a 2027 or 2028 maturity dates. While the November 2022 and November 2029 lines will be issued some time during 2017/2018, the May 2041 line will not be issued until the 2018/2019 year. This particular bond line has been created as part of the AOFM’s commitment to the 20 year Treasury bond futures contract and so we can expect to see regular new issues of the May 2041s and bonds with similar tenors in the future.
08 May 2017
By guest contributor Atchison Consultants
The Australian direct property sector continues to look an attractive investment asset class for those looking for higher yielding returns in a low interest rate environment.
Continuing domestic interest in the asset class together with continued foreign capital inflows are expected to put further downward pressure on capitalisation rates over the next one to two years, with a resultant expected increase in capital values.
Figure 1 compares the 10-year government bond yield with the market cap rate over 20 years to 31 December 2016.
Cap rate spreads, which can be used as a proxy for yield spreads, continue to remain wide and attractive relative to 10 year Government bond yields, with the spread currently sitting at around 3%.
10 Year Government Bond Yields vs. Australian Commercial Property Capitalisation Rate
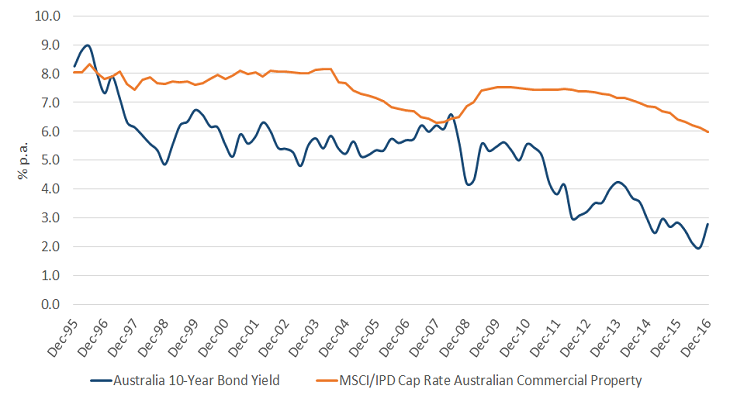
Source: RBA, MSCI
We are currently seeing major banks increase lending rates for commercial property borrowers. As the spread in yields narrows between property yields and debt interest rates, we expect this will have a moderating effect on investor demand for property. Capitalisation rates (yields) will flatten and possibly soften, leading to a stabilisation in capital values during the medium term (three to five year period).
We expect that growing tenant demand from increased economic activity resulting will see a flow on effect of increased rental income. This process is expected to be a gradual one over the next couple of years.
Capitalisation rates are below their 10 year long term average of 7.0%, with rate falls still occurring in the office, retail and industrial sectors – with a noticeable downward trend since mid-2015. These falls in capitalisation rates have been primarily driven by strong local and offshore investor demand looking for higher yielding defensive assets, rather than economic conditions or real rental growth.
08 May 2017
Suncorp’s latest hybrid offering was announced near the end of March and its new Capital Notes (ASX code: SUNPF) have finally began trading on a deferred delivery basis on the ASX this week, with the opening trade going through at $101.263. The notes finished the day at $101.903, a decent premium to their $100 face value. (The minimum price increment of interest rate securities traded on the ASX is 0.1 cent.) They have a 22 June 2022 call date and an issue margin of 4.10% above BBSW which provides an initial yield around 6.185%. Normal trading is expected to begin on 11 May 2017.
Since the issue was announced, margins on ASX listed notes have risen slightly. The median trading margin of ASX-listed hybrids has moved from around 3.40% on the day of the announcement to 3.28% on the day trading commenced. The diagram below shows how trading margins of non-major bank hybrids fared over that period. Suncorp CPS 2 (ASX code: SUNPC) and Insurance Australia CPS 2 (ASX code: IAGPC) should be ignored as both securities mature in 2017 and small price changes have resulted in large changes to their respective trading margins.
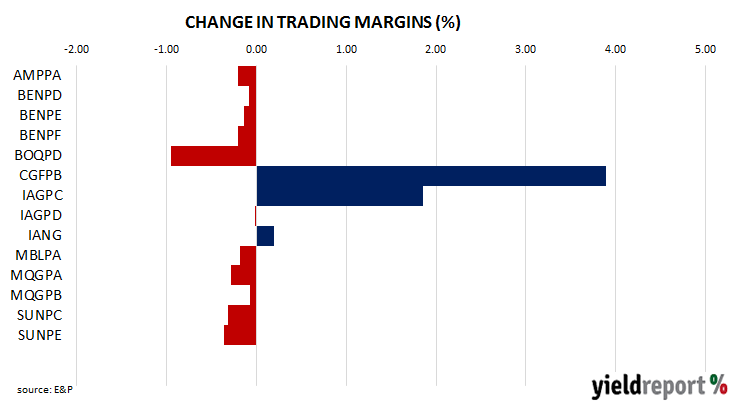
Suncorp’s new issue initially sought to raise $250 million but in the end over $375 million was raised. The first interest payment date is set for 18 September 2017 with the payment amount estimated to be $1.5219. The chart below shows how trading margins stood at the end of the first day’s trading.
