08 May 2017
ANZ’s job advertisement survey is well-known as a leading indicator of employment numbers in Australia. It reflects changes in demand for labour and it provides another measure of activity in the economy.
Figures for April have been released and, after revisions, total advertisements were 1.4% higher for the month, up on the previous month’s figures of 0.3%. Year-on year growth was 10.1%, up from 7.0% previously.
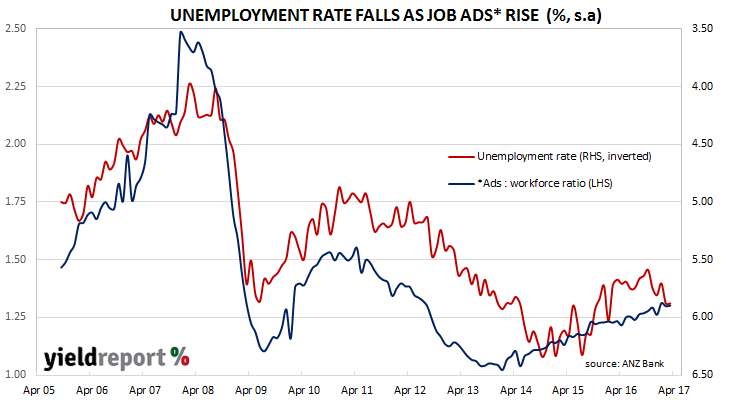
David Plank, ANZ’s Head of Australian Economics, said there was a gap between the ABS official employment figures and survey estimates. He expected the gap to be closed as employment numbers increased. Lower advertising would also close the gap but this is thought to the less-likely outcome as business conditions and confidence have been above-average so far. “The improvement in ANZ Job Ads and other leading employment indicators suggests we may be in for a sustained period of strength in the official employment data following the strong lift in jobs in March.”
05 May 2017
The U.S economy took another step towards full employment in April when it created 211,000 new jobs. The unemployment rate is now at 4.4%, down from March’s 4.5% and well down on the 5.0% unemployment rate of April 2016. Hourly pay rose from USD$26.12 to USD$26.19 or +2.5% year on year.
The median forecast of new jobs created was +190,000, while the unemployment rate was expected to rise to 4.6% as the total number of people in the workforce rose. However, as well as a higher-than-expected jobs figure, the participation rate edged down from 63% to 62.9%, sending the unemployment rate lower.
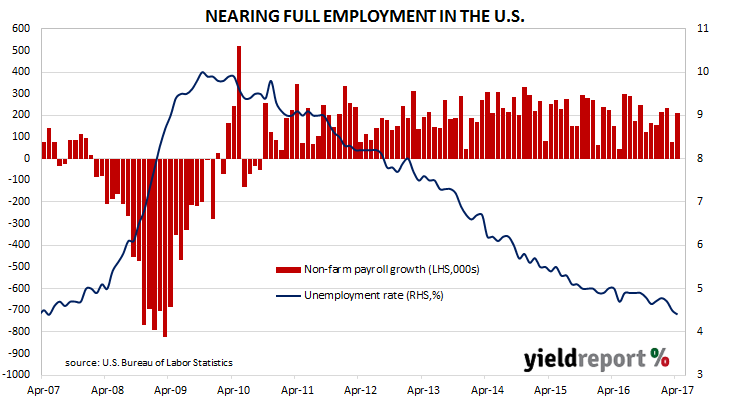
The last time the unemployment rate was this low was in March 2007. At that time the federal funds rate, the U.S. official interest rate, was at 5.25%. Given the current target rate is 0.75%-1.00%, this latest unemployment result makes a rate rise at next month Federal Open Markets Committee meeting a likely event.
05 May 2017
The RBA’s quarterly Statement on Monetary Policy (SoMP) sets out the RBA’s view of domestic and international conditions. It also provides forecasts for Australian inflation and GDP growth based on the most recent data. While its view of international conditions will not move international markets, past SoMPs have moved Australian bond and currency markets from time to time.
Expectations of anything dramatic coming out of the SoMP were low prior to its release. As Westpac’s currency team put it, “we would be surprised if the forecasts or messaging shifted valuations much, if at all.” On this occasion, there was little change in the statement. Inflation forecasts were left unchanged and there was only one modest shift in a GDP forecast; 0.25% was added to the forecast for the year to June 2018.
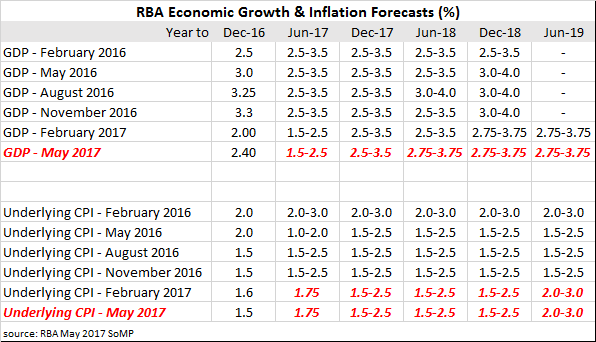
The SoMP was not entirely without controversy. ANZ’s David Planck picked on what appears to be some inconsistency in the RBA’s approach to inflation. “The point estimate for the year to June 2017 looks too low, for instance. Interestingly, the Bank’s forecasts for headline inflation don’t seem to line up with its commentary…The headline inflation numbers in its forecast table say otherwise.”
According to the RBA, “global economic conditions have picked up” and growth in Australia’s trading partners should be around “its long-run average this year before easing slightly in 2018.” Locally, things are looking positive, too. “Recent data are consistent with moderate growth in early 2017…Looking ahead, economic growth is expected to pick up gradually to be a bit above potential growth”. Underlying inflation is expected to be “around 2 per cent in early 2018” while headline inflation should be between 2% and 3% because of cigarette tax increases and price rises for utilities.
05 May 2017
The world’s largest index manager Vanguard has launched a low cost income focused active fund in Australia.
The new fund is called the Vanguard Managed Payout Fund and is available as currently available as a wholesale fund option only. The new fund seeks to firstly provide a consistent monthly cash distributions over a year, and secondly provide a total return that keeps pace with inflation over the longer term.
The fund’s exposure will be to a diversified portfolio of assets including Australian and international shares, REITs, bonds, cash and other assets. The fund’s benchmark is an internal composite benchmark made up of the following:
- 25% S&P/ASX 300 Index
- 30% MSCI World ex-Australia Index (AUD)
- 2% S&P/ASX 300 A-REIT Index
- 3% FTSE EPRA/NAREIT Developed ex-Australia Rental Index (AUD hedged)
- 25% Bloomberg Barclays Global Treasury Index (AUD hedged)
- 10% Bloomberg AusBond Composite 0+ Yr Index
- 5% Bloomberg Commodity Index (hedged to AUD).
In terms of fees, the headline ongoing management fee for this fund is 0.55% p.a., which reflects the active management component in this fund.
03 May 2017
Unlike the lead-up to the March meeting of the U.S. Fed’s FOMC, markets were quite confident the federal funds rate would not be lifted at the May meeting. Prices in the futures market for cash consistently implied traders thought there was a less than 10% probability of a rate rise and any such event would be more likely at the FOMC June meeting.
As it turned out, the FOMC did not change the federal funds rate from its current target band of 0.75% to 1.00%. However, it won’t be long before it does. “Inflation measured on a 12-month basis recently has been running close to the Committee’s 2% longer-run objective.” The U.S. unemployment rate was at 4.5% at the end of March and raising rates is all about recovering the official interest rate back to normal levels from the emergency levels it plunged to in order to avoid the Great Recession turning into the Great Depression 2.0.
Commentators and economists seemed to focus on the more hawkish tone of the statement. Bond and currency markets had been expecting such a tone with the May decision and when it was not there, the US currency weakened against other currencies and bond yields fell. This time around both 2 year and 10 year bond yields each rose 3bps to 1.29% and 2.32% respectively and the US dollar rose against other currencies.
ANZ Research described the FOMC as “confident in the economic outlook”, something ANZ suggest the “dot plots” are worth relying on. CBA fixed income strategist Philip Brown reached a similar conclusion. “In light of the overall upbeat assessment, the Fed is likely to continue its approach of gradually raising Fed Funds rates. We continue to forecast two hikes through the remainder of the year, one each in June and September.”
02 May 2017
The May board meeting of the RBA is historically one of the four months of the year in which the likelihood of a rate changes is highest. This is not to say every May meeting results in a rate change; May, along with February, August and November happen to be the four months of the year in which previous rate changes have typically occurred.

(79% correlation of RBA cash rate to U.S. federal funds rate, lagged by seven months.)
The RBA decided to hold Australia official cash rate steady at 1.50%, which is the lowest in the RBA’s history despite Australia not being in a recession or obviously heading into one. Cash futures imply very little chance of a change in any month this year, although there is a slight bias towards another 25bps reduction and the RBA’s decision to hold was greeting without surprise.
Very little of the statement changed between April’s board meeting and this one. The RBA still holds the view the “high and rising levels of indebtedness” of households will be addressed by macro-prudential measures. However, as Philip Lowe’s former colleague and co-author, Claudio Borio, said recently in an interview, relying exclusively on macro-prudential “levers” is a mistake. Central banks need to combine them “with monetary policy”, which means higher interest rates in this situation. So far the RBA has resisted moving the official interest rate higher, although commercial banks have increased some mortgage rates and tightened eligibility rules.
01 May 2017
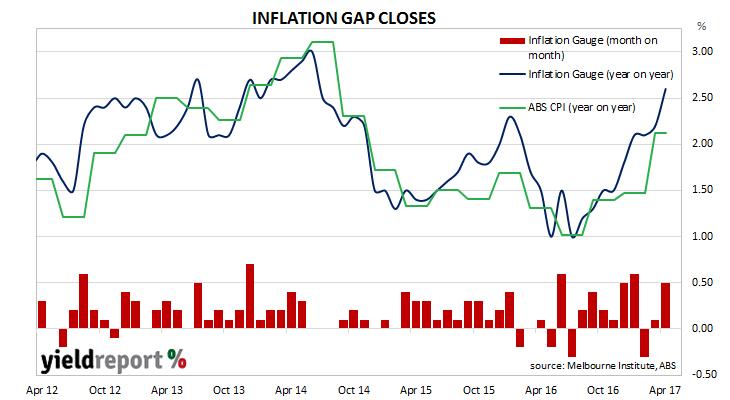
The Melbourne Institute’s Inflation Gauge is an attempt to replicate the ABS consumer price index (CPI) on a monthly basis instead of a quarterly one. It has turned out to be a reliable leading indicator of the CPI, although there are periods in which the Inflation Gauge series and the CPI have diverged, only for the two series to eventually realign over the space of six to twelve months.
During April, the Inflation Gauge jumped by 0.5% and by 2.6% over the last 12 months. March’s comparable figures were 0.1% and 2.2%. Core measures of inflation, such as the Melbourne Institute’s version of “trimmed mean” moved up from 1.6% (year on year) to 1.7%.
Unlike previous months where retail sales and job advertisement figures were released on the same day, the latest inflation gauge figures were published in the absence of any other major economic data releases. Yields on 3 year bonds edged up 1bps to 1.84% while 10 year bonds finished the day steady at 2.61%.
In February’s report, the chart was labelled “Inflation up or false dawn?” The sizeable gap which has existed in February closed after March quarter CPI figures moved higher. These latest Inflation Gauge figures suggest inflation, as measured by consumer prices, is likely to rise after another gap has opened between the two series.
01 May 2017
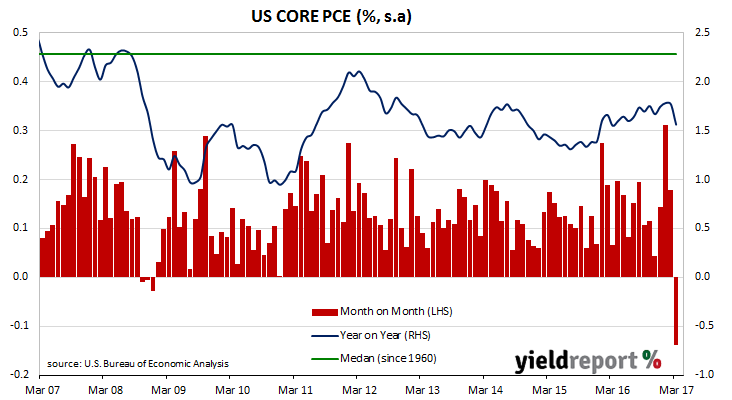
One of the US Fed’s favoured measures of inflation is core personal consumption expenditure (PCE). The core version of consumer spending strips out energy and food components, which are volatile from month to month, in an attempt to identify the prevailing trend. It’s not the only measure of inflation used; the Fed also tracks the Consumer Price Index (CPI) and Producer Price Index (PPI) from the Department of Labor.
The latest core PCE figures have been published by the Bureau of Economic Analysis as part of March figures for personal income and expenditures. At -0.1% for the month and 1.6% year on year, the numbers fell from February’s comparable figures of +0.2% and 1.8% (after revisions) and were as ANZ put it “the largest monthly fall since 2001”. Janu Chan, a senior economist at St George Bank said the figures are reminder of why wariness is sometimes required. “It justifies some of the caution among some Fed officials regarding whether the inflation pickup late last year was sustainable.”
28 April 2017
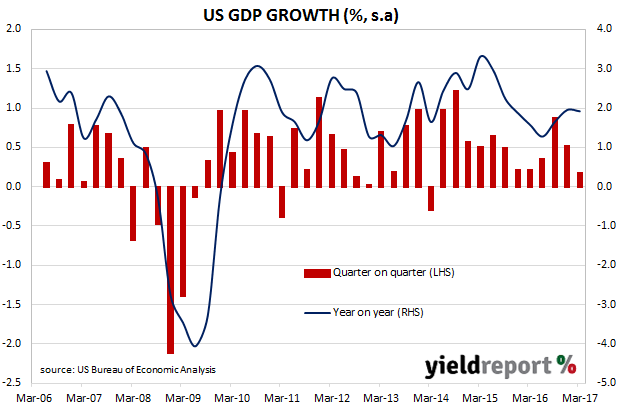
Global politics has been drowning out most economic reports in the last few weeks and so the release of March quarter US GDP figures has received less attention than it would have under normal conditions. The US Commerce Department released Q1 2017 “advance” estimates of US GDP on Friday night Australian time. This estimate is the first of four estimates and subject to three more revisions over the next two months. They show an annualised growth rate of 0.7%, lower than the median estimate of 1.0% and well down up on the Q4 2016 figure of 2.1%.
Yields of US Treasury bonds were mixed on the day. 2 year bond yields were 2bps higher at 1.27% and 10 year bonds were 1bp lower at 2.28%. While the GDP figure was disappointing, in another part of the report regarding core personal consumption expenditure (PCE), the PCE price index increased by 2.0%, up from 1.3% in the December quarter. In some ways the March quarter figures are reminiscent of December quarter GDP figures; those figures were “disappointing” but the composition of the GDP (that is, strong imports) suggests a strong domestic economy. In this case, a measure of price growth has provided the same reassuring feature.
US GDP numbers are published in a manner which is different to most other countries; quarterly figures are compounded to give an annualised figure. In countries such as Australia and the UK, an annual figure is calculated by taking the latest number and comparing it with a figure from a year ago. The diagram below shows US GDP once it has been expressed in the normal manner.’
27 April 2017
The ASX will soon have another fixed interest ETF available for investors to trade when VanEck launches its Vectors Australian Corporate Bond Plus ETF.
VanEck is one of the largest providers of ETFs worldwide managing approximately US$43 billion in both active and passive portfolios. In Australia, VanEck currently manages 12 ETFs listed on the ASX.
The new ETF will be a smart beta Australian Fixed Income ETF which will traded under the ASX code of PLUS. According to its product disclosure statement, the fund will have a management cost of 0.32% p.a. and distributions will be made quarterly.
The new ETF will track the Markit iBoxx AUD Corporates Yield Plus Index. This index differs from the Bloomberg AusBond Composite 0+ Years Index which holds a larger basket of issues and issuers.
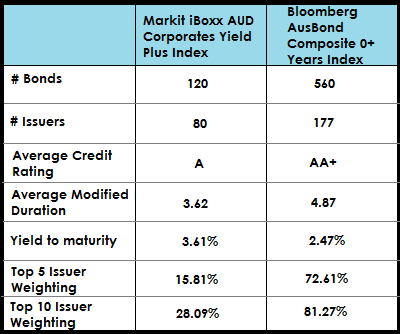
Source: VanEck,Bloomberg, Markit as at 31 March 2017
