News

US job gains “holding up”; 303k more jobs in March

05 April 2024

Summary: US non-farm payrolls up 303,000 in March, above expectations; previous two months’ figures revised up by 22,000; ANZ: job gains holding up in education, healthcare, government sectors; jobless rate edges down to 3.8%, participation rate rises to 62.7%; US Treasury yields up across curve; expectations of Fed rate cuts soften; ANZ: private payrolls excluding “eds and meds” rose 144,000 in March; employed-to-population ratio rises to 60.3%; underutilisation rate ticks steady at 7.3%; annual hourly pay growth slows to 4.1%.

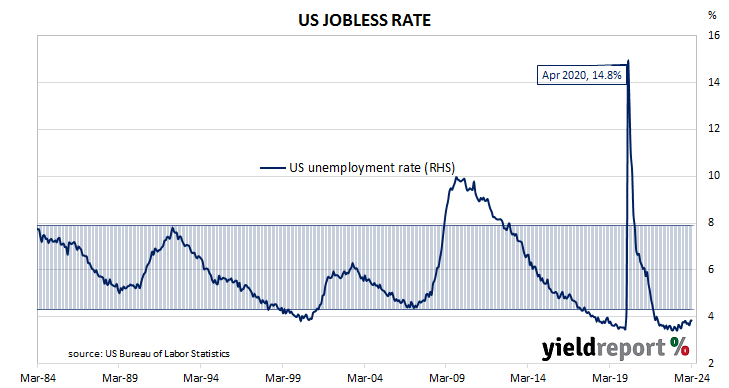
The US economy ceased producing jobs in net terms as infection controls began to be implemented in March 2020. The unemployment rate had been around 3.5% but that changed as job losses began to surge through March and April of 2020. The May 2020 non-farm employment report represented a turning point and subsequent months provided substantial employment gains which continued through into 2021, 2022 and 2023.

According to the US Bureau of Labor Statistics, the US economy created an additional 303,000 jobs in the non-farm sector in March. The increase was considerably more than the 216,000 rise which had been generally expected and greater than the 270,000 jobs which had been added in February. Employment figures for January and February were revised up by a total of 22,000.

“The report showed it is a cyclical component of the economy where job gains are holding up, namely the education and healthcare sectors and the government sector,” said ANZ economist Madeline Dunk.

The total number of unemployed declined by 29,000 to 6.429 million while the total number of people who were either employed or looking for work increased by 469,000 to 167.895 million. These changes led to the US unemployment rate edging down from February’s figure of 3.9% to 3.8%. The participation rate rose from 62.5% to 62.7%.

US Treasury yields rose noticeably across the curve on the day. By the close of business, the 2-year yield had gained 10bps to 4.75%, the 10-year yield had added 9bps to 4.40% while the 30-year yield finished 7bps higher at 4.55%.

In terms of US Fed policy, expectations of a lower federal funds rate in the next 12 months softened, although several cuts are still factored in. At the close of business, contracts implied the effective federal funds rate would average 5.31% in May, 2bps less than the current spot rate, 5.235% in June and 5.185% in July. March 2025 contracts implied 4.515%, 81bps less than the current rate.

“Excluding the “eds and meds”, the enablement economy, private payroll jobs growth rose 144,000 in March, with the three-month average running at 122,000,” Dunk added. “Recent estimates from the Brookings Institute suggest average jobs growth of 230,000 may be consistent with non-accelerating wages and inflation, due to strong net migration.”

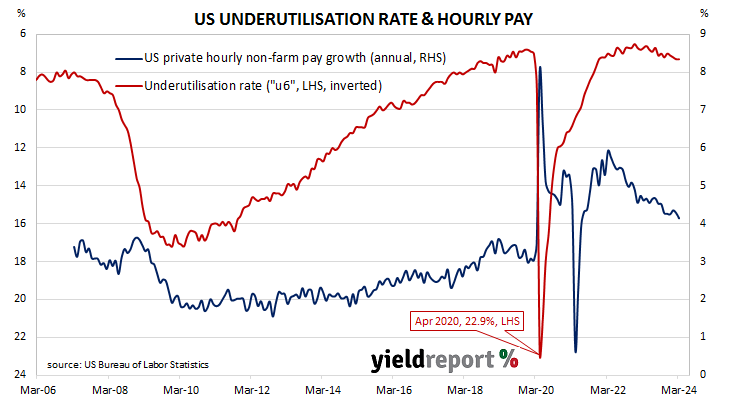
One figure which is indicative of the “spare capacity” of the US employment market is the employment-to-population ratio. This ratio is simply the number of people in work divided by the total US population. It hit a cyclical-low of 58.2 in October 2010 before slowly recovering to just above 61% in late-2019. March’s reading increased from 60.1% to 60.3%, still some way from the April 2000 peak reading of 64.7%.

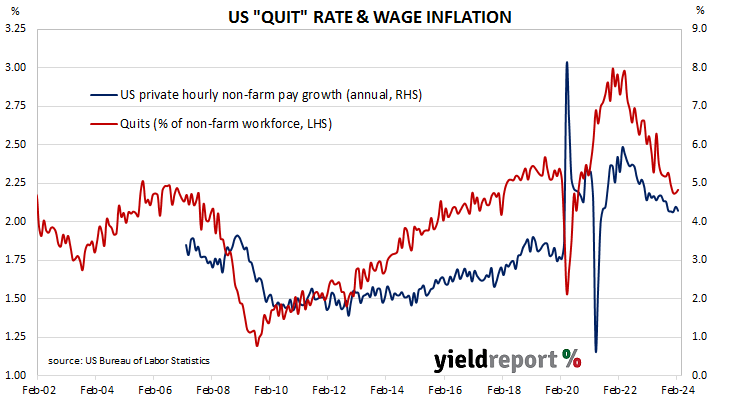
Apart from the unemployment rate, another measure of tightness in the labour market is the underutilisation rate and the latest reading of it registered 7.3%, unchanged from February. Wage inflation and the underutilisation rate usually have an inverse relationship; private hourly pay growth in the year to March slowed from 4.3% to 4.1%.

Third month of falls for home approvals in February

04 April 2024

Home approval numbers down 1.9% in February, contrasts with expected gain; 5.8% lower than February 2023; Westpac: approvals making another leg lower; ACGB yields up; rate-cut expectations soften; Westpac: data suggests ‘front end’ of construction pipeline shrinking materially; house approvals up 10.5%, apartments down 20.8%; non-residential approvals down 16.0% in dollar terms, residential alterations down 0.1%.

Building approvals for dwellings, that is apartments and houses, headed south after mid-2018. As an indicator of investor confidence, falling approvals had presented a worrying signal, not just for the building sector but for the overall economy. However, approval figures from late-2019 and the early months of 2020 painted a picture of a recovery taking place, even as late as April of that year. Subsequent months’ figures then trended sharply upwards before reversing course and falling back through 2021, 2022 and 2023.

The Australian Bureau of Statistics has released the latest figures from February and they show total residential approvals fell by 1.9% over the month on a seasonally-adjusted basis. The result contrasted with the 3.0% gain which had been generally expected but the fall was not as great as January’s 2.5% loss after revisions. Total approvals fell by 5.8% on an annual basis, in contrast with the previous month’s revised figure of 4.1%. Monthly growth rates are often volatile.

This marks a third monthly fall in a row, suggesting approvals are making another leg lower after bumping around a weak level through most of last year,” said Westpac senior economist Matthew Hassan. “That said, the detail is less conclusive.”

Commonwealth Government bond yields rose on the day, generally contrasting with overnight movements of US Treasury yields. By the close of business, the 3-year ACGB yield had added 3bps to 3.71%, the 10-year had gained 4bps to 4.19% while the 20-year yield finished 6bps higher at 4.60%.

In the cash futures market, expectations regarding rate cuts in the next twelve months softened.  At the end of the day, contracts implied the cash rate would remain close to the current rate for the next few months and average 4.305% through May and 4.29% in June. However, August contracts implied a 4.215% average cash rate, November contracts implied 4.07%, while February contract implied 3.935%, 39bps less than the current rate.

“Overall, the February building approvals data suggests the ‘front end’ of the construction pipeline is shrinking materially, although the extent of the down-trend in dwelling construction is unclear,” Hassan added. “At current levels, annual new dwelling completions, which came in at just over 170,000 last year, will be tracking steadily lower towards 155,000 as the roughly 50,000 of backlogged projects clear.”

Approvals for new houses rose by 10.5% over the month, in contrast with January’s 9.5% loss after revisions. On a 12-month basis, house approvals were 1.2% lower than they were in February 2023, up from January’s comparable figure of -4.4%.                                             

Apartment approval figures are usually a lot more volatile and February approvals for this category dropped by 20.8% after a 10.6% gain in January. The 12-month growth rate fell from January’s revised rate of 20.5% to -14.3%.

Non-residential approvals decreased by 16.0% in dollar terms over the month and were 32.8% lower on an annual basis. Figures in this segment also tend to be rather volatile.

Residential alteration approvals slipped by 0.1% in dollar terms over the month and were 2.2% lower than in February 2023.

Steady US quit rate; more quits, openings, separations in February

02 April 2024

Summary: US quit rate steady at 2.2% in February; short-term US Treasury yields slip, longer-term yields up; expectations of Fed rate cuts firm; ANZ: ratio of job openings to available workers points to moderation in labour-market-driven inflation pressures; more quits, openings, separations.

The number of US employees who quit their jobs as a percentage of total employment increased slowly but steadily after the GFC. It peaked in March 2019 and then tracked sideways until virus containment measures were introduced in March 2020. The quit rate then plummeted as alternative employment opportunities rapidly dried up. Following the easing of US pandemic restrictions, it proceeded to recover back to its pre-pandemic rate in the third quarter of 2020 and trended higher through 2021 before easing through 2022 and 2023.

Figures released as part of the latest Job Openings and Labor Turnover Survey (JOLTS) report show the quit rate remained steady in February. 2.2% of the non-farm workforce left their jobs voluntarily, unchanged from January. Quits in the month increased by 38,000 while an additional 229,000 people were employed in non-farm sectors.

Short-term US Treasury yields slipped a little while longer-term yields rose. By the close of business, the 2-year Treasury bond yield had lost 1bp to 4.70%, the 10-year yield had gained 5bps to 4.36% while the 30-year yield finished 4bps higher at 4.50%.

In terms of US Fed policy, expectations of a lower federal funds rate in the next 12 months firmed, with several cuts already factored in. At the close of business, contracts implied the effective federal funds rate would average 5.31% in May, 2bps below the current spot rate, 5.22% in June and 5.16% in July. March 2025 contracts implied 4.48%, 85bps less than the current rate.

“However, owing to the rise in US unemployment in February, the ratio of job openings to available workers eased to 1.36 versus 1.42, pointing to a supply driven rebalancing and moderating in labour market driven inflation pressures,” said ANZ senior economist Blair Chapman. “The data helped settle the selloff in the bond market.”

The rise in total quits was led by 77,000 more resignations in the “Retail trade” sector while the “Accommodation and food services” sector experienced the largest decline, falling by 53,000. Overall, the total number of quits for the month increased from January’s revised figure of 3.446 million to 3.484 million.

Total vacancies at the end of February increased by 8,000, or 0.1%, from January’s revised figure of 8.748 million to 8.756 million. The increase was driven by a 126,000 gain in the “Finance and insurance” sector while the “Information” sector experienced the single largest decrease, falling by 85,000. Overall, 9 out of 18 sectors experienced more job openings than in the previous month.  

Total separations increased by 110,000, or 2.0%, from January’s revised figure of 5.449 million to 5.559 million. The rise was led by the “Retail trade” sector where there were 108,000 more separations. Separations increased in 10 of the 18 sectors.

The “quit” rate time series produced by the JOLTS report is a leading indicator of US hourly pay. As wages account for around 55% of a product’s or service’s price in the US, wage inflation and overall inflation rates tend to be closely related. Former Federal Reserve chief and current Treasury Secretary Janet Yellen was known to pay close attention to it.

Job ads fall again in March; series “stickiness” suggests gradual rise for jobless rate

02 April 2024

Summary: Job ads down 1.0% in March; 10.6% lower than March 2023; ANZ: pace of declines eases; ACGB yields rise noticeably; rate-cut expectations soften; ANZ: recent stickiness in series suggests gradual rise in jobless rate; ad index-to-workforce ratio declines.

From mid-2017 onwards, year-on-year growth rates in the total number of Australian job advertisements consistently exceeded 10%. That was until mid-2018 when the annual growth rate fell back markedly. 2019 was notable for its reduced employment advertising and this trend continued into the first quarter of 2020. Advertising then plunged in April and May of 2020 as pandemic restrictions took effect but recovered quite quickly, reaching historically-high levels in 2022.

According to the latest reading of the ANZ-Indeed Job Ads Index, total job advertisements in March declined by 1.0% on a seasonally adjusted basis. The index fell from 133.5 in February after revisions to 132.1, following a loss of 2.1% in February and a gain of 3.2% in January. On a 12-month basis, total job advertisements were 10.6% lower than in March 2023, up from February’s revised figure of -11.8%.

“The pace of declines in ANZ-Indeed Job Ads has eased,” said ANZ economist Madeline Dunk. “In fact, there was no change in the average number of Job Ads in Q1 2024 compared to Q4 2023.”

The update was released on the same day as the Melbourne Institute’s latest Inflation Gauge reading and Commonwealth Government bond yields rose noticeably across the curve, largely in line with overnight rises of US Treasury yields. By the close of business, the 3-year ACGB yield had gained 7bps to 3.62% while 10-year and 20-year yields finished 10ps higher at 4.08% and 4.38% respectively.

In the cash futures market, expectations regarding rate cuts later this year softened.  At the end of the day, contracts implied the cash rate would remain close to the current rate for the next few months and average 4.305% through May and 4.29% in June. However, August contracts implied a 4.20% average cash rate, November contracts implied 4.03%, while February contract implied 3.865%, 46bps less than the current rate.

“While we expect to see a further moderation in Job Ads, the recent stickiness in the series implies it is unlikely to be a linear path downward and suggests we will only see a gradual rise in unemployment,” Dunk added. “Indeed, while ABS job vacancies fell 6.1% quarter-on quarter in February and 23.5% since the May 2022 peak, there hasn’t been a corresponding increase in the unemployment rate.”

The inverse relationship between job advertisements and the unemployment rate has been quite strong (see below chart), although ANZ themselves called the relationship between the two series into question in early 2019. A higher job advertisement index as a proportion of the labour force is suggestive of lower unemployment rates in the near future while a lower ratio suggests higher unemployment rates will follow. March’s ad index-to-workforce ratio declined from 0.91 after revisions to 0.90.

In 2008/2009, advertisements plummeted and Australia’s unemployment rate jumped from 4% to nearly 6% over a period of 15 months. When a more dramatic fall in advertisements took place in April 2020, the unemployment rate responded much more quickly.

Melb. Institute inflation rate slows; up 0.1% in March

02 April 2024

Melbourne Institute Inflation Gauge index up 0.1% in March; up 3.8% on annual basis; ACGB yields rise noticeably; rate-cut expectations soften.

The Melbourne Institute’s Inflation Gauge is an attempt to replicate the ABS consumer price index (CPI) on a monthly basis. It has turned out to be a reliable leading indicator of the CPI, although there are periods in which the Inflation Gauge and the CPI have diverged for as long as twelve months. On average, the Inflation Gauge’s annual rate tends to overestimate the ABS rate by around 0.1%, or at least until recently.

The Melbourne Institute’s latest reading of its Inflation Gauge index indicates consumer prices increased by just 0.1% in March, following a fall of 0.1% in February and a 0.3% rise in January. The index rose by 3.8% on an annual basis, down from February’s comparable figure of 4.0%.

The update was released on the same day as ANZ’s latest Job Ads report and Commonwealth Government bond yields rose noticeably across the curve, largely in line with overnight rises of US Treasury yields. By the close of business, the 3-year ACGB yield had gained 7bps to 3.62% while 10-year and 20-year yields finished 10ps higher at 4.08% and 4.38% respectively.

In the cash futures market, expectations regarding rate cuts later this year softened.  At the end of the day, contracts implied the cash rate would remain close to the current rate for the next few months and average 4.305% through May and 4.29% in June. However, August contracts implied a 4.20% average cash rate, November contracts implied 4.03%, while February contract implied 3.865%, 46bps less than the current rate.

Given the Inflation Gauge’s tendency to overestimate, the latest figures imply an official CPI reading of 1.0% (seasonally adjusted) for the March quarter or 3.7% in annual terms. However, it is worth noting the annual CPI rate to the end of March 2023 was 7.0% while the Inflation Gauge had implied a 5.7% annual rate at the time.

US manufacturing expanding again; March ISM PMI back over 50

01 April 2024

ISM PMI up in March, above expectations; US manufacturing sector expanding for first time since September 2022; US Treasury yields rise significantly; expectations of Fed rate cuts soften; ANZ: jump came despite broad-based weakness in Fed manufacturing surveys, small fall in S&P US Manufacturing PMI, ISM: reading corresponds to 2.2% US GDP growth annualised.

The Institute of Supply Management (ISM) manufacturing Purchasing Managers Index (PMI) reached a cyclical peak in September 2017. It then started a downtrend which ended in March 2020 with a contraction in US manufacturing which lasted until June 2020. Subsequent month’s readings implied growth had resumed, with the index becoming stronger through to March 2021. Readings then declined fairly steadily until mid-2023.

According to the ISM’s March survey, its PMI recorded a reading of 50.3%, above the generally expected figure of 48.5% as well as February’s reading of 47.8%. The average reading since 1948 is roughly 53.0% and any reading below 50% implies a contraction in the US manufacturing sector relative to the previous month.

“The US manufacturing sector moved into expansion for the first time since September 2022,” said Timothy Fiore of the ISM Manufacturing Business Survey Committee. “Demand was positive, output strengthened and inputs remained accommodative.”

US Treasury yields rose significantly on the day. By the close of business, the 2-year Treasury bond yield had added 8bps to 4.71%, the 10-year yield had gained 10bps to 4.31% while the 30-year yield finished 11bps higher at 4.46%.

In terms of US Fed policy, expectations of a lower federal funds rate in the next 12 months softened, although several cuts are still factored in. At the close of business, contracts implied the effective federal funds rate would average 5.315% in May, 1bp below the current spot rate, 5.235% in June and 5.18% in July. March 2025 contracts implied 4.505%, 82bps less than the current rate.

“The jump came despite broad-based weakness in the Fed manufacturing surveys over the month and a small fall in the S&P Global US Manufacturing PMI,” observed ANZ FX analyst Felix Ryan. “The outlook remains challenging, given high inventories and weak external demand, but the 6.2 point leap in the production index to its highest in almost two years was striking.”

Purchasing managers’ indices (PMIs) are economic indicators derived from monthly surveys of executives in private-sector companies. They are diffusion indices, which means a reading of 50% represents no change from the previous period, while a reading under 50% implies respondents reported a deterioration on average. A reading “above 48.7%, over a period of time, generally indicates an expansion of the overall economy”, according to the ISM.    

The ISM’s manufacturing PMI figures appear to lead US GDP by several months despite a considerable error in any given month. The chart below shows US GDP on a “year on year” basis (and not the BEA annualised basis) against US GDP implied by monthly PMI figures. 

According to the ISM and its analysis of past relationships between the PMI and US GDP, March’s PMI corresponds to an annualised growth rate of 2.2%, or about 0.5% over a quarter. Regression analysis on a year-on-year basis suggests a 12-month GDP growth rate of 2.5% five months after this latest report.

The ISM index is one of two monthly US PMIs, the other being an index published by S&P Global. S&P Global produces a “flash” estimate in the last week of each month which comes out about a week before the ISM index is published. The S&P Global flash March manufacturing PMI registered 52.5%, up 0.3 percentage points from February’s final figure.

Core PCE price index up 0.3% in Feb; annual rate slows to 2.8%

29 March 2024

Summary: US core PCE price index up 0.3% in February, in line with expectations; annual rate slows to 2.8%; Treasury yields rise; Fed rate-cut expectations soften.

One of the US Fed’s favoured measures of inflation is the change in the core personal consumption expenditures (PCE) price index. After hitting the Fed’s target at the time of 2.0% in mid-2018, the annual rate then hovered in a range between 1.8% and 2.0% before it eased back to a range between 1.5% and 1.8% through 2019. It then plummeted below 1.0% in April 2020 before rising back to around 1.5% in the September quarter of that year. It has since increased significantly and still remains above the Fed’s target even after recent declines.

The latest figures have now been published by the Bureau of Economic Analysis as part of the February personal income and expenditures report. Core PCE prices rose by 0.3% over the month, in line with expectations but down from January’s 0.5% increase after it was revised from 0.4%. On a 12-month basis, the core PCE inflation rate slowed from January’s revised rate of 2.9% to 2.8%.

US Treasury bond yields generally rose on the day. By the close of business, the 2-year Treasury bond yield had gained 5bps to 4.62%, the 10-year yield had added 2bps to 4.21% while the 30-year yield finished unchanged at 4.35%.

In terms of US Fed policy, expectations of a lower federal funds rate in the next 12 months softened, although several cuts are still factored in. At the close of business, contracts implied the effective federal funds rate would average 5.30% in May, 3bps below the current spot rate, 5.215% in June and 5.16% in July. March 2025 contracts implied 4.41%, 92bps less than the current rate.

The core version of PCE strips out energy and food components, which are volatile from month to month, in an attempt to identify the prevailing trend. It is not the only measure of inflation used by the Fed; the Fed also tracks the Consumer Price Index (CPI) and the Producer Price Index (PPI) from the Department of Labor. However, it is the one measure which is most often referred to in FOMC minutes.

“Momentum still looks weak”; Feb retail sales rise 0.3%

28 March 2024

Summary: Retail sales up 0.3% in February, slightly less than expected; up 1.6% on 12-month basis; Westpac: momentum still looks weak, trend growth tracking 0.1% per month; ACGB yields fall; rate-cut expectations soften; Westpac: overall picture remains consistent with lacklustre consumer environment; largest influence on result from clothing sales.

Growth figures of domestic retail sales spent most of the 2010s at levels below the post-1992 average. While economic conditions had been generally favourable, wage growth and inflation rates were low. Expenditures on goods then jumped in the early stages of 2020 as government restrictions severely altered households’ spending habits. Households mostly reverted to their usual patterns as restrictions eased in the latter part of 2020 and throughout 2021.

According to the latest ABS figures, total retail sales rose by 0.3% on a seasonally adjusted basis in February. The rise was slightly less than the 0.4% increase which had been generally expected and considerably less than January’s 1.1% gain. Sales increased by 1.6% on an annual basis, up from 1.2% after revisions.

“Looking through recent volatility, momentum still looks weak, trend growth tracking 0.1% [per] month and sales down 0.5% on a quarterly basis,” said Westpac senior economist Matthew Hassan.

Commonwealth Government bond yields moved lower on the day, lagging the falls of US Treasury yields overnight. By the close of business, the 3-year ACGB yield had lost 3bps to 3.55% while 10-year and 20-year yields both finished 4bps lower at 3.98% and 4.28% respectively.

In the cash futures market, expectations regarding rate cuts later this year softened.  At the end of the day, contracts implied the cash rate would remain close to the current rate for the next few months and average 4.315% through April, 4.30% in May and 4.28% in June. However, August contracts implied a 4.17% average cash rate, November contracts implied 3.985%, while February contract implied 3.815%, 50bps less than the current rate.

“Overall, while there are some positives in the detail, the overall picture remains consistent with a lacklustre consumer environment,” added Hassan. “We suspect this will remain the case until cost-of-living pressures ease more materially and policy supports, tax cuts from July and interest rate cuts from September, come into play.”

Retail sales are typically segmented into six categories (see below), with the “Food” segment accounting for 40% of total sales. However, the largest influence on the month’s total came from the “Clothing” segment where sales rose by 4.2% over the month.

Overall sentiment improves in euro-zone; ESI up in March

27 March 2024

Summary: Euro-zone composite sentiment indicator up modestly in March, in line with expectations; readings up in four of five sectors; up in three of four largest euro-zone economies; German, French 10-year yields fall; index implies annual GDP growth rate of 0.5%.

The European Commission’s Economic Sentiment Indicator (ESI) is a composite index comprising five differently weighted sectoral confidence indicators.  It is heavily weighted towards confidence surveys from the business sector, with the consumer confidence sub-index only accounting for 20% of the ESI. However, it has a good relationship with euro-zone GDP growth rates, although not necessarily as a leading indicator.

According to the latest survey taken by the European Commission in March, confidence has improved on average across the various sectors of the euro-zone economy. The ESI posted a reading of 96.3, in line with expectations, but up modestly from February’s revised reading of 95.5. The average reading since 1985 is just under 100.

Long-term German and French 10-year bond yields both fell on the day. By the close of business, the German 10-year yield had shed 6bps to 2.29% while the French 10-year yield finished 4bps lower at 2.79%.

Confidence improved in four of the five sectors of the euro-zone economy. On a geographical basis, the ESI increased in three of four of the euro-zone’s largest economies.

End-of-quarter ESI readings and annual euro-zone GDP growth rates are highly correlated. This latest reading corresponds to a year-to-March GDP growth rate of 0.5%, up from February’s implied growth rate of 0.3%.

“Signs of improving”; Westpac-MI leading index moves back to trend growth

27 March 2024

Summary: Leading index growth rate up in February; continues to show signs of improving; reading implies annual GDP growth of around 2.75%; ACGB yields fall; rate-cut expectations soften a touch; recent readings broadly consistent with more-stable growth profile emerging later this year.

Westpac and the Melbourne Institute describe their Leading Index as a composite measure which attempts to estimate the likely pace of Australian economic growth in the short-term. After reaching a peak in early 2018, the index trended lower through 2018 and 2019 before plunging to recessionary levels in the second quarter of 2020. Subsequent readings spiked towards the end of 2020 but then trended lower through 2021 and 2022 before flattening out in 2023.

February’s reading has now been released and the six month annualised growth rate of the indicator registered +0.03%, up from January’s figure of -0.25%.

“The Leading Index growth rate continues to show signs of improving, hovering around the zero ‘gain line’ over the last four months following fifteen consecutive months of negative, below trend reads,” said Westpac senior economist Matthew Hassan.

Index figures represent rates relative to “trend” GDP growth, which is generally thought to be around 2.75% per annum in Australia. The index is said to lead GDP by “three to nine months into the future” but the highest correlation between the index and actual GDP figures occurs with a three-month lead. The current reading is thus indicative of an annual GDP growth rate of around 2.75% in the next quarter.

Domestic Treasury bond yields fell on the day. By the close of business, 3-year and 10-year ACGB yields had both lost 2bps to 3.58% and 4.02% respectively while the 20-year yield finished 4bps lower at 4.32%.

In the cash futures market, expectations regarding rate cuts later this year softened a touch.  At the end of the day, contracts implied the cash rate would remain close to the current rate for the next few months and average 4.315% through April, 4.295% in May and 4.275% in June. However, August contracts implied a 4.16% average cash rate, November contracts implied 3.985%, while February contract implied 3.82%, 50bps less than the current rate.

“The recent reads are broadly consistent with a more stable growth profile emerging later this year following a long period of soft, below trend outcomes,” Hassan added. “However, the Index growth rate is still some way from signalling the start of a sustained recovery. The detail behind the index also suggests positive, above-trend growth will continue to be elusive for some time yet.”

Click for more news