News

Elevated price levels still feature in March Conf. Board sentiment index

26 March 2024

Summary: Conference Board Consumer Confidence Index down a touch in March, reading less than expected; consumers remain concerned with elevated price levels; US Treasury yields generally decline; expectations of Fed rate cuts soften slightly; ANZ: survey fits with early 2024 evidence of more cautious consumer spending; views of present conditions improve, short-term outlook deteriorates; no real trend to upside or downside by income or age group over past six months.

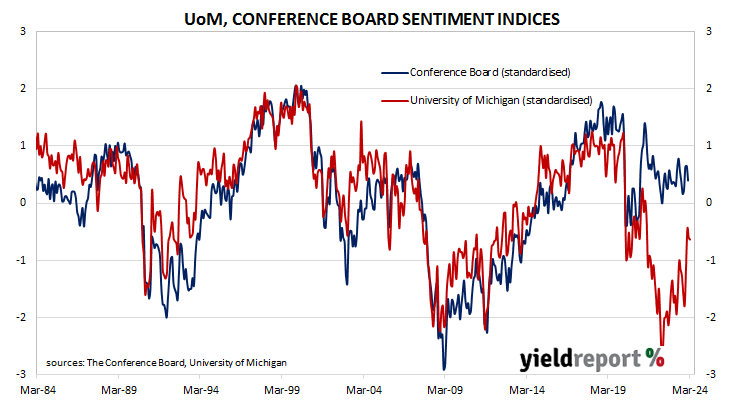
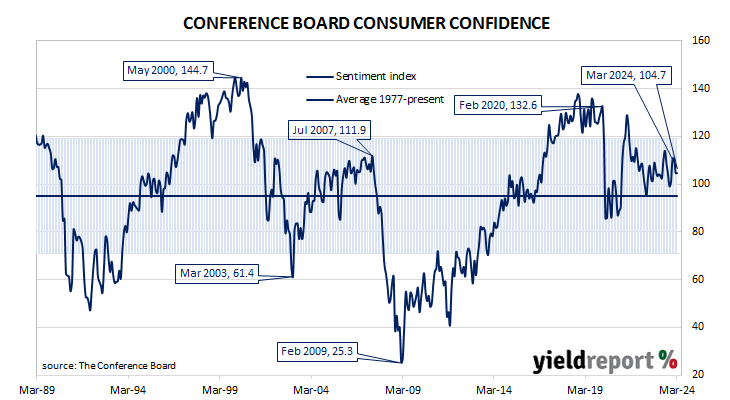
US consumer confidence clawed its way back to neutral over the five years after the GFC in 2008/2009 and then went from strength to strength until late 2018. Measures of consumer confidence then oscillated within a relatively narrow band at historically high levels until they plunged in early 2020. Subsequent readings then fluctuated around the long-term average until March 2021 when they returned to elevated levels. However, a noticeable gap has since emerged between the two most-widely followed surveys.

The latest Conference Board survey held during the first half of March indicated US consumer confidence has remained essentially unchanged after taking a hit in February. March’s Consumer Confidence Index registered 104.7 on a preliminary basis, below the generally-expected figure of 107.0 and down a touch from February’s final figure of 104.8 after it was revised from 106.7.

“Consumers remained concerned with elevated price levels, which predominated write-in responses.,” said Dana M. Peterson, Chief Economist at The Conference Board.

US Treasury yields generally declined on the day. By the close of business, the 2-year Treasury bond yield had lost 3bps to 4.60%, the 10-year yield had returned to its starting point at 4.25% while the 30-year yield finished 1bp lower at 4.41%.

In terms of US Fed policy, expectations of a lower federal funds rate in the next 12 months softened slightly, although several cuts are still factored in. At the close of business, contracts implied the effective federal funds rate would average 5.29% in May, 3bps below the current spot rate, 5.195% in June and 5.13% in July. March 2025 contracts implied 4.375%, 95bps less than the current rate.

“The data fit with early 2024 evidence of more cautious consumer spending,” said ANZ economist Kishti Sen. “If sustained, that should support a return to greater demand/supply balance in the economy given the dominance of private consumption in growth.”

Consumers’ views of present conditions improved while their views of the near-future deteriorated. The Present Situation Index increased from February’s revised figure of 147.6 to 151.0 while the Expectations Index moved down from 76.3 to 73.8.

“Confidence rose among consumers aged 55 and over but deteriorated for those under 55,” Peterson added. “Separately, consumers in the $50,000-$99,999 income group reported lower confidence in March, while confidence improved slightly in all other income groups.” She also noted, however, there has been “no real trend to the upside or downside either by income or age group” over the past six months.

The Consumer Confidence Survey is one of two widely followed monthly US consumer sentiment surveys which produce sentiment indices. The Conference Board’s index is based on perceptions of current business and employment conditions, as well as respondents’ expectations of conditions six months in the future. The other survey, conducted by the University of Michigan, is similar and it is used to produce an Index of Consumer Sentiment. That survey differs in that it does not ask respondents explicitly about their views of the labour market and it also includes some longer-term questions.

Consumer sentiment index declines although inflation less an issue

26 March 2024

Summary: Westpac-Melbourne Institute consumer sentiment index down in March; consumers still deeply pessimistic, becoming more concerned about near-term outlook; ACGB yields increase modestly; rate-cut expectations soften slightly; still some signs of improvement, responses suggest inflation ‘crisis’ less acute; four of five sub-indices lower; more respondents expecting higher jobless rate.

After a lengthy divergence between measures of consumer sentiment and business confidence in Australia which began in 2014, confidence readings of the two sectors converged again in mid-July 2018. Both measures then deteriorated gradually in trend terms, with consumer confidence leading the way. Household sentiment fell off a cliff in April 2020 but, after a few months of to-ing and fro-ing, it then staged a full recovery. However, consumer sentiment has languished at pessimistic levels since mid-2022 while business sentiment has been more robust.

According to the latest Westpac-Melbourne Institute survey conducted in the third week of March, household sentiment has deteriorated and remains at quite a pessimistic level.  Their Consumer Sentiment Index slipped from February’s reading of 86.0 to 84.4, a reading which is still below the “normal” range and significantly lower than the long-term average reading of just over 101.

“The March survey update shows that progress continues to be slow at best,” said Westpac senior economist Matthew Hassan. “Consumers are still deeply pessimistic and becoming more concerned about the economy’s near-term outlook.”

Any reading of the Consumer Sentiment Index below 100 indicates the number of consumers who are pessimistic is greater than the number of consumers who are optimistic.

Commonwealth Government bond yields increased modestly on the day. By the close of business, the 3-year ACGB yield had inched up 1bp to 3.60%, the 10-year yield had added 2bps to 4.04% while the 20-year yield finished 3bps higher at 4.36%.

In the cash futures market, expectations regarding rate cuts later this year softened slightly.  At the end of the day, contracts implied the cash rate would remain close to the current rate for the next few months and average 4.31% through April, 4.295% in May and 4.27% in June. However, August contracts implied a 4.15% average cash rate, November contracts implied 3.965%, while February contract implied 3.81%, 51bps less than the current rate.

“There are still some signs of improvement, particularly in consumer responses to questions on news recall,” added Hassan. ”Inflation continues to dominate the news cycle, but responses suggest the cost-of-living ‘crisis’ has become less acute. Recall levels have eased back to 43% from the 60%+ highs seen last year when the issue was effectively drowning out everything else.”

Four of the five sub-indices registered lower readings, with the “Economic conditions – next 12 months” sub-index posting the largest monthly percentage loss.

The Unemployment Expectations index, formerly a useful guide to RBA rate changes, increased from 126.9 to 128.1. Higher readings result from more respondents expecting a higher unemployment rate in the year ahead.

ifo index up in March; “light on the horizon”

22 March 2024

ifo business climate index rises in March, above expected figure; German economy glimpses light on the horizon; current conditions index up, expectations index up; German, French 10-year yields down noticeably; expectations index implies euro-zone GDP contraction of 1.4% in year to June.

Following recessions in euro-zone economies in 2009/2010, the ifo Institute’s Business Climate Index largely ignored the European debt-crisis of 2010-2012, mostly posting average-to-elevated readings through to early-2020. However, the index was quick to react in the March 2020 survey, falling precipitously before recovering quickly in subsequent months. Readings through much of 2021 generally fluctuated around the long-term average before dropping away in 2022.

According to the latest report released by ifo, German business sentiment improved for a second  consecutive month. March’s Business Climate Index posted a reading of 87.8, above the generally expected figure of 86.0 as well as February’s final reading of 85.7%. The average reading since January 2005 is just over 96.

“In particular, companies’ expectations turned much less pessimistic,” said Clemens Fuest, President of the ifo Institute. “Assessments of the current business situation also improved. The German economy glimpses light on the horizon.”

German firms’ views of current conditions and their collective outlook both improved. The current situation index increased up from February’s revised figure of 86.9 to 88.1 while the expectations index increased from 84.4 after revisions to 87.5.

German and French long-term bond yields finished noticeably lower on the day. By the close of business, the German 10-year yield had shed 9bps to 2.32% while the French 10-year OAT yield finished 5bps lower at 2.79%.

“The rise in business confidence signals that the economy should start to recover in the coming months, “said ANZ senior rates strategist Jack Chambers. “Global trade volumes are picking up, rising real wages will incrementally support future consumption growth and lower European Central Bank rates in the second half of the year will help rekindle demand.”

The ifo Institute’s business climate index is a composite index which combines German companies’ views of current conditions with their outlook for the next six months. It has similarities to consumer sentiment indices in the US such as the ones produced by The Conference Board and the University of Michigan.                                 

It also displays a solid correlation with euro-zone GDP growth rates. However, the expectations index is a better predictor as it has a higher correlation when lagged by one quarter. March’s expectations index implies a 1.4% year-on-year GDP contraction to the end of June. 

US leading index rises; still “some headwinds to growth”

21 March 2024

Summary: Conference Board leading index up 0.1% in February, better than expected; Index still suggests some headwinds to growth; short-term US Treasury yields rise, long-term yields slip; rate-cut expectations soften; regression analysis implies 0.8% contraction in year to May.

The Conference Board Leading Economic Index (LEI) is a composite index composed of ten sub-indices which are thought to be sensitive to changes in the US economy. The Conference Board describes it as an index which attempts to signal growth peaks and troughs; turning points in the index have historically occurred prior to changes in aggregate economic activity. Readings from March and April of 2020 signalled “a deep US recession” while subsequent readings indicated the US economy would recover rapidly. More recent readings have implied US GDP growth rates would turn negative in the first half of 2024.

The latest reading of the LEI indicates it increased by 0.1% in February. The rise contrasted with the 0.1% decline which had been generally expected as well as January’s figure of -0.4%.

“Despite February’s increase, the Index still suggests some headwinds to growth going forward,” said Justyna Zabinska-La Monica of The Conference Board.  “The Conference Board expects annualized US GDP growth to slow over the Q2 to Q3 2024 period, as rising consumer debt and elevated interest rates weigh on consumer spending.”

Short-term US Treasury bond yields rose moderately while longer-term yields slipped a little. By the close of business, the 2-year Treasury yield had gained 4bps to 4.64% while 10-year and 30-year yields both finished 1bp lower at 4.27% and 4.44% respectively.

In terms of US Fed policy, expectations of a lower federal funds rate in the next 12 months softened, although several cuts are still factored in. At the close of business, contracts implied the effective federal funds rate would average 5.295% in May, 3bps below the current spot rate, 5.195% in June and 5.13% in July. March 2025 contracts implied 4.345%, 98bps less than the current rate.

The Conference Board had previously forecast negative GDP growth in the June and September quarters of 2024. Regression analysis suggests the latest reading implies a -0.8% year-on-year growth rate in May, up from -1.0% for the year to April growth rate.

Another modest improvement for euro-zone household sentiment in March

20 March 2024

Summary: Euro-zone consumer sentiment a little less pessimistic again in March, index slightly less than expected; consumer confidence index substantially below long-term average; euro-zone bond yields fall modestly.

EU consumer confidence plunged during the GFC and again in 2011/12 during the European debt crisis. After bouncing back through 2013 and 2014, it fell back significantly in late 2018 but only to a level which corresponds to significant optimism among households. Following the plunge which took place in April 2020, a recovery began a month later, with household confidence returning to above-average levels from March 2021. However, readings subsequent to early 2022 were extremely low by historical standards until recently.

Consumer confidence improved a little more in March according to the latest survey conducted by the European Commission. Its Consumer Confidence Indicator recorded a reading of -14.9, slightly below the generally expected figure of -15.0 as well as February’s reading of -15.5. This latest reading is still substantially below the long-term average of -10.4 and just inside the lower bound of the range in which “normal” readings usually occur.

Sovereign bond yields in major euro-zone bond markets fell modestly on the day. By the close of business, German and French 10-year bond yields had both lost 2bps to 2.43% and 2.87% respectively.

US industrial output, capacity utilisation, basically flat in February

15 March 2024

US industrial output up 0.1% in February, slightly higher than expected; down 0.2% over past 12 months; US Treasury yields rise; rate-cut expectations soften; capacity utilisation rate unchanged at 78.3%, below long-term average.

The Federal Reserve’s industrial production (IP) index measures real output from manufacturing, mining, electricity and gas company facilities located in the United States. These sectors are thought to be sensitive to consumer demand and so some leading indicators of GDP use industrial production figures as a component. US production collapsed through March and April of 2020 before recovering the ground lost over the fifteen months to July 2021. However, production growth has largely stagnated since early 2022.

According to the Federal Reserve, US industrial production expanded by 0.1% on a seasonally adjusted basis in February. The increase was slightly higher than the flat result which had been generally expected and in contrast with January’s 0.5% contraction after it was revised down from -0.1%. On an annual basis the contraction rate slowed from January’s revised figure of 0.3% to 0.2%.

The figures were released on the same day as the University of Michigan’s latest consumer sentiment report and US Treasury yields rose moderately. By the close of business, the 2-year Treasury yield had gained 4bps to 4.73%, the 10-year yield had added 2bps to 4.31% while the 30-year yield finished unchanged at 4.44%.

In terms of US Fed policy, expectations of a lower federal funds rate in the next 12 months softened, although several cuts are still factored in. At the close of business, contracts implied the effective federal funds rate would average 5.33% in March, in line with the current spot rate, 5.325% in April and 5.305% in May. However, September contracts implied a 4.99% rate, 34bps less than the current rate, and March 2025 contracts implied 4.42%, 91bps less than the current rate.

The same report includes capacity utilisation figures which are generally accepted as an indicator of future investment expenditure and/or inflationary pressures. Capacity usage hit a high for the last business cycle in early 2019 before it began a downtrend which ended with April 2020’s multi-decade low of 64.2%. February’s reading remained unchanged at 78.3%, somewhat below the long-term average of 80.1%.

While the US utilisation rate’s correlation with the US jobless rate is solid, it is not as high as the comparable correlation in Australia.

US February retail sales up 0.6%, undershoots forecasts

14 March 2024

Summary: US retail sales up 0.6% in February, less than expected; annual growth rate accelerates to 1.5%; ANZ: component used to calculate US GDP was flat; US Treasury yields rise; 2024 rate-cut expectations soften; higher sales in nine of thirteen categories; “Motor vehicle & parts dealers” again largest single influence on month’s result.

US retail sales had been trending up since late 2015 but, commencing in late 2018, a series of weak or negative monthly results led to a drop-off in the annual growth rate below 2.0%. Growth rates then increased in trend terms through 2019 and into early 2020 until pandemic restrictions sent them into negative territory. A “v-shaped” recovery then took place which was followed by some short-term spikes as federal stimulus payments hit US households in the first and second quarters of 2021.

According to the latest “advance” numbers released by the US Census Bureau, total retail sales increased by 0.6% in February. The result was less than the 0.8% increase which had been generally expected and in contrast with January’s 1.1% drop after it was revised down from -0.8%. On an annual basis, the growth rate accelerated from January’s revised rate of zero to 1.5%.

“The control group, which strips out food services, auto dealers, building materials stores and gasoline stations and is used to calculate GDP, was flat at 0%, compared to a 0.3% fall in January,” said FX analyst Felix Ryan.

The figures came out at the same time as the latest producer price indices and US Treasury bond yields rose noticeably on the day. By the close of business, the 2-year Treasury yield had added 6bps to 4.69%, the 10-year yield had gained 10bps to 4.29% while the 30-year yield finished 9bps higher at 4.44%.

In terms of US Fed policy, expectations of a lower federal funds rate in the next 12 months softened, although several cuts are still currently factored in. At the close of business, contracts implied the effective federal funds rate would average 5.33% in March, in line with the current spot rate, 5.325% in April and 5.305% in May. However, September contracts implied a 4.975% rate, 36bps less than the current rate, while February 2025 contracts implied 4.44%, 89bps less than the current rate.

Nine of the thirteen categories recorded higher sales over the month. The “Motor vehicle & parts dealers” segment again provided the largest single influence on the overall result, rising by 1.6% over the month and contributing 0.30 percentage points to the total.   

The non-store segment includes vending machine sales, door-to-door sales and mail-order sales but nowadays this segment has become dominated by online sales. It accounts for 17% of all US retail sales and it is the second-largest segment after vehicles and parts.

US producer price inflation speeds up in Feb; goods disinflation ending

14 March 2024

Summary: US producer price index (PPI) up 0.6% in February, greater than expected; annual rate accelerates to 1.6%; “core” PPI up 0.3% over month, up 2.0% over year; Citi: disinflation in goods prices ending; US Treasury yields rise; 2024 rate-cut expectations soften; goods prices up 1.2%, services prices up 0.3%.

Around the end of 2018, the annual inflation rate of the US producer price index (PPI) began a downtrend which continued through 2019. Months in which producer prices increased suggested the trend may have been coming to an end, only for it to continue, culminating in a plunge in April 2020. Figures returned to “normal” towards the end of that year but then moved well above the long-term average in 2021 and 2022 before falling back over 2023.

The latest figures published by the Bureau of Labor Statistics indicate producer prices increase by 0.6% after seasonal adjustments in February. The result was greater than the 0.3% increase which had been generally expected as well as January’s 0.3% rise. On a 12-month basis, the rate of producer price inflation after seasonal adjustments and revisions accelerated from January’s revised figure of 1.0% to 1.6%.

Producer prices excluding foods and energy, or “core” PPI, were up 0.3% after seasonal adjustments. The result was in line with expectations but less than January’s 0.5% increase. The annual growth rate remained unchanged at 2.0%.

“Rising goods prices in PPI reinforce our expectation that the disinflation in goods prices over much of last year has largely come to an end,” said Citi Chief Economist Veronica Clark.

The figures came out at the same time as the latest retail sales report and US Treasury bond yields rose noticeably on the day. By the close of business, the 2-year Treasury yield had added 6bps to 4.69%, the 10-year yield had gained 10bps to 4.29% while the 30-year yield finished 9bps higher at 4.44%.

In terms of US Fed policy, expectations of a lower federal funds rate in the next 12 months softened, although several cuts are still currently factored in. At the close of business, contracts implied the effective federal funds rate would average 5.33% in March, in line with the current spot rate, 5.325% in April and 5.305% in May. However, September contracts implied a 4.975% rate, 36bps less than the current rate, while February 2025 contracts implied 4.44%, 89bps less than the current rate.

The BLS stated two thirds of the rise of the index was attributable to a 1.2% increase in goods prices. The final demand services index increased by 0.3%.

The producer price index is a measure of prices received by producers for domestically produced goods, services and construction. It is put together in a fashion similar to the consumer price index (CPI) except it measures prices received from the producer’s perspective rather than from the perspective of a retailer or a consumer. It is another one of the various measures of inflation tracked by the US Fed, along with core personal consumption expenditure (PCE) price data. 

Euro-zone ind. production reverses Dec gain, down 3.2% in Jan

13 March 2024

Summary: Euro-zone industrial production down 3.2% in January, worse than expected; down 6.7% on annual basis; all major categories down except energy; German, French 10-year yields up.

Following a recession in 2009/2010 and the debt-crisis which flowed from it, euro-zone industrial production recovered and then reached a peak four years later in 2016. Growth rates then fluctuated for two years before beginning a steady and persistent slowdown from the start of 2018. That decline was transformed into a plunge in March and April of 2020 which then took over a year to claw back. Production levels in recent quarters have generally stagnated in trend terms.

According to the latest figures released by Eurostat, euro-zone industrial production contracted by 3.2% in January on a seasonally-adjusted and calendar-adjusted basis. The fall was greater than the expected 1.8% contraction and in contrast with December’s 1.6% increase after it was revised down from 2.6%. On an annual basis, the expansion rate decreased from December’s revised rate of 0.2% to -6.7%.

“Energy production lifted slightly year-on-year but all other major categories fell, including a 12.1% year-on-year fall in capital goods and an 8.4% fall in durable consumer goods,” said ANZ senior economist Blair Chapman.

German and French sovereign bond yields both rose on the day despite the figures. By the close of business, the German 10-year bond yield had gained 5bps to 2.37% while the French 10-year yield had added 3bps to 2.81%.

US CPI up 0.4% in Feb; shelter components “likely to remain strong”

12 March 2024

Summary: US CPI up 0.4% in February, in line with expectations; annual inflation rate rises from 3.1% to 3.2%; “core” rate also up 0.4%, up 3.8% over year; Citi: shelter components of CPI likely to remain strong; Treasury yields rise; rate-cut expectations soften; ANZ: 3-month annualised pace is 6.64%, 6-month annualised pace is 5.76; prices of non-energy services main driver again.

The annual rate of US inflation as measured by changes in the consumer price index (CPI) halved from nearly 3% in the period from July 2018 to February 2019. It then fluctuated in a range from 1.5% to 2.0% through 2019 before rising above 2.0% in the final months of that year. Substantially lower rates were reported from March 2020 to May 2020 and they remained below 2% until March 2021. Rates then rose significantly before declining from mid-2022.

The latest US CPI figures released by the Bureau of Labor Statistics indicated seasonally-adjusted consumer prices rose by 0.4% on average in February. The increase was in line with expectations but up a notch from January’s 0.3% rise. On a 12-month basis, the inflation rate accelerated from 3.1% to 3.2%.

“Headline” inflation is known to be volatile and so references are often made to “core” inflation for analytical purposes. The core prices index, the index which excludes the more variable food and energy components, also increased by 0.4% on a seasonally-adjusted basis over the month, above consensus expectations of a 0.3% rise. However, the annual growth rate still slowed from 3.9% to 3.8%.

“OER (Owner-Equivalent Rent) moderated to 0.44% after a very strong 0.56% increase in January, helping to reduce the risk of persistently stronger shelter over the next few months,” said Citi economist Veronica Clark. “But we would still caution that shelter components of CPI are likely to remain strong.”

US Treasury bond yields increased on the day. By the close of business, 2-year and 10-year Treasury yields had both gained 6bps to 4.59% and 4.16% respectively while the 30-year yield finished 4bps higher at 4.31%.

In terms of US Fed policy, expectations of a lower federal funds rate in the next 12 months softened, although several cuts are still currently factored in. At the close of business, contracts implied the effective federal funds rate would average 5.33% in March, in line with the current spot rate, 5.325% in April and 5.295% in May. However, September contracts implied a 4.92% rate, 41bps less than the current rate, while February 2025 contracts implied 4.35%, 98bps less than the current rate.

“The 3-month annualised pace is 6.64%, the 6-month annualised pace is 5.76%,” said ANZ economist Kishti Sen. “Given the post-COVID seasonality issues around January-February period, the Fed will look for the data to settle from March.”

The largest influence on headline results is often the change in fuel prices. Prices of “Energy commodities”, the segment which contains vehicle fuels, increased by 0.8% and contributed 0.12 percentage points to the total. However, prices of non-energy services, the segment which includes actual and implied rents, again had the largest effect on the total, adding 0.30 percentage points after increasing by 0.5% on average.

Click for more news