News

Economy remains “resilient”, inflation still a challenge: NAB February survey

12 March 2024

Summary: Business conditions improve in February; signals economy remained resilient in new year; business pessimism increases slightly, confidence index noticeably below average; ACGB yields move very little; rate-cut expectations almost unchanged; further progress on inflation unlikely to be smooth over months ahead; capacity utilisation rate declines, still at elevated level.

NAB’s business survey indicated Australian business conditions were robust in the first half of 2018, with a cyclical-peak reached in April of that year. Readings from NAB’s index then began to slip and forecasts of a slowdown in the domestic economy began to emerge in the first half of 2019 as the index trended lower. It hit a nadir in April 2020 as pandemic restrictions were introduced but then improved markedly over the next twelve months and has subsequently remained at robust levels.

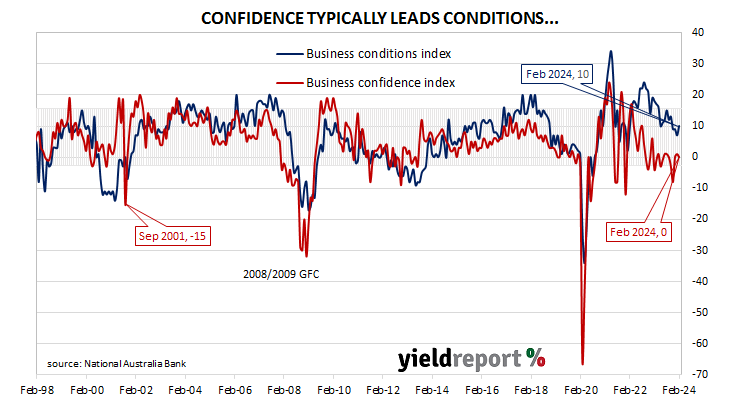
According to NAB’s latest monthly business survey of around 500 firms conducted in the week and a half after the middle of February, business conditions improved to a level which is above the long-term average. NAB’s conditions index registered 10 points, up 3 points from January’s revised reading.

“Business conditions rose in February, with the survey signalling the economy remained resilient in the new year and inflation is still a challenge despite slowing growth,” said NAB Chief Economist Alan Oster.

Business confidence deteriorated slightly.  NAB’s confidence index slipped from January’s reading of 1 point to zero,  a reading which is noticeably below the long-term average.  Typically, NAB’s confidence index leads the conditions index by one month, although some divergences have appeared from time to time.

“Despite the signs of resilience, confidence and forward orders both eased to remain mired at low levels, and capacity utilisation also eased,” added Oster.

Commonwealth Government bond yields moved very little on the day. By the close of business, 3-year and 10-year ACGB yields had each returned to their starting points at 3.58% and 3.96% respectively while the 20-year yield finished 1bp  lower at 4.27%.

In the cash futures market, expectations regarding rate cuts later this year and early next year remained almost unchanged.  At the end of the day, contracts implied the cash rate would remain close to the current rate for the next few months and average 4.31% through March, 4.305% in April and 4.27% in May. However, August contracts implied 4.10%, November contracts implied 3.905% and February 2025 contracts 3.75%, 57bps less than the current rate.

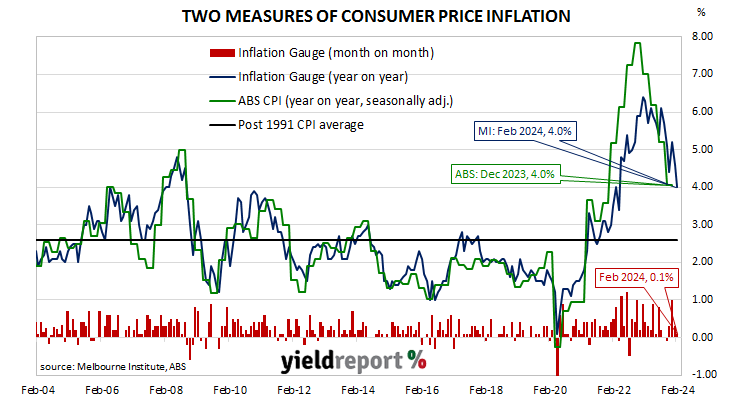
Inflation pressures continued to attract attention in the report. “Retail price growth, in particular, rose sharply to 1.4% in quarterly terms after slowing over the Christmas/New Year period, in a sign that further progress on inflation is unlikely to be smooth over the months ahead.”

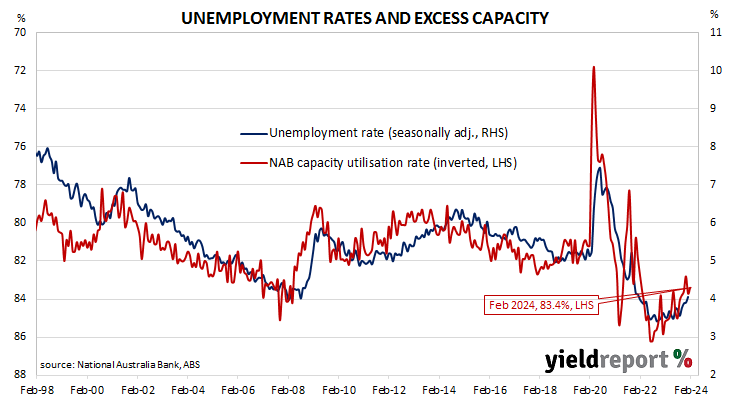
NAB’s measure of national capacity utilisation declined, from January’s revised reading of 83.7% to 83.4%, a level which is still quite elevated from a historical perspective. All eight sectors of the economy were reported to be operating at or above their respective long-run averages.

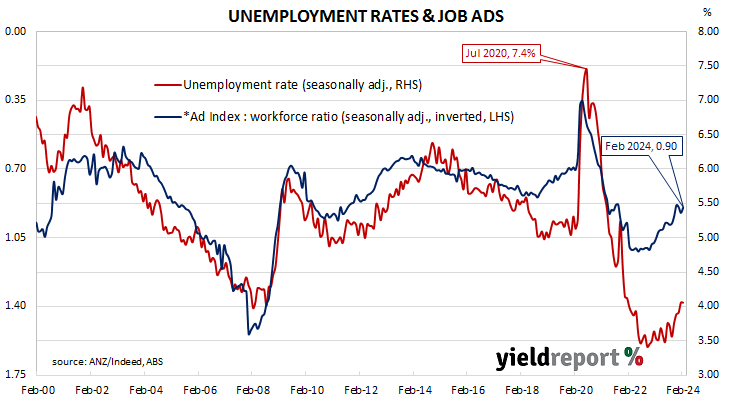
Capacity utilisation is generally accepted as an indicator of future investment expenditure and it also has a strong inverse relationship with Australia’s unemployment rate.

“Healthy” US labour market adds more jobs than expected in Feb

08 March 2024

Summary: US non-farm payrolls up 275,000 in February, above expectations; previous two months’ figures revised down by 167,000; ANZ: US labour market still healthy; jobless rate rises to 3.9%, participation rate unchanged at 62.5%; short-term US Treasury yields down a little, longer-term yields up slightly; expectations of Fed rate cuts in 2024 firm; employed-to-population ratio slips to 60.1%; underutilisation rate ticks up to 7.3%; annual hourly pay growth slows to 4.3%.

The US economy ceased producing jobs in net terms as infection controls began to be implemented in March 2020. The unemployment rate had been around 3.5% but that changed as job losses began to surge through March and April of 2020. The May 2020 non-farm employment report represented a turning point and subsequent months provided substantial employment gains which continued through into 2021, 2022 and 2023.

According to the US Bureau of Labor Statistics, the US economy created an additional 275,000 jobs in the non-farm sector in February. The increase was considerably higher than the 190,000 rise which had been generally expected and greater than the 329,000 jobs which had been added in January. Employment figures for December and January were revised down by a total of 167,000.

“The broad picture is that the labour market is still healthy, and the Fed will read this report as an affirmation of its patient stance,” said ANZ Head of Australian Economics Adam Boyton. “The market, however, saw it as a dovish report overall.”

The total number of unemployed increased by 334,000 to 6.458 million while the total number of people who were either employed or looking for work increased by 150,000 to 167.426 million. These changes led to the US unemployment rate rising from January’s figure of 3.7% to 3.9%. The participation rate remained unchanged at 62.5%.

US Treasury yields declined at the short end of the curve on the day while longer-term yields were steady or slightly higher. By the close of business, the 2-year yield had lost 2bps to 4.49%, the 10-year yield had returned to its starting point at 4.09% while the 30-year yield finished 1bp higher at 4.26%.

In terms of US Fed policy, expectations of a lower federal funds rate in the next 12 months firmed, with several cuts currently factored in. At the close of business, contracts implied the effective federal funds rate would average 5.325% in March, essentially in line with the current spot rate, 5.32% in April and 5.265% in May. However, September contracts implied a 4.85% rate, 48bps less than the current rate, while February 2025 contracts implied 4.235%, 109bps less than the current rate.

One figure which is indicative of the “spare capacity” of the US employment market is the employment-to-population ratio. This ratio is simply the number of people in work divided by the total US population. It hit a cyclical-low of 58.2 in October 2010 before slowly recovering to just above 61% in late-2019. February’s reading slipped from 60.2% to 60.1%, some way from the April 2000 peak reading of 64.7%.

Apart from the unemployment rate, another measure of tightness in the labour market is the underutilisation rate and the latest reading of it registered 7.3%, up from 7.2% in January. Wage inflation and the underutilisation rate usually have an inverse relationship; hourly pay growth in the year to February declined from 4.4% after revisions to 4.3%.

Home loan approvals fall again in January

07 March 2024

Summary: Value of loan commitments down 3.9% in January, contrasts with expected gain; 8.5% higher than January 2023; Westpac: rate rise may had more material influence on housing markets; ACGB yields up a little; rate-cut expectations firm slightly; value of owner-occupier loan approvals down 4.6%; investor approvals down 2.6%; number of owner-occupier home loan approvals down 2.6%; UBS: falls somewhat surprising given dwelling prices growth.

The number and value of home-loan approvals began to noticeably increase after the RBA reduced its cash rate target in a series of cuts beginning in mid-2019, potentially ending the downtrend which had been in place since mid-2017. Figures from February through to May of 2020 provided an indication the downtrend was still intact but subsequent figures then pushed both back to record highs in 2021. However, there has been a considerable pullback since then, although the total value of new loans is still elevated by historical standards.

January’s housing finance figures have now been released and total loan approvals excluding refinancing decreased by 3.9% In dollar terms over the month, in contrast with the 2.0% rise which had been generally expected and quite close to December’s 4.1% fall. On a year-on-year basis, total approvals excluding refinancing were still up 8.5%, down from the previous month’s comparable figure of 11.5%.

“Overall, the update suggests November’s interest rate rise may have had a more material influence on markets,” said Westpac senior economist Matthew Hassan. “Housing turnover weakened into year-end with price growth also softening. Prospects look a little better in early 2024 although gains in finance are likely to remain sluggish.”

Commonwealth Government bond yields crept a little higher on the day. By the close of business, the 3-year ACGB yields had added 1bps to 3.63%, the 10-year yield had returned to its starting point at 4.02% while the 20-year yield finished 1bp higher at 4.34%.

In the cash futures market, expectations regarding rate cuts later this year and early next year firmed slightly.  At the end of the day, contracts implied the cash rate would remain close to the current rate for the next few months and average 4.315% through March, 4.30% in April and 4.27% in May. However, August contracts implied 4.135%, November contracts implied 3.96% and February 2025 contracts 3.815%, 52bps less than the current rate.

The total value of owner-occupier loan commitments excluding refinancing decreased by 4.6%, up from December’s 5.6% fall. However, on an annual basis, owner-occupier loan commitments were 3.4% higher than in January 2023, down from 7.0% in December.

The total value of investor commitments excluding refinancing decreased by 2.6%. The fall follows a 1.6% decline in December, taking the growth rate over the previous 12 months from 20.2% to 18.5%.

The total number of loan commitments to owner-occupiers excluding refinancing decreased by 2.6% to 24581 on a seasonally adjusted basis, a smaller fall than December’s 6.9% drop. The annual growth rate slowed from 3.2% after revisions to 1.7%.

“These falls are somewhat surprising, given dwelling prices growth picked up again in recent months, and there was no obvious material change in the trend of volumes or lending standards” said UBS economist George Tharenou. “We presume there will be a bounce in coming months, but the trend now suggests that housing credit growth will be steady ahead, rather than picking up.”

US quit rate declines in January; “jumping jobs for higher pay” trend subsides

06 March 2024

Summary: US quit rate declines to 2.1% in January; ANZ: trend of jumping jobs for higher pay has subsided; short-term US Treasury yields up a little, longer-term yields down; expectations of Fed rate cuts in 2024 soften; fewer quits, separations, openings.

The number of US employees who quit their jobs as a percentage of total employment increased slowly but steadily after the GFC. It peaked in March 2019 and then tracked sideways until virus containment measures were introduced in March 2020. The quit rate then plummeted as alternative employment opportunities rapidly dried up. Following the easing of US pandemic restrictions, it proceeded to recover back to its pre-pandemic rate in the third quarter of 2020 and trended higher through 2021 before easing through 2022 and 2023.

Figures released as part of the latest Job Openings and Labor Turnover Survey (JOLTS) report show the quit rate declined in January. 2.1% of the non-farm workforce left their jobs voluntarily, down from 2.2% in December. Quits in the month fell by 54,000 while an additional 353,000 people were employed in non-farm sectors.

ANZ economist Madeline Dunk said, “…the trend of jumping jobs for higher pay has subsided.”

Short-term US Treasury yields crept a little higher while longer-term yields fell. By the close of business, the 2-year Treasury bond yield had inched up 1bp to 4.56%, the 10-year yield had lost 2bps to 4.11% while the 30-year yield finished 3bps lower at 4.24%.

In terms of US Fed policy, expectations of a lower federal funds rate in the next 12 months softened a touch, albeit with several cuts still factored in. At the close of business, contracts implied the effective federal funds rate would average 5.325% in March, essentially in line with the current spot rate, 5.32% in April and 5.175% in June. February 2025 contracts implied 4.31%, 102bps less than the current rate.

The fall in total quits was led by 45,000 fewer resignations in the “Health care and social assistance” and “Retail trade” sectors while the “Accommodation and food services” sector experienced the largest gain, rising by 51,000. Overall, the total number of quits for the month decreased from December’s revised figure of 3.439 million to 3.385 million.                

Total vacancies at the end of January decreased by 26,000, or 0.3%, from December’s revised figure of 8.889 million to 8.863 million. The decline was driven by a 170,000 loss in the “Retail trade” sector while the “Accommodation and food services” sector experienced the single largest increase, rising by 94,000. Overall, 9 out of 18 sectors experienced fewer job openings than in the previous month.  

Total separations decreased by 78,000, or 1.4%, from December’s revised figure of 5.419 million to 5.341 million. The fall was led by the “Health care and social assistance” sector where there were 86,000 fewer separations. Separations decreased in 11 of the 18 sectors.

The “quit” rate time series produced by the JOLTS report is a leading indicator of US hourly pay. As wages account for around 55% of a product’s or service’s price in the US, wage inflation and overall inflation rates tend to be closely related. Former Federal Reserve chief and current Treasury Secretary Janet Yellen was known to pay close attention to it.

Job ads index resumes downtrend in Feb; scope for higher jobless rate

04 March 2024

Summary: Job ads down 2.8% in February; 12.3% lower than February 2023; ANZ: index resumes downward trend; ACGB yields fall moderately; rate-cut expectations firm; ANZ: scope for jobless rate to rise further; ad index-to-workforce ratio declines.

From mid-2017 onwards, year-on-year growth rates in the total number of Australian job advertisements consistently exceeded 10%. That was until mid-2018 when the annual growth rate fell back markedly. 2019 was notable for its reduced employment advertising and this trend continued into the first quarter of 2020. Advertising then plunged in April and May of 2020 as pandemic restrictions took effect but recovered quite quickly, reaching historically-high levels in 2022.

According to the latest reading of the ANZ-Indeed Job Ads Index, total job advertisements in February fell by 2.8% on a seasonally adjusted basis. The index fell from 136.6 in January after revisions to 132.8 and it follows gains of 3.4% in January and 0.6% in December. On a 12-month basis, total job advertisements were 12.3% lower than in February 2023, down from January’s revised figure of -11.6%.

“ANZ-Indeed Job Ads resumed its downward trend in February, falling 2.8%,” said ANZ economist Madeline Dunk. “This follows a softer than expected labour force survey in January, where hours worked fell 2.5%, employment grew by just 500 and the unemployment rate rose to 4.1%.”

The update was released on the same day as the Melbourne Institute’s latest Inflation Gauge reading and January dwelling approvals data and  Commonwealth Government bond yields fell moderately on the day, lagging noticeable falls of US Treasury yields on Friday night. By the close of business, the 3-year ACGB yield had lost 3bps to 3.68%, the 10-year yield had shed 4bps to 4.12% while the 20-year yield finished 2bps lower at 4.43%.

In the cash futures market, expectations regarding rate cuts later this year firmed.  At the end of the day, contracts implied the cash rate would remain close to the current rate for the next few months and average 4.315% through March, 4.305% in April and 4.27% in May. However, August contracts implied 4.15%, November contracts implied 3.98% and February 2025 contracts 3.85%, 48bps less than the current rate.

“The downward movement in Job Ads suggests there is scope for the unemployment rate to rise further, as do recent changes in labour market flows,” Dunk added. “That said, we think most of the near-term adjustment in the labour market will be via a fall in hours worked rather than employment.”

The inverse relationship between job advertisements and the unemployment rate has been quite strong (see below chart), although ANZ themselves called the relationship between the two series into question in early 2019. A higher job advertisement index as a proportion of the labour force is suggestive of lower unemployment rates in the near future while a lower ratio suggests higher unemployment rates will follow. February’s ad index-to-workforce ratio declined from 0.92 after revisions to 0.90.

In 2008/2009, advertisements plummeted and Australia’s unemployment rate jumped from 4% to nearly 6% over a period of 15 months. When a more dramatic fall in advertisements took place in April 2020, the unemployment rate responded much more quickly.

Melb. Institute Inflation Gauge up just 0.1% in Feb

04 March 2024

Melbourne Institute Inflation Gauge index up 0.1% in February; up 4.0% on annual basis; ACGB yields fall moderately; rate-cut expectations firm.

The Melbourne Institute’s Inflation Gauge is an attempt to replicate the ABS consumer price index (CPI) on a monthly basis. It has turned out to be a reliable leading indicator of the CPI, although there are periods in which the Inflation Gauge and the CPI have diverged for as long as twelve months. On average, the Inflation Gauge’s annual rate tends to overestimate the ABS rate by around 0.1%, or at least until recently.

The Melbourne Institute’s latest reading of its Inflation Gauge index indicates consumer prices increased by just 0.1% in February, following rises of 0.3% and 1.0% in January and December respectively. The index rose by 4.0% on an annual basis, down from January’s comparable figure of 4.6%.

The update was released on the same day as ANZ’s latest Job Ads report and January dwelling approvals data and  Commonwealth Government bond yields fell moderately on the day, lagging noticeable falls of US Treasury yields on Friday night. By the close of business, the 3-year ACGB yield had lost 3bps to 3.68%, the 10-year yield had shed 4bps to 4.12% while the 20-year yield finished 2bps lower at 4.43%.

In the cash futures market, expectations regarding rate cuts later this year firmed.  At the end of the day, contracts implied the cash rate would remain close to the current rate for the next few months and average 4.315% through March, 4.305% in April and 4.27% in May. However, August contracts implied 4.15%, November contracts implied 3.98% and February 2025 contracts 3.85%, 48bps less than the current rate.

Central bankers desire a certain level of inflation which is “sufficiently low that it does not materially distort economic decisions in the community” but high enough so it does not constrain “a central bank’s ability to combat recessions.”

“Super-core” PCE inflation indicates “stickiness” in January

29 February 2024

Summary: US core PCE price index up 0.4% in January, as expected; annual rate slows to 2.8%; ANZ: “super-core” inflation at 3.46% indicates degree of stickiness; Treasury yields fall modestly; Fed rate-cut expectations for 2024 soften a touch; ANZ: some price gains look uncharacteristically strong, expects decline in coming months.

One of the US Fed’s favoured measures of inflation is the change in the core personal consumption expenditures (PCE) price index. After hitting the Fed’s target at the time of 2.0% in mid-2018, the annual rate then hovered in a range between 1.8% and 2.0% before it eased back to a range between 1.5% and 1.8% through 2019. It then plummeted below 1.0% in April 2020 before rising back to around 1.5% in the September quarter of that year. It has since increased significantly and still remains above the Fed’s target even after recent declines.

The latest figures have now been published by the Bureau of Economic Analysis as part of the January personal income and expenditures report. Core PCE prices rose by 0.4% over the month, in line with expectations but up from December’s 0.1% increase. On a 12-month basis, the core PCE inflation rate slowed from December’s rate of 2.9% to 2.8%.

“The super-core measure of PCE inflation, which makes up half of the PCE deflator, rose 0.6%,” said ANZ Head of FX Research Mahjabeen Zaman. “That was its biggest monthly gain since December 2021. The annual rate of super-core inflation was 3.46% versus 3.35% in December, indicating a degree of stickiness.”

US Treasury bond yields fell modestly on the day. By the close of business, 2-year and 10-year Treasury bond yields had both lost 2bps to 4.63% and 4.25% respectively while the 30-year yield finished 3bps lower at 4.37%.

In terms of US Fed policy, expectations of a lower federal funds rate in the next 12 months softened a touch, albeit with several cuts still factored in. At the close of business, contracts implied the effective federal funds rate would average 5.325% in March, essentially in line with the current spot rate, 5.32% in April and 5.195% in June. February 2025 contracts implied 4.375%, 95bps less than the current rate.

“However, some of the price gains within that category looked uncharacteristically strong and we expect they will subside in coming months,” added Zaman. “Prices for financial and insurance services, for example, rose 1.33%.”

The core version of PCE strips out energy and food components, which are volatile from month to month, in an attempt to identify the prevailing trend. It is not the only measure of inflation used by the Fed; the Fed also tracks the Consumer Price Index (CPI) and the Producer Price Index (PPI) from the Department of Labor. However, it is the one measure which is most often referred to in FOMC minutes.

“Choppy” retail sales continues in January; up 1.1%

29 February 2024

Summary: Retail sales up 1.1% in January, less than expected; up 1.1% on 12-month basis; ANZ: retail sales up just 0.4% over past 3 months; ACGB yields fall; rate-cut expectations firm; Westpac: “choppy” data pattern reflects difficulties adjusting for seasonal pattern shift associated with Black Friday sales; largest influence on result again from household goods sales.

Growth figures of domestic retail sales spent most of the 2010s at levels below the post-1992 average. While economic conditions had been generally favourable, wage growth and inflation rates were low. Expenditures on goods then jumped in the early stages of 2020 as government restrictions severely altered households’ spending habits. Households mostly reverted to their usual patterns as restrictions eased in the latter part of 2020 and throughout 2021.

According to the latest ABS figures, total retail sales rose by 1.1% on a seasonally adjusted basis in January. The rise was less than the 1.5% increase which had been generally expected and it contrasted with December’s upwardly revised 2.1% loss. Sales also increased by 1.1% on an annual basis, up from December’s comparable figure of 0.8% after revisions.

“Seasonal changes due to the increasing importance of Black Friday sales have skewed the data,” said ANZ economist Madeline Dunk. “But over the three months to January retail sales grew just 0.4%, which compares to 0.4% over the same period in 2023 and 5.2% in 2022.”

Commonwealth Government bond yields moved lower on the day, largely in line with movements of US Treasury yields overnight. By the close of business, 3-year and 10-year ACGB yields had both lost 3bps to 3.70% and 4.15% respectively while the 20-year yield finished 4bps lower at 4.45%.

In the cash futures market, expectations regarding rate cuts later this year firmed.  At the end of the day, contracts implied the cash rate would remain close to the current rate for the next few months and average 4.31% through March, 4.30% in April and 4.275% in May. However, August contracts implied a 4.16% average cash rate while November contracts implied 3.995%, 33bps less than the current rate.

“Sales continue move through a very choppy period,” said Westpac senior economist Matthew Hassan. “The January lift follows a sharp 2.1% drop in December and a 1.5% surge in November. The pattern reflects difficulties the ABS is having adjusting for a shift in seasonal patterns associated with the increasingly popular ‘Black Friday’ sales. Pinpointing these shifts is difficult and typically requires the accumulation of more months of observations.”

Retail sales are typically segmented into six categories (see below), with the “Food” segment accounting for 40% of total sales. However, the largest influences on the month’s total once again came from the “Household goods” segment where sales rose by 2.3% over the month.

Private credit maintains 0.4% growth rate in January

29 February 2024

Private sector credit up 0.4% in January, in line with expectations; annual growth rate ticks up to 4.9%; ACGB yields fall; rate-cut expectations firm; business segment accounts for over 45% of net growth.

The pace of lending growth in the non-bank private sector by financial institutions in Australia followed a steady-but-gradual downtrend from late 2015 through to early 2020 before hitting what appears to be a nadir in March 2021. That downtrend ended later in that same year and annual growth rates shot up through 2022, peaking in September/October before easing through 2023.

According to the latest RBA figures, private sector credit increased by 0.4% in January. The result was in line with consensus expectations as well as the previous three months’ growth figures. On an annual basis, the growth rate ticked up from December’s figure of 4.8% to 4.9%.

Commonwealth Government bond yields moved lower on the day, largely in line with movements of US Treasury yields overnight. By the close of business, 3-year and 10-year ACGB yields had both lost 3bps to 3.70% and 4.15% respectively while the 20-year yield finished 4bps lower at 4.45%.

In the cash futures market, expectations regarding rate cuts later this year firmed.  At the end of the day, contracts implied the cash rate would remain close to the current rate for the next few months and average 4.31% through March, 4.30% in April and 4.275% in May. However, August contracts implied a 4.16% average cash rate while November contracts implied 3.995%, 33bps less than the current rate.

Business lending each accounted for a bit more than 45% of the net growth over the month while owner-occupier lending accounted for around 40%. Investor lending accounted for the balance.     

The traditional driver of overall loan growth, the owner-occupier segment, grew by 0.4% over the month, in line with the previous six months. The sector’s 12-month growth rate remained steady at 4.8%.

Total lending in the non-financial business sector increased by 0.7%, up from 0.6% in December after revisions. Growth on an annual basis picked up from 6.6% to 6.8%.

Monthly growth in the investor-lending segment slowed to a near-halt in early 2018 and essentially stayed that way until mid-2021. In January, net lending rose by 0.2%, in line with December’s growth rate, accelerating the 12-month growth rate from 3.0% to 3.1%.

Total personal loans increased by 0.2%, in contrast with December’s 0.1% contraction, while the annual growth rate remained unchanged at 1.2%. This category of debt includes fixed-term loans for large personal expenditures, credit cards and other revolving credit facilities.

Euro-zone sentiment index slips in February

28 February 2024

Summary: Euro-zone composite sentiment indicator down slightly in February, below expectations; readings down in four of five sectors; down in all four largest euro-zone economies; German, French 10-year yields decline slightly; index implies annual GDP growth rate of 0.3%.

The European Commission’s Economic Sentiment Indicator (ESI) is a composite index comprising five differently weighted sectoral confidence indicators.  It is heavily weighted towards confidence surveys from the business sector, with the consumer confidence sub-index only accounting for 20% of the ESI. However, it has a good relationship with euro-zone GDP growth rates, although not necessarily as a leading indicator.

The ESI posted a reading of 95.4 in February, below the generally-expected figure of 96.6 and down slightly from January’s revised reading of 95.8. The average reading since 1985 is just under 100.

Long-term German and French 10-year bond yields declined slightly on the day. By the close of business, German and French 10-year yields had both slipped 1bp to 2.45% and 2.93% respectively.

Confidence deteriorated in four of the five sectors of the economy. On a geographical basis, the ESI decreased in all four of the euro-zone’s largest economies.

End-of-quarter ESI readings and annual euro-zone GDP growth rates are highly correlated. This latest reading corresponds to a year-to-February GDP growth rate of 0.3%, down from January’s implied growth rate of 0.4%.

Click for more news