News

Construction growth “cooling”; Dec quarter up 0.7%

28 February 2024

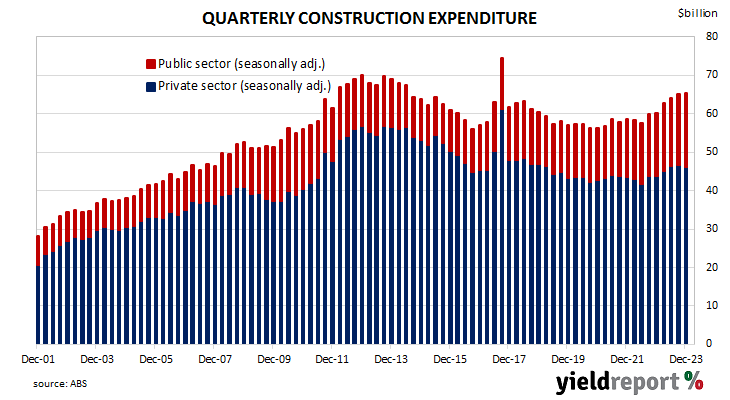
Summary: Construction spending up 0.7%, largely as expected; up 8.7% from December 2022 quarter; Westpac: figures confirmation growth is cooling; ACGB yields increase; rate-cut expectations largely unchanged; Westpac: construction work catches up with earlier mini-jump in project starts; residential sector down 5.2%, non-residential building up 5.0%, engineering up 2.7%.

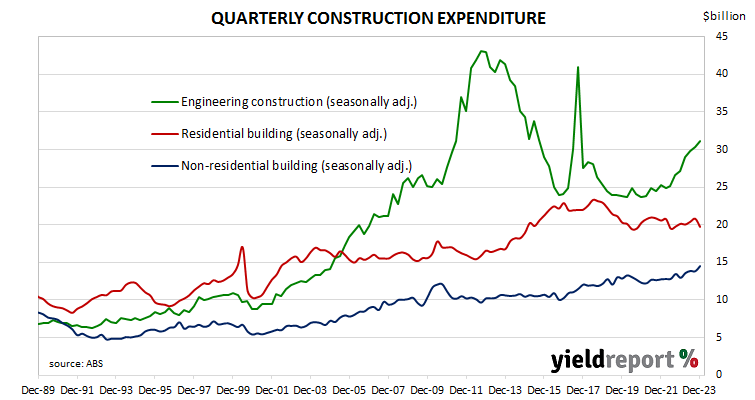
Construction expenditure increased substantially in Australia in the early part of last decade following a more-steady expansion through the 2000s. A large portion of the increase came from the commissioning of new projects and the expansion of existing ones to exploit a tripling in price of Australia’s mining exports in the previous decade.

According to the latest construction figures published by the ABS, total construction in the December quarter increased by 0.7% on a seasonally adjusted basis. The result was essentially in line with the 0.8% increase which had been generally expected but it was down from the September quarter’s 1.4% increase after revisions. On an annual basis, the growth rate sped up a little from 8.5% to 8.7%.

“This provides further confirmation that the growth pace is cooling, stepping down from 11.4%yr to June 2023, to a 1.4% rise for September quarter 2023 and now the 0.7% outcome for December,” said Westpac senior economist Andrew Hanlan.

The figures came out on the same day as the latest monthly inflation figures and Commonwealth Government bond yields increased across the curve on the day. By the close of business, the 3-year ACGB yield had crept up 1bps to 3.73%, the 10-year yield had gained 3bps to 4.18% while the 20-year yield finished 4bps higher at 4.49%.

In the cash futures market, expectations regarding rate cuts later this year remained largely unchanged.  At the end of the day, contracts implied the cash rate would remain close to the current rate for the next few months and average 4.31% through March, 4.30% in April and 4.27% in May. However, August contracts implied a 4.16% average cash rate while November contracts implied 4.005%, 32bps less than the current rate.

“The cycle has matured; the level of construction work has caught up with the earlier mini-jump in project starts,” Hanlan added. “That jump in project starts was largely an artefact of COVID delays, with longer lead times in the construction sector for non-residential projects.”

Residential building construction expenditures decreased by 5.2%, in contrast with the 1.9% rise in the December quarter after revisions. On an annual basis, expenditure in this segment was 1.9% lower than the December 2022 quarter, down from the September quarter’s 5.2% increase.

Non-residential building spending increased by 5.0%, in contrast with from the previous quarter’s 0.2% decline. On an annual basis, expenditures were 12.1% higher than the December 2022 quarter, whereas the September quarter’s comparable figure was 2.8% after revisions.

Engineering construction increased by 2.7% in the quarter, a modestly larger increase than the 1.8% rise in the September quarter. On an annual basis, spending in this segment was 15.0% higher than the December 2022 quarter, up from the September quarter’s comparable figure of 13.9% after revisions.

Quarterly construction data compiled and released by the ABS are not considered to be of a “primary” nature, unlike unemployment (Labour Force) and inflation (CPI) figures. However, the figures are viewed by economists and analysts with interest as they directly feed into quarterly GDP figures which are next due in early March.

Conf. Board sentiment index falls in Feb; “broad-based”

27 February 2024

Summary: Conference Board Consumer Confidence Index falls in February, reading less than expected; drop in confidence broad-based; short-term US Treasury yields down, longer-term yields up; expectations of Fed rate cuts in 2024 soften slightly; views of present conditions, short-term outlook both deteriorate; inflation the main preoccupation of consumers but less concerned about food, fuel prices.

US consumer confidence clawed its way back to neutral over the five years after the GFC in 2008/2009 and then went from strength to strength until late 2018. Measures of consumer confidence then oscillated within a relatively narrow band at historically high levels until they plunged in early 2020. Subsequent readings then fluctuated around the long-term average until March 2021 when they returned to elevated levels. However, a noticeable gap has since emerged between the two most-widely followed surveys.

The latest Conference Board survey held during the first three weeks of February indicated US consumer confidence has taken a hit after improving for the previous three months. February’s Consumer Confidence Index registered 106.7 on a preliminary basis, well below the generally-expected figure of 114.8 and down from January’s final figure of 110.9 after it was revised from 114.8.

“The drop in confidence was broad-based, affecting all income groups except households earning less than $15,000 and those earning more than $125,000,” said Dana Peterson, Chief Economist at The Conference Board. “Confidence deteriorated for consumers under the age of 35 and those 55 and over, whereas it improved slightly for those aged 35 to 54.”

Short-term US Treasury yields declined on the day while longer-term yields rose moderately. By the close of business, the 2-year Treasury bond yield had lost 2bps to 4.70%, the 10-year yield had gained 3bps to 4.31% while the 30-year yield finished 4bps higher at 4.44%.

In terms of US Fed policy, expectations of a lower federal funds rate in the next 12 months softened slightly, albeit with several cuts still factored in. At the close of business, contracts implied the effective federal funds rate would average 5.33% in March, in line with the current spot rate, 5.325% in April and 5.21% in June. February 2025 contracts implied 4.43%, 90bps less than the current rate.

Consumers’ views of present conditions and their views of the near-future both deteriorated. The Present Situation Index decreased from January’s revised figure of 154.9 to 147.2 while the Expectations Index moved down from 81.5 to 79.8.

“February’s write-in responses revealed that while overall inflation remained the main preoccupation of consumers, they are now a bit less concerned about food and gas prices, which have eased in recent months,” Peterson added. However, she noted expressed more concerns regarding the labour market and the state of US politics.

The Consumer Confidence Survey is one of two widely followed monthly US consumer sentiment surveys which produce sentiment indices. The Conference Board’s index is based on perceptions of current business and employment conditions, as well as respondents’ expectations of conditions six months in the future. The other survey, conducted by the University of Michigan, is similar and it is used to produce an Index of Consumer Sentiment. That survey differs in that it does not ask respondents explicitly about their views of the labour market and it also includes some longer-term questions.

Minor improvement for euro-zone household sentiment in Feb

21 February 2024

Summary: Euro-zone consumer sentiment a little less pessimistic in February, index more slightly than expected; consumer confidence index well below long-term average; euro-zone bond yields rise materially.

EU consumer confidence plunged during the GFC and again in 2011/12 during the European debt crisis. After bouncing back through 2013 and 2014, it fell back significantly in late 2018 but only to a level which corresponds to significant optimism among households. Following the plunge which took place in April 2020, a recovery began a month later, with household confidence returning to above-average levels from March 2021. However, readings subsequent to early 2022 were extremely low by historical standards until recently.

Consumer confidence improved a little in February according to the latest survey conducted by the European Commission. Its Consumer Confidence Indicator recorded a reading of -15.5, slightly above the generally expected figure of -15.8 as well as January’s reading of -16.1. This latest reading is still well below the long-term average of -10.4 and below the lower end of the range in which “normal” readings usually occur.

Sovereign bond yields in major euro-zone bond markets rose materially on the day. By the close of business, the German and French 10-year bond yields had both gained 7bps to 2.45% and 2.93% respectively.

Stuck in below-trend growth rut: Westpac-MI leading index back down in Jan

21 February 2024

Summary: Leading index growth rate down in January; economy stuck in below-trend growth rut; reading implies annual GDP growth of around 2.5%; ACGB yields decline modestly; rate-cut expectations firm; set to remain subdued in near-term but growth pulse improved in last 12 months.

Westpac and the Melbourne Institute describe their Leading Index as a composite measure which attempts to estimate the likely pace of Australian economic growth in the short-term. After reaching a peak in early 2018, the index trended lower through 2018 and 2019 before plunging to recessionary levels in the second quarter of 2020. Subsequent readings spiked towards the end of 2020 but then trended lower through 2021 and 2022 before flattening out in 2023.

January’s reading has now been released and the six month annualised growth rate of the indicator registered -0.25%, down from December’s revised figure of -0.01%.

“The Australian economy remains stuck in a below-trend growth rut,” said Westpac senior economist Matthew Hassan. “While the Leading Index growth rate has improved on the weak reads seen through most of last year, it remains in negative territory, overall implying the economy will continue to see sub-par growth well into 2024.”

Index figures represent rates relative to “trend” GDP growth, which is generally thought to be around 2.75% per annum in Australia. The index is said to lead GDP by “three to nine months into the future” but the highest correlation between the index and actual GDP figures occurs with a three-month lead. The current reading is thus indicative of an annual GDP growth rate of around 2.50% in the next quarter.

Domestic Treasury bond yields declined modestly on the day. By the close of business, the 3-year ACGB yield had lost 2bps to 3.72% while 10-year and 20-year yields both finished 1bp lower at 4.19% and 4.51% respectively.

In the cash futures market, expectations regarding rate cuts later this year firmed a little.  At the end of the day, contracts implied the cash rate would remain close to the current rate for the next few months and average 4.305% through March, 4.295% in April and 4.265% in May. However, August contracts implied a 4.125% average cash rate while November contracts implied 3.97%, 36bps less than the current rate.

“Momentum looks set to remain subdued near-term but the growth pulse has definitely improved on a year ago,” Hassan added.  “Over the first half of 2023, the Leading Index growth rate ranged between –0.75 and –1%, well below the –0.25% pace recorded in January.”

No recession, just near-zero growth; US CB leading index down again in Jan

20 February 2024

Summary: Conference Board leading index down 0.4% in January, worse than expected; index currently does not signal recession ahead; US Treasury yields fall; rate-cut expectations firm; expects to near-zero real GDP growth in Q2, Q3; regression analysis implies 1.0% contraction in year to April.

The Conference Board Leading Economic Index (LEI) is a composite index composed of ten sub-indices which are thought to be sensitive to changes in the US economy. The Conference Board describes it as an index which attempts to signal growth peaks and troughs; turning points in the index have historically occurred prior to changes in aggregate economic activity. Readings from March and April of 2020 signalled “a deep US recession” while subsequent readings indicated the US economy would recover rapidly. More recent readings have implied US GDP growth rates would turn negative in the second half of 2023 or the first half of 2024.

The latest reading of the LEI indicates it decreased by 0.4% in January. The fall was slightly worse than the 0.3% decrease which had been generally expected as well as December’s revised figure of -0.2%.

“While the declining LEI continues to signal headwinds to economic activity, for the first time in the past two years, six out of its ten components were positive contributors over the past six-month period ending in January 2024,” said Justyna Zabinska-La Monica of The Conference Board.  

US Treasury bond yields fell on the day. By the close of business, the 2-year Treasury yield had shed 4bps to 4.61%, the 10-year yield had lost 2bps to 4.27% while the 30-year yield finished 1bp lower at 4.44%.

In terms of US Fed policy, expectations of a lower federal funds rate in the next 12 months generally firmed, with several cuts factored in. At the close of business, contracts implied the effective federal funds rate would average 5.32% in March, slightly below the current spot rate, 5.31% in April and 5.235% in May. February 2025 contracts implied 4.26%, 107bps less than the current rate.

“As a result, the leading index currently does not signal recession ahead,” added Zabinska-La Monica. “While no longer forecasting a recession in 2024, we do expect real GDP growth to slow to near zero percent over Q2 and Q3.”

The Conference Board had previously forecast negative GDP growth in the June and September quarters of 2024. Regression analysis suggests the latest reading implies a -1.0% year-on-year growth rate in April, unchanged from the year to March growth rate after revisions to the previous month’s LEI.

US January retail sales disappoint; lower Q1 GDP forecasts likely

15 February 2024

Summary: US retail sales down 0.8% in January, fall worse than expected; annual growth rate slows to 0.6%; ANZ: will push down US Q1 GDP estimates, potentially bring Fed rate cuts forward; US Treasury yields fall modestly; rate-cut expectations largely unchanged; lower sales in nine of thirteen categories; “Motor vehicle & parts dealers” largest single influence on month’s result.

US retail sales had been trending up since late 2015 but, commencing in late 2018, a series of weak or negative monthly results led to a drop-off in the annual growth rate below 2.0%. Growth rates then increased in trend terms through 2019 and into early 2020 until pandemic restrictions sent them into negative territory. A “v-shaped” recovery then took place which was followed by some short-term spikes as federal stimulus payments hit US households in the first and second quarters of 2021.

According to the latest “advance” numbers released by the US Census Bureau, total retail sales fell by 0.8% in January. The result was worse than the 0.2% decline and in contrast with December’s 0.4% rise after it was revised from 0.6%. On an annual basis, the growth rate slowed from December’s revised rate of 5.3% to 0.6%.

“Control group retail sales were -0.4% versus expectation of +0.2%,” ANZ Head of FX Research Mahjabeen Zaman. “The muted sales will push down early estimates of Q1 GDP and potentially put earlier rate cuts by the Fed back on the table.”

The figures were released on the same day as the latest industrial production report and US Treasury yields fell modestly. By the close of business, the 2-year Treasury yield had slipped 1bp to 4.57%, the 10-year yield had lost 2bps to 4.24% while the 30-year yield finished 3bps lower at 4.41%.

In terms of US Fed policy, expectations of a lower federal funds rate in the next 12 months remained largely unchanged, with several cuts factored in. At the close of business, contracts implied the effective federal funds rate would average 5.315% in March, slightly below the current spot rate, 5.305% in April and 5.22% in May. February 2025 contracts implied 4.21%, 112bps less than the current rate.

Nine of the thirteen categories recorded lower sales over the month. The “Motor vehicle & parts dealers” segment provided the largest single influence on the overall result, falling by 1.7% over the month and contributing -0.32 percentage points to the total.    

The non-store segment includes vending machine sales, door-to-door sales and mail-order sales but nowadays this segment has become dominated by online sales. It accounts for 17% of all US retail sales and it is the second-largest segment after vehicles and parts.

US industrial output stagnating; 0.1% contraction in January

15 February 2024

US industrial output down 0.1% in January, contrasts with expected gain; flat over past 12 months; US Treasury yields fall modestly; rate-cut expectations largely unchanged; capacity utilisation rate declines to 78.5%, 0.6ppts below long-term average.

The Federal Reserve’s industrial production (IP) index measures real output from manufacturing, mining, electricity and gas company facilities located in the United States. These sectors are thought to be sensitive to consumer demand and so some leading indicators of GDP use industrial production figures as a component. US production collapsed through March and April of 2020 before recovering the ground lost over the fifteen months to July 2021. However, production growth has largely stagnated since early 2022.

According to the Federal Reserve, US industrial production contracted by 0.1% on a seasonally adjusted basis in January. The decline contrasted with the consensus expectations of a 0.4% rise and it was under December’s flat result after it was revised down from 0.1%. On an annual basis the growth slowed from December’s revised figure of 1.2% to zero.

The figures were released on the same day as the latest retail sales figures and US Treasury yields fell modestly. By the close of business, the 2-year Treasury yield had slipped 1bp to 4.57%, the 10-year yield had lost 2bps to 4.24% while the 30-year yield finished 3bps lower at 4.41%.

In terms of US Fed policy, expectations of a lower federal funds rate in the next 12 months remained largely unchanged, with several cuts factored in. At the close of business, contracts implied the effective federal funds rate would average 5.315% in March, slightly below the current spot rate, 5.305% in April and 5.22% in May. February 2025 contracts implied 4.21%, 112bps less than the current rate.

The same report includes capacity utilisation figures which are generally accepted as an indicator of future investment expenditure and/or inflationary pressures. Capacity usage hit a high for the last business cycle in early 2019 before it began a downtrend which ended with April 2020’s multi-decade low of 64.2%. January’s reading fell from December’s upwardly-revised figure of 78.7% to 78.5%, 0.6 percentage points below the long-term average of 80.1%.

While the US utilisation rate’s correlation with the US jobless rate is solid, it is not as high as the comparable correlation in Australia.

Euro-zone industrial production jumps; Dec quarter GDP flat

14 February 2024

Euro-zone industrial production up 2.6% in December, contrasts with expected modest contraction; up 1.2% on annual basis; German, French 10-year yields down noticeably; output contracts in two of four largest euro economies; December quarter GDP flat, up just 0.1% on annual basis.

Following a recession in 2009/2010 and the debt-crisis which flowed from it, euro-zone industrial production recovered and then reached a peak four years later in 2016. Growth rates then fluctuated for two years before beginning a steady and persistent slowdown from the start of 2018. That decline was transformed into a plunge in March and April of 2020 which then took over a year to claw back. Production levels in recent quarters have generally stagnated in trend terms.

According to the latest figures released by Eurostat, euro-zone industrial production expanded by 2.6% in December on a seasonally-adjusted and calendar-adjusted basis. The jump contrasted with the expected 0.2% contraction and it was much greater than November’s 0.4% increase. On an annual basis, the expansion rate increased from November’s revised rate of -5.4% to 1.2%.

German and French sovereign bond yields both fell noticeably on the day despite the figures. By the close of business, the German and French 10-year bond yields had both shed 7bps to 2.33% and 2.82% respectively.

Industrial production contracted in two of the euro-zone’s four largest economies. Germany’s production fell by 1.2% over the month while the comparable figures for France, Spain and Italy were +1.1%, -0.4% and 1.1% respectively.

The report came out at the same time as the latest euro-zone GDP figures. December quarter GDP growth was flat and up just 0.1% for the full year.

US bond yields jump, rate cut expectations soften after January CPI report

13 February 2024

Summary: US CPI up 0.3% in January, above expectations; “core” rate up 0.4%; Citi: services inflation proving to be sticky; Treasury yields jump; rate-cut expectations soften; ANZ: shelter inflation proving slow to fall; prices of non-energy services main driver again.

The annual rate of US inflation as measured by changes in the consumer price index (CPI) halved from nearly 3% in the period from July 2018 to February 2019. It then fluctuated in a range from 1.5% to 2.0% through 2019 before rising above 2.0% in the final months of that year. Substantially lower rates were reported from March 2020 to May 2020 and they remained below 2% until March 2021. Rates then rose significantly before declining from mid-2022.

The latest US CPI figures released by the Bureau of Labor Statistics indicated seasonally-adjusted consumer prices rose by 0.3% on average in January. The increase was above the 0.2% rise which had been generally expected as well as December’s 0.2% rise after it was revised down from 0.3%. However, on a 12-month basis, the inflation rate slowed from 3.3% to 3.1%.

“Headline” inflation is known to be volatile and so references are often made to “core” inflation for analytical purposes. The core prices index, the index which excludes the more variable food and energy components, increased by 0.4% on a seasonally-adjusted basis over the month, above consensus expectations of a 0.3% rise. The annual growth rate remained steady at 3.9%.

“Core CPI in January was clearly much stronger than we had expected, but reinforced our view that services inflation would prove sticky,” said Citi economist Veronica Clark. “While many elements that we expected to be weak…did decline, this was more than offset by strength in services prices.”

US Treasury bond yields jumped on the day. By the close of business, the 2-year Treasury yield had gained 18bps to 4.65%, the 10-year yield had increased by 14bps to 4.31% while the 30-year yield finished 10bps higher at 4.47%.

In terms of US Fed policy, expectations of a lower federal funds rate in the next 12 months softened, albeit with several cuts still factored in. At the close of business, contracts implied the effective federal funds rate would average 5.315% in March, slightly below the current spot rate, 5.305% in April and 5.23% in May. February 2025 contracts implied 4.305%, 102bps less than the current rate.

“The 3-month annualised rate of core CPI rose to 4.0% vs 3.3% in December,” observed ANZ economist Kishti Sen. “That was the highest reading since June. The 6-month annualised pace was 3.6% vs 3.2% and the highest pace since September….Shelter inflation is proving slow to fall.”

The largest influence on headline results is often the change in fuel prices. Prices of “Energy commodities”, the segment which contains vehicle fuels, decreased by 3.2% and contributed -1.1 percentage points to the total. However, prices of non-energy services, the segment which includes actual and implied rents, again had the largest effect on the total, adding 0.43 percentage points after increasing by 0.7% on average.

February consumer sentiment picks up; remains at pessimistic level

13 February 2024

Summary: Westpac-Melbourne Institute consumer sentiment index up in February; moderating inflation, interest-rate expectations main factors behind lift; ACGB yields increase modestly; rate-cut expectations soften; responses over survey week show sharp turnaround post-RBA policy decision; all five sub-indices higher; fewer respondents expecting higher jobless rate.

After a lengthy divergence between measures of consumer sentiment and business confidence in Australia which began in 2014, confidence readings of the two sectors converged again in mid-July 2018. Both measures then deteriorated gradually in trend terms, with consumer confidence leading the way. Household sentiment fell off a cliff in April 2020 but, after a few months of to-ing and fro-ing, it then staged a full recovery. However, consumer sentiment has deteriorated significantly over the past two years, while business sentiment has been more robust.

According to the latest Westpac-Melbourne Institute survey conducted in the second week of February, household sentiment has improved but remains at quite a pessimistic level.  Their Consumer Sentiment Index rose from January’s reading of 81.0 to 86.0, a reading which is still below the “normal” range and significantly lower than the long-term average reading of just over 101.

“While sentiment is still firmly pessimistic there finally looks to be some light at the end of the tunnel for Australian consumers,” said Westpac senior economist Matthew Hassan. “Moderating inflation and shifting expectations for interest rates appear to be the main factors behind the lift, with some additional support coming from the prospect of broader income tax cuts later in the year.”

Any reading of the Consumer Sentiment Index below 100 indicates the number of consumers who are pessimistic is greater than the number of consumers who are optimistic.

The figures came out on the same day as the latest NAB Business survey and Commonwealth Government bond yields increased modestly on the day. By the close of business, 3-year and 10-year ACGB yields had each added 1bp to 3.75% and 4.19$% respectively while the 20-year yield finished 2bps higher at 4.49%.

In the cash futures market, expectations regarding rate cuts later this year softened.  At the end of the day, contracts implied the cash rate would remain close to the current rate for the next few months and average 4.305% through March, 4.29% in April and 4.255% in May. However, August contracts implied a 4.145% average cash rate while November contracts implied 3.99%, 34bps less than the current rate.

“Responses over the survey week show a sharp turnaround midweek, following the announcement of the RBA Board’s February policy decision,” added Hassan. “Those surveyed prior to the decision recorded a sentiment index read of 94.1. Those surveyed post the decision recorded a sentiment read of just 80.”

All five sub-indices registered higher readings, with the “Time to buy a major household item” sub-index posting the largest monthly percentage gain.

The Unemployment Expectations index, formerly a useful guide to RBA rate changes, fell from 130.7 to 126.9. Lower readings result from fewer respondents expecting a higher unemployment rate in the year ahead.

Click for more news