News

Conditions soften, confidence improves in NAB January survey

13 February 2024

Summary: Business conditions deteriorate again in January; led by pull-back in services sectors; business pessimism lessens, index still noticeably below average; ACGB yields increase modestly; rate-cut expectations soften; elevated rates of cost growth for labour, other inputs; capacity utilisation rate rises, at elevated level.

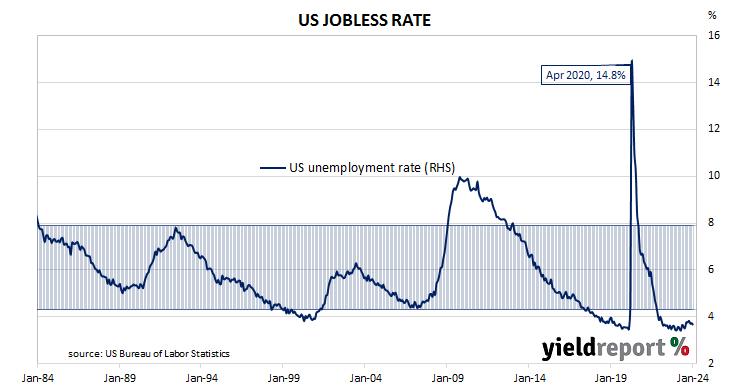
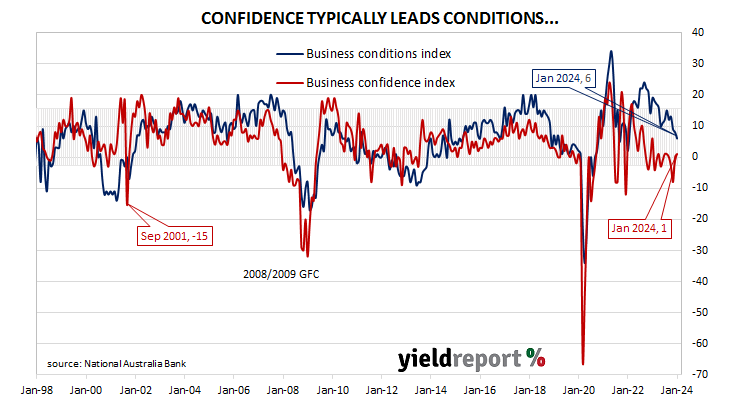
NAB’s business survey indicated Australian business conditions were robust in the first half of 2018, with a cyclical-peak reached in April of that year. Readings from NAB’s index then began to slip and forecasts of a slowdown in the domestic economy began to emerge in the first half of 2019 as the index trended lower. It hit a nadir in April 2020 as pandemic restrictions were introduced but then improved markedly over the next twelve months and has subsequently remained at robust levels.

According to NAB’s latest monthly business survey of around 500 firms conducted in last week of January, business conditions have deteriorated again, albeit to a level which is just below average. NAB’s conditions index registered 6 points, down 2 points from December’s revised reading.

“The easing in conditions in January was led by a pull-back in the services sectors though conditions in retail also remain weak,” said NAB Chief Economist Alan Oster.

Business confidence improved for a second consecutive month.  NAB’s confidence index rose from December’s revised reading of zero to 1 point, although it is still noticeably below the long-term average.  Typically, NAB’s confidence index leads the conditions index by one month, although some divergences have appeared from time to time.

The figures came out on the same day as the latest Westpac-Melbourne Institute consumer survey and Commonwealth Government bond yields increased modestly. By the close of business, 3-year and 10-year ACGB yields had each added 1bp to 3.75% and 4.19% respectively while the 20-year yield finished 2bps higher at 4.49%.

In the cash futures market, expectations regarding rate cuts later this year softened.  At the end of the day, contracts implied the cash rate would remain close to the current rate for the next few months and average 4.305% through March, 4.29% in April and 4.255% in May. However, August contracts implied a 4.145% average cash rate while November contracts implied 3.99%, 34bps less than the current rate.

Inflation pressures received quite a bit of attention in the report. “Nonetheless, capacity utilisation remained elevated after rebounding in the month and businesses continued to report elevated rates of cost growth for both labour and other inputs. There was a noticeable pick up in reported price growth in retail and across product prices more generally, indicating that firms still have at least some scope to pass through cost pressures to consumers.”

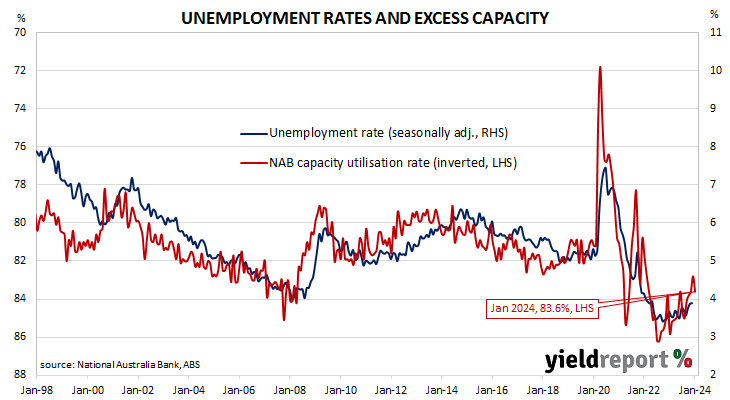
NAB’s measure of national capacity utilisation increased, from December’s revised reading of 82.8% to 83.6%, a level which is quite elevated from a historical perspective. Seven of the eight sectors of the economy were reported to be operating at or above their respective long-run averages.

Capacity utilisation is generally accepted as an indicator of future investment expenditure and it also has a strong inverse relationship with Australia’s unemployment rate.

Job ads index stabilises “at still-elevated level” in January

05 February 2024

Summary: Job ads up 1.7% in January; 14.7% lower than January 2023; ANZ: stabilisation at still-elevated level highlights labour market resilience; ACGB yields rise sharply; rate-cut expectations soften; ad index-to-workforce ratio ticks up.

From mid-2017 onwards, year-on-year growth rates in the total number of Australian job advertisements consistently exceeded 10%. That was until mid-2018 when the annual growth rate fell back markedly. 2019 was notable for its reduced employment advertising and this trend continued into the first quarter of 2020. Advertising then plunged in April and May of 2020 as pandemic restrictions took effect but recovered quite quickly, reaching historically-high levels in 2022.

According to the latest ANZ-Indeed figures, total advertisements rose by 1.7% in January on a seasonally adjusted basis. The result followed a gain of 0.7% in December and a loss of 5.3% in November. On a 12-month basis, total job advertisements were 13.0% lower than in January 2023, up from December’s revised figure of -14.7%.

“ANZ-Indeed Job Ads has risen 2.3% over the past two months, following a steady decline over the previous 12 months,” said ANZ economist Madeline Dunk. “This stabilisation at a still-elevated level highlights the labour market’s resilience. There is no doubt the labour market is cooling, but we do not expect to see a significant downturn anytime soon.”

Commonwealth Government bond yields rose sharply on the day following similar movements of US Treasury yields on Friday night. By the close of business, the 3-year ACGB yields had gained 13bps to 3.65%, the 10-year yield had added 12bps to 4.11% while the 20-year yield finished 10bps higher at 4.41%.

In the cash futures market, expectations regarding rate cuts later this year softened.  At the end of the day, contracts implied the cash rate would remain close to the current rate for the next few months and average 4.305% through March, 4.285% in April and 4.25% in May. However, August contracts implied a 4.095% average cash rate while November contracts implied 3.90%, 43bps less than the current rate.

The inverse relationship between job advertisements and the unemployment rate has been quite strong (see below chart), although ANZ themselves called the relationship between the two series into question in early 2019. A higher job advertisement index as a proportion of the labour force is suggestive of lower unemployment rates in the near future while a lower ratio suggests higher unemployment rates will follow. January’s ad index-to-workforce ratio inched up from 0.90 to 0.91 after revisions.

In 2008/2009, advertisements plummeted and Australia’s unemployment rate jumped from 4% to nearly 6% over a period of 15 months. When a more dramatic fall in advertisements took place in April 2020, the unemployment rate responded much more quickly.

Private inflation measure slows in January

05 February 2024

Melbourne Institute Inflation Gauge index up 0.3% in January; up 4.6% on annual basis; ACGB yields rise sharply; rate-cut expectations soften.

The Melbourne Institute’s Inflation Gauge is an attempt to replicate the ABS consumer price index (CPI) on a monthly basis. It has turned out to be a reliable leading indicator of the CPI, although there are periods in which the Inflation Gauge and the CPI have diverged for as long as twelve months. On average, the Inflation Gauge’s annual rate tends to overestimate the ABS rate by around 0.1%, or at least until recently.

The Melbourne Institute’s latest reading of its Inflation Gauge index indicates consumer prices increased by 0.3% in January, following rises of 1.0% and 0.3% in December and November respectively. The index rose by 4.6% on an annual basis, down from December’s comparable figure of 5.2%.

Commonwealth Government bond yields rose sharply on the day following similar movements of US Treasury yields on Friday night. By the close of business, the 3-year ACGB yields had gained 13bps to 3.65%, the 10-year yield had added 12bps to 4.11% while the 20-year yield finished 10bps higher at 4.41%.

In the cash futures market, expectations regarding rate cuts later this year softened.  At the end of the day, contracts implied the cash rate would remain close to the current rate for the next few months and average 4.305% through March, 4.285% in April and 4.25% in May. However, August contracts implied a 4.095% average cash rate while November contracts implied 3.90%, 43bps less than the current rate.

Central bankers desire a certain level of inflation which is “sufficiently low that it does not materially distort economic decisions in the community” but high enough so it does not constrain “a central bank’s ability to combat recessions.”

Bond yields jump on strong January US jobs report

02 February 2024

Summary: US non-farm payrolls up 353,000 in December, above expectations; previous two months’ figures revised up by 126,000; jobless rate steady at 3.7%, participation rate steady at 62.5%; ANZ: 3-month average payrolls twice as strong as FOMC officials had assumed; employed-to-population ratio ticks up to 60.2%; underutilisation rate up; annual hourly pay growth up.

The US economy ceased producing jobs in net terms as infection controls began to be implemented in March 2020. The unemployment rate had been around 3.5% but that changed as job losses began to surge through March and April of 2020. The May 2020 non-farm employment report represented a turning point and subsequent months provided substantial employment gains which continued through into 2021, 2022 and 2023.

According to the US Bureau of Labor Statistics, the US economy created an additional 353,000 jobs in the non-farm sector in January. The increase was considerably higher than the 168,000 rise which had been generally expected and slightly more than the 333,000 jobs which had been added in December. Employment figures for November and December were revised up by a total of 126,000.

“Three-month average payrolls have surged to 289,000, nearly twice as strong as senior FOMC officials had assumed,” said ANZ FX analyst Felix Ryan. “Wage growth is firming, with average hourly earnings up 0.6%, the fastest rise since March 2022. This measure of wage growth has been creeping higher…”

The total number of unemployed decreased by 144,000 to 6.124 million while the total number of people who were either employed or looking for work decreased by 175,000 to 167.276 million. These changes led to the US unemployment rate remaining unchanged from December’s figure of 3.7% while the participation rate remained steady at 62.5%.

US Treasury yields rose significantly across the curve on the day. By the close of business, the 2-year yield had gained 17bps to 4.37%, the 10-year yield had added 16bps to 4.02% while the 30-year yield finished 12bps higher at 4.22%.

In terms of US Fed policy, expectations of a lower federal funds rate in the next 12 months softened, albeit with several cuts still factored in. At the close of business, contracts implied the effective federal funds rate would average 5.30% in March, slightly below the current spot rate, 5.27% in April and 5.10% in May. January 2025 contracts implied 4.07%, 126bps less than the current rate.

One figure which is indicative of the “spare capacity” of the US employment market is the employment-to-population ratio. This ratio is simply the number of people in work divided by the total US population. It hit a cyclical-low of 58.2 in October 2010 before slowly recovering to just above 61% in late-2019. January’s reading ticked up from 60.1% to 60.2%, still some way from the April 2000 peak reading of 64.7%.

Apart from the unemployment rate, another measure of tightness in the labour market is the underutilisation rate and the latest reading of it registered 7.2%, up from 7.1% in December. Wage inflation and the underutilisation rate usually have an inverse relationship; hourly pay growth in the year to January rose from  at 4.3% after revisions to 4.5%.

January ISM PMI improves; manufacturing contracting at “marginal rate”

01 February 2024

ISM PMI up in January, above expectations; US manufacturing continues contraction at marginal rate; US Treasury yields fall, especially at long end; expectations of Fed rate cuts in 2024 barely change; ISM: reading corresponds to 1.9% US GDP growth annualised.

The Institute of Supply Management (ISM) manufacturing Purchasing Managers Index (PMI) reached a cyclical peak in September 2017. It then started a downtrend which ended in March 2020 with a contraction in US manufacturing which lasted until June 2020. Subsequent month’s readings implied growth had resumed, with the index becoming stronger through to March 2021. Readings then declined fairly steadily until mid-2023.

According to the ISM’s January survey, its PMI recorded a reading of 49.1%, above the generally expected figure of 47.3% as well as December’s revised reading of 47.1%. The average reading since 1948 is roughly 53.0% and any reading below 50% implies a contraction in the US manufacturing sector relative to the previous month.

“The US manufacturing sector continued to contract, though at a marginal rate compared to December. Demand improved, output remained stable and inputs are accommodative,” said Timothy Fiore of the ISM Manufacturing Business Survey Committee.

US Treasury yields fell on the day, especially at the long end of the yield curve. By the close of business, the 2-year Treasury bond yield had lost 4bps to 4.20%, the 10-year yield had shed 11bps to 3.86% while the 30-year yield finished 13bps lower at 4.10%.

In terms of US Fed policy, expectations of a lower federal funds rate in the next 12 months barely changed. At the close of business, contracts implied the effective federal funds rate would average 5.32% in February,  essentially in line with the current spot rate, 5.285% in March and 5.225% in April. However, January 2025 contracts implied 3.835%, 150bps less than the current rate.

Purchasing managers’ indices (PMIs) are economic indicators derived from monthly surveys of executives in private-sector companies. They are diffusion indices, which means a reading of 50% represents no change from the previous period, while a reading under 50% implies respondents reported a deterioration on average.

A reading “above 48.7%, over a period of time, generally indicates an expansion of the overall economy”, according to the ISM.     The ISM’s manufacturing PMI figures appear to lead US GDP by several months despite a considerable error in any given month. The chart below shows US GDP on a “year on year” basis (and not the BEA annualised basis) against US GDP implied by monthly PMI figures. 

According to the ISM and its analysis of past relationships between the PMI and US GDP, January’s PMI corresponds to an annualised growth rate of 1.9%, or 0.5% over a quarter. Regression analysis on a year-on-year basis suggests a 12-month GDP growth rate of 2.2% five months after this latest report.

The ISM index is one of two monthly US PMIs, the other being an index published by S&P Global. S&P Global produces a “flash” estimate in the last week of each month which comes out about a week before the ISM index is published. The S&P Global flash January manufacturing PMI registered 50.3%, up 2.4 percentage points from December’s final figure.

December private credit up 0.4%; “year of subdued growth”

31 January 2024

Private sector credit up 0.4% in December, in line with expectations; annual growth rate increases to 4.8%; Westpac: rounds out year of subdued growth; ACGB yields fall significantly; rate-cut expectations harden; owner-occupiers, business segments each account for around 45% of net growth.

The pace of lending growth in the non-bank private sector by financial institutions in Australia followed a steady-but-gradual downtrend from late 2015 through to early 2020 before hitting what appears to be a nadir in March 2021. That downtrend ended later in that same year and annual growth rates shot up through 2022, peaking in September/October before easing through 2023.

According to the latest RBA figures, private sector credit increased by 0.4% in December. The result was in line with consensus expectations as well as the previous two months’ growth. On an annual basis, the growth rate increased slightly from November’s figure of 4.7% to 4.8%.

“Private sector credit rose by a subdued 0.4% in the December quarter, rounding out a year of subdued growth,” said Westpac senior economist Andrew Hanlan. “This subdued credit growth occurred in an environment of elevated interest rates and a sluggish economy, as well as an economy operating at a high level of capacity, with unemployment still near historic lows and a housing market where demand is outstripping limited supply.”

The figures came out at the same time as the latest CPI report and Treasury bond yields moved significantly lower on the day. By the close of business, the 3-year ACGB yield had shed 15bps to 3.54%, the 10-year yield had lost 13bps to 4.03% while the 20-year yield finished 12bp lower at 4.34%.

In the cash futures market, expectations regarding rate cuts later this year hardened.  At the end of the day, contracts implied the cash rate would remain close to the current rate for the next few months and average 4.315% through February, 4.30% in March and 4.275% in April. However, August contracts implied a 4.015% average cash rate while November contracts implied 3.81%, 52bps less than the current rate.

Owner-occupier lending and business lending each accounted for around 45% of the net growth over the month. Investor lending accounted for the balance.      

The traditional driver of overall loan growth, the owner-occupier segment, grew by 0.4% over the month, in line with the previous five months. The sector’s 12-month growth rate ticked up from 4.6% to 4.7%.

Total lending in the non-financial business sector increased by 0.5%, the same as in the previous month after revisions. Growth on an annual basis picked up from 6.5% to 6.6%.

Monthly growth in the investor-lending segment slowed to a near-halt in early 2018 and essentially stayed that way until mid-2021. In December, net lending rose by 0.2%, down from 0.3%, maintaining the 12-month growth rate at 2.9%.

Total personal loans declined by 0.1%, in line with November’s contraction. However, the annual growth rate still accelerated from 0.9% to 1.2%. This category of debt includes fixed-term loans for large personal expenditures, credit cards and other revolving credit facilities.

Third months of gains for Conf. Board US sentiment index

30 January 2024

Summary: Conference Board Consumer Confidence Index rises in January, reading more than expected; reflected slower inflation, anticipation of lower interest rates ahead, generally favourable employment conditions; short-term US Treasury yields up, longer-term yields down; expectations of Fed rate cuts in 2024 soften; views of present conditions, short-term outlook improve; gain across all age groups, all incomes groups except very top.

US consumer confidence clawed its way back to neutral over the five years after the GFC in 2008/2009 and then went from strength to strength until late 2018. Measures of consumer confidence then oscillated within a relatively narrow band at historically high levels until they plunged in early 2020. Subsequent readings then fluctuated around the long-term average until March 2021 when they returned to elevated levels. However, a noticeable gap has since emerged between the two most-widely followed surveys.

The latest Conference Board survey held during the first three weeks of January indicated US consumer confidence has improved for a third consecutive month, reversing the deterioration which took place from August through to October. January’s Consumer Confidence Index registered 114.8 on a preliminary basis, above the generally-expected figure of 111.6 as well as December’s final figure of 110.7.

“January’s increase in consumer confidence likely reflected slower inflation, anticipation of lower interest rates ahead, and generally favourable employment conditions as companies continue to hoard labour,” said Dana Peterson, Chief Economist at The Conference Board.

The figures came out at about the same time as the December JOLTS report and short-term US Treasury yields rose while longer-term yields fell. By the close of business, the 2-year Treasury bond yield had gained 5bps to 4.36%, the 10-year yield had lost 2bps to 4.05% while the 30-year yield finished 4bps lower at 4.27%.

In terms of US Fed policy, expectations of a lower federal funds rate in the next 12 months softened, albeit with several cuts still factored in. At the close of business, contracts implied the effective federal funds rate would average 5.325% in February,  essentially in line with the current spot rate, 5.29% in March and 5.225% in April. January 2025 contracts implied 4.01%, 132bps less than the current rate.

Consumers’ views of present conditions and their views of the near-future both improved. The Present Situation Index increased from December’s revised figure of 147.2 to 161.3 while the Expectations Index moved up from 81.9 to 83.8.

“The gain was seen across all age groups, but largest for consumers 55 and over. Likewise, confidence improved for all incomes groups except the very top; only households earning $125,000+ saw a slight dip,” Peterson added.

The Consumer Confidence Survey is one of two widely followed monthly US consumer sentiment surveys which produce sentiment indices. The Conference Board’s index is based on perceptions of current business and employment conditions, as well as respondents’ expectations of conditions six months in the future. The other survey, conducted by the University of Michigan, is similar and it is used to produce an Index of Consumer Sentiment. That survey differs in that it does not ask respondents explicitly about their views of the labour market and it also includes some longer-term questions.

US quit rate steady in December, openings rise

30 January 2024

Summary: US quit rate steady at 2.2% in December; short-term US Treasury yields up, longer-term yields down; expectations of Fed rate cuts in 2024 soften; fewer quits, separations, more openings.

The number of US employees who quit their jobs as a percentage of total employment increased slowly but steadily after the GFC. It peaked in March 2019 and then tracked sideways until virus containment measures were introduced in March 2020. The quit rate then plummeted as alternative employment opportunities rapidly dried up. Following the easing of US pandemic restrictions, it proceeded to recover back to its pre-pandemic rate in the third quarter of 2020 and trended higher through 2021 before easing through 2022 and 2023.

Figures released as part of the latest Job Openings and Labor Turnover Survey (JOLTS) report show the quit rate remained steady in December. 2.2% of the non-farm workforce left their jobs voluntarily, unchanged from November after rounding. Quits in the month fell by 132,000 while an additional 216,000 people were employed in non-farm sectors.

The figures came out at about the same time as the latest reading of The Conference Board’s consumer confidence index and short-term US Treasury yields rose while longer-term yields fell. By the close of business, the 2-year Treasury bond yield had gained 5bps to 4.36%, the 10-year yield had lost 2bps to 4.05% while the 30-year yield finished 4bps lower at 4.27%.

In terms of US Fed policy, expectations of a lower federal funds rate in the next 12 months softened, albeit with several cuts still factored in. At the close of business, contracts implied the effective federal funds rate would average 5.325% in February,  essentially in line with the current spot rate, 5.29% in March and 5.225% in April. January 2025 contracts implied 4.01%, 132bps less than the current rate.

The fall in total quits was led by 71,000 fewer resignations in the “Health care and social assistance” sector while the “Wholesale trade” sector experienced the largest gain, rising by 63,000. Overall, the total number of quits for the month decreased from November’s revised figure of 3.524 million to 3.392 million.          

Total vacancies at the end of December increased by 101,000, or 1.1%, from November’s revised figure of 8.925 million to 9.026 million. The rise was driven by a 239,000 gain in the “Professional and business services” sector while the “Accommodation and food services” sector experienced the single largest decrease, falling by 121,000. Overall, 9 out of 18 sectors experienced more job openings than in the previous month.  

Total separations decreased by 36,000, or 0.7%, from November’s revised figure of 5.401 million to 5.365 million. The fall was led by the “Health care and social assistance” sector where there were 91,000 fewer separations. Separations decreased in 10 of the 18 sectors.

The “quit” rate time series produced by the JOLTS report is a leading indicator of US hourly pay. As wages account for around 55% of a product’s or service’s price in the US, wage inflation and overall inflation rates tend to be closely related. Former Federal Reserve chief and current Treasury Secretary Janet Yellen was known to pay close attention to it.

December retail sales slump reverses November jump

30 January 2024

Summary: Retail sales down 2.7% in December, worse than expected; up 0.8% on 12-month basis; ANZ: underlying trend in nominal retail sales looks weak; ACGB yields fall; rate-cut expectations firm a touch; ANZ: popularity of Black Friday sales changing spending patterns during end-of-year trading period; largest influence on result again from household goods sales.

Growth figures of domestic retail sales spent most of the 2010s at levels below the post-1992 average. While economic conditions had been generally favourable, wage growth and inflation rates were low. Expenditures on goods then jumped in the early stages of 2020 as government restrictions severely altered households’ spending habits. Households mostly reverted to their usual patterns as restrictions eased in the latter part of 2020 and throughout 2021.

According to the latest ABS figures, total retail sales slumped by 2.7% on a seasonally adjusted basis in December. The fall was a greater one than the 2.0% decrease which had been generally expected and in contrast with November’s downwardly revised 1.6% gain. Sales increased by 0.8% on an annual basis, down from November’s comparable figure of 2.2% after revisions.

“While the drop in sales had more to do with seasonal patterns not adjusted for in the data, the underlying trend in nominal retail sales looks weak,” said ANZ economist Madeline Dunk. “Q4 nominal retail sales grew just 0.5%, despite inflation and population growth.”

Commonwealth Government bond yields moved lower on the day, largely in line with movements of US Treasury yields overnight. By the close of business, the 3-year ACGB yield had lost 4bps to 3.69%, the 10-year yield had shed 7bps to 4.16% while the 20-year yield finished 8bps lower at 4.46%.

In the cash futures market, expectations regarding rate cuts later this year firmed a touch.  At the end of the day, contracts implied the cash rate would remain close to the current rate for the next few months and average 4.325% through February, 4.315% in March and 4.295% in April. However, August contracts implied a 4.13% average cash rate while November contracts implied 3.965%, 35bps less than the current rate.

“There is no doubt the growing popularity of Black Friday sales is changing spending patterns during the end-of-year trading period,” Dunk added. “The December release included larger than usual revisions to the data, as the seasonal adjustment process attempts to capture this change in behaviour. Despite this, recent years have shown a consistent pattern of strong November growth followed by weak December results.”

Retail sales are typically segmented into six categories (see below), with the “Food” segment accounting for 40% of total sales. However, the largest influences on the month’s total once again came from the “Household goods” segment where sales fell by 8.5% over the month.

US services prices offsetting lower goods prices; core PCE rises as expected in December

26 January 2024

Summary: US core PCE price index up 0.2% in December, as expected; annual rate slows to 2.9%; ANZ: soft goods prices offsetting higher services prices; Treasury yields rise; Fed rate-cut expectations for 2024 soften; ANZ: services prices firm over December quarter.

One of the US Fed’s favoured measures of inflation is the change in the core personal consumption expenditures (PCE) price index. After hitting the Fed’s target at the time of 2.0% in mid-2018, the annual rate then hovered in a range between 1.8% and 2.0% before it eased back to a range between 1.5% and 1.8% through 2019. It then plummeted below 1.0% in April 2020 before rising back to around 1.5% in the September quarter of that year. It has since increased significantly and still remains above the Fed’s target even after recent declines.

The latest figures have now been published by the Bureau of Economic Analysis as part of the December personal income and expenditures report. Core PCE prices rose by 0.2% over the month, in line with expectations but more than November’s 0.1% increase. On a 12-month basis, the core PCE inflation rate slowed from 3.2% to 2.9%.

“The composition continues to highlight that soft goods prices are offsetting firm services price pressures,” ANZ FX analyst Felix Ryan.

US Treasury bond yields rose on the day, especially at the short end of the yield curve. By the close of business, the 2-year Treasury bond yield had added 5bps to 4.36%, the 10-year yield had added 2bps to 4.15% while the 30-year yield finished 1bp higher at 4.38%.

In terms of US Fed policy, expectations of a lower federal funds rate in the next 12 months softened, albeit with several cuts still factored in. At the close of business, contracts implied the effective federal funds rate would average 5.32% in February,  essentially in line with the current spot rate, 5.28% in March and 5.205% in April. January 2025 contracts implied 3.985%, 135bps less than the current rate.

“Goods prices fell 0.18% while services were up 0.34%,” Ryan noted.  “If anything, services prices firmed over the December quarter. The 0.34% rise follows 0.26% in November and 0.19% in October. The 6-month seasonally adjusted annual rate of services inflation, which is about 65% of the PCE deflator, rose 3.6% and is gradually rising again…”

The core version of PCE strips out energy and food components, which are volatile from month to month, in an attempt to identify the prevailing trend. It is not the only measure of inflation used by the Fed; the Fed also tracks the Consumer Price Index (CPI) and the Producer Price Index (PPI) from the Department of Labor. However, it is the one measure which is most often referred to in FOMC minutes.

Click for more news