News

US yields fall despite Dec quarter GDP report

25 January 2024

Summary: US GDP up 0.8% (3.3% annualised) in December quarter, above expectations; US Treasury yields fall; rate-cut expectations harden; GDP price deflator rate slows from 3.2% to 2.6%.

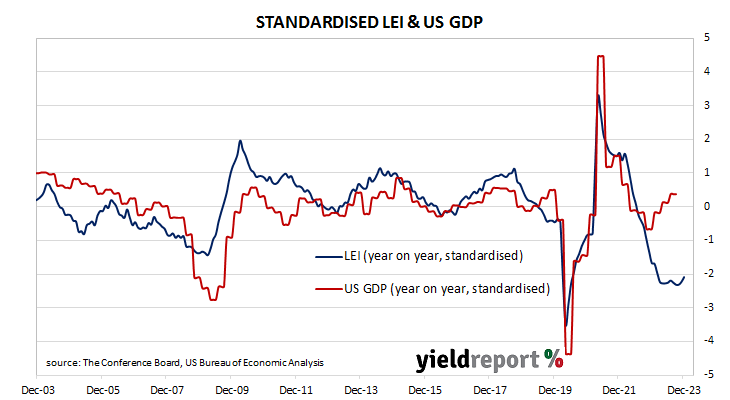
US GDP growth slowed in the second quarter of 2019 before stabilising at about 0.5% per quarter.  At the same time, US bond yields suggested future growth rates would be below trend. The US Fed agreed and it reduced its federal funds range three times in the second half of 2019. Pandemic restrictions in the June quarter of 2020 sent parts of the US economy into hibernation; the lifting of those same restrictions sparked a rapid recovery which lasted until 2022.

The US Bureau of Economic Analysis has now released the December quarter’s advance GDP estimates and they indicate the US economy expanded by 0.8% or at an annualised rate of 3.3%. The result was significantly more than the 0.5% increase (1.9% annualised) which had been generally expected as well as the September quarter’s 1.2% rise.

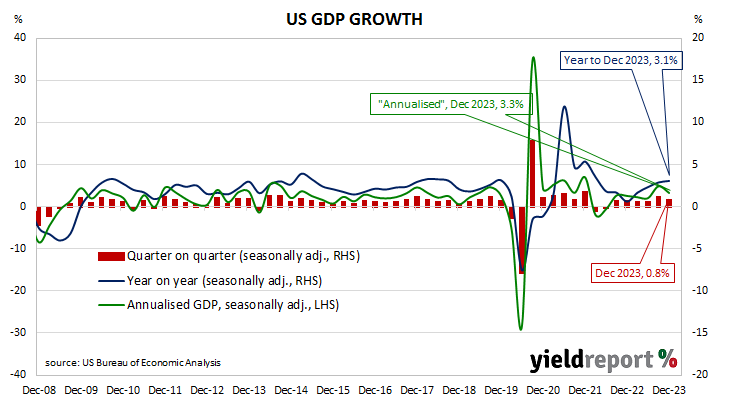
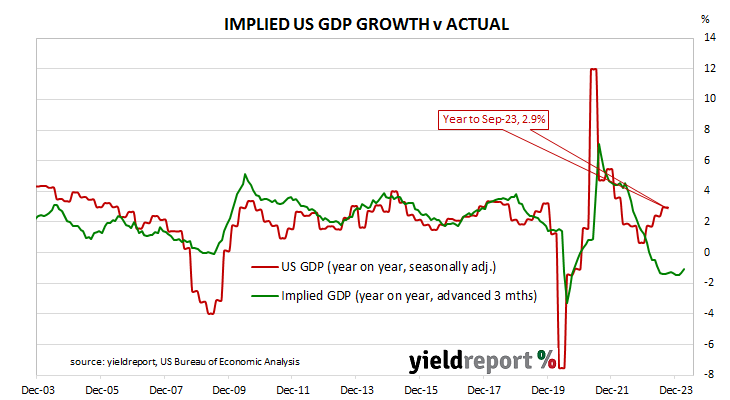
US GDP numbers are published in a manner which is different to most other countries; quarterly figures are compounded to give an annualised figure. In countries such as Australia and the UK, an annual figure is calculated by taking the latest number and comparing it with the figure from the same period in the previous year. The diagram above shows US GDP once it has been expressed in the normal manner, as well as the annualised figure.

US Treasury bond yields fell on the day despite the figures. By the close of business, the 2-year Treasury bond yield had lost 7bps to 4.31%, the 10-year yield had shed 5bps to 4.13% while the 30-year yield finished 4bps lower at 4.37%.

In terms of US Fed policy, expectations of a lower federal funds rate in the next 12 months hardened, factoring in several cuts. At the close of business, contracts implied the effective federal funds rate would average 5.325% in February,  in line with the current spot rate, 5.28% in March and 5.205% in April. January 2025 contracts implied 3.92%, 141bps less than the current rate.

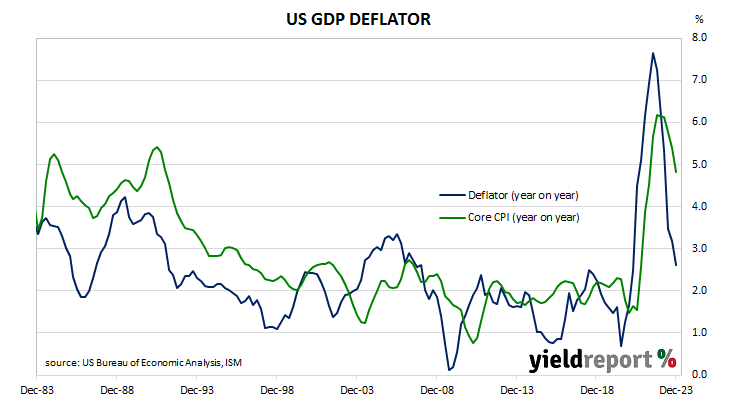
One part of the report which is often overlooked are the figures regarding the GDP price deflator, which is another measure of inflation. The GDP price deflator is restricted to new, domestically-produced goods and services and it is not based on a fixed basket as is the case for the consumer price index (CPI). The annual rate slowed again, this time from 3.2% to 2.6%.

Westpac-MI leading index back at trend level; stabilisation, not upturn

24 January 2024

Summary: Leading index growth rate down in December; index growth continues to show clear improvement; reading implies annual GDP growth of around 2.75%; ACGB yields rise moderately; rate-cut expectations soften slightly; stabilisation rather than cyclical upturn.

Westpac and the Melbourne Institute describe their Leading Index as a composite measure which attempts to estimate the likely pace of Australian economic growth in the short-term. After reaching a peak in early 2018, the index trended lower through 2018 and 2019 before plunging to recessionary levels in the second quarter of 2020. Subsequent readings spiked towards the end of 2020 but then trended lower through 2021 and 2022 before flattening out in first half of 2023.

The December reading of the six month annualised growth rate of the indicator registered 0.01%, down from November’s revised figure of +0.18%.

“Despite the dip back into year-end, the Leading Index growth continues to show a clear improvement,” said Westpac senior economist Matthew Hassan. “December is the second consecutive month that the Index growth rate has been around or slightly above the zero ‘gain line’.”

Index figures represent rates relative to “trend” GDP growth, which is generally thought to be around 2.75% per annum in Australia. The index is said to lead GDP by “three to nine months into the future” but the highest correlation between the index and actual GDP figures occurs with a three-month lead. The current reading is thus indicative of an annual GDP growth rate of around 2.75% in the next quarter.

Domestic Treasury bond yields rose moderately on the day. By the close of business, the 3-year ACGB yield had added 2bps to 3.789% while 10-year and 20-year yields both finished 4bpos higher at 4.25% and 4.55% respectively.

In the cash futures market, expectations regarding rate cuts later this year softened slightly.  At the end of the day, contracts implied the cash rate would remain close to the current rate for the next few months and average 4.32% through February, 4.315% in March and 4.30% in April. However, August contracts implied a 4.165% average cash rate while November contracts implied 4.005%, 31bps less than the current rate.

“However, the broad picture still looks to be of, at best, a stabilisation rather than the beginning of a cyclical upturn,” Hassan added. “Much of the lift is coming from a recovery in commodity prices since mid-2023, a rally that may not last. Meanwhile momentum excluding this component still looks to be weak.”

Pessimistic start to 2024 for euro-zone households

23 January 2024

Summary: Euro-zone household sentiment more pessimistic in January, index less than expected; consumer confidence index noticeably below long-term average; ANZ: fall partially negates gains since November; euro-zone bond yields rise.

EU consumer confidence plunged during the GFC and again in 2011/12 during the European debt crisis. After bouncing back through 2013 and 2014, it fell back significantly in late 2018 but only to a level which corresponds to significant optimism among households. Following the plunge which took place in April 2020, a recovery began a month later, with household confidence returning to above-average levels from March 2021. However, readings subsequent to early 2022 were extremely low by historical standards until recently.

Consumer confidence deteriorated in January according to the latest survey conducted by the European Commission. Its Consumer Confidence Indicator recorded a reading of -16.1, below the generally expected figure of -14.0 as well as December’s reading of -15.0. This latest reading is noticeably below the long-term average of -10.4 and below the lower end of the range in which “normal” readings usually occur.

“Consumer confidence across the euro area fell to -16.1 in January wiping out about a third of the gain made since November,” said ANZ senior economist Blair Chapman.

Sovereign bond yields in major euro-zone bond markets rose on the day. By the close of business, the German 10-year bund yield had gained 8bps to 2.34% while the French 10-year OAT yield finished 5bps higher at 2.84%.

NAB: business confidence reverses Nov drop, conditions back to average

23 January 2024

Summary: Business conditions deteriorate in December; business pessimism lessens but well below average; decline in conditions led by manufacturing, construction; ACGB yields fall; rate-cut expectations harden; consumers cutting back on spending, although confidence in retail sector “encouraging”; capacity utilisation rate declines, still at elevated level.

NAB’s business survey indicated Australian business conditions were robust in the first half of 2018, with a cyclical-peak reached in April of that year. Readings from NAB’s index then began to slip and forecasts of a slowdown in the domestic economy began to emerge in the first half of 2019 as the index trended lower. It hit a nadir in April 2020 as pandemic restrictions were introduced but then improved markedly over the next twelve months and has subsequently remained at robust levels.

According to NAB’s latest monthly business survey of around 500 firms conducted in first half of January, business conditions have deteriorated again, albeit to a level which about average. NAB’s conditions index registered 7 points, down 2 points from November’s reading.

“The decline in conditions was led by manufacturing and construction. Elsewhere, conditions remained weak in retail but remained elevated in the services sectors,” said NAB senior economist Brody Viney.

Business confidence improved markedly after deteriorating for three consecutive months.  NAB’s confidence index rose from November’s revised reading of -8 points to -1 point, although it is still well below the long-term average.  Typically, NAB’s confidence index leads the conditions index by one month, although some divergences have appeared from time to time.

Commonwealth Government bond yields fell on the day. By the close of business, the 3-year ACGB yield had shed 5bps to 3.76%, the 10-year yield lost 4bps to 4.21% while the 20-year yield finished 3bps lower at 4.51%.

In the cash futures market, expectations regarding rate cuts later this year hardened.  At the end of the day, contracts implied the cash rate would remain close to the current rate for the next few months and average 4.32% through February, 4.31% in March and 4.295% in April. However, August contracts implied a 4.14% average cash rate while November contracts implied 3.985%, 33bps less than the current rate.

“Overall, both confidence and conditions are softest in manufacturing, retail and wholesale which reflects that consumers have been cutting back on spending as time has gone on,” said NAB Chief Economist Alan Oster. “There was an encouraging pickup in confidence in the retail sector in December, but it remains to be seen if this will be maintained.”

NAB’s measure of national capacity utilisation declined again, from November’s revised reading of 83.6% to 82.7%, a level which is still elevated from a historical perspective. Seven of the eight sectors of the economy were reported to be operating at or above their respective long-run averages.

Capacity utilisation is generally accepted as an indicator of future investment expenditure and it also has a strong inverse relationship with Australia’s unemployment rate.

Conference Board leading index slips in Dec, signals risk of recession ahead

22 January 2024

Summary: Conference Board leading index down 0.1% in December, higher than expected; improvements more than offset by weak conditions in manufacturing, high interest-rate environment, low consumer confidence; US Treasury yields fall; rate-cut expectations firm; six-month, twelve-month growth rates turn upward but still signal risk of recession ahead; regression analysis implies 1.1% contraction in year to March.

The Conference Board Leading Economic Index (LEI) is a composite index composed of ten sub-indices which are thought to be sensitive to changes in the US economy. The Conference Board describes it as an index which attempts to signal growth peaks and troughs; turning points in the index have historically occurred prior to changes in aggregate economic activity. Readings from March and April of 2020 signalled “a deep US recession” while subsequent readings indicated the US economy would recover rapidly. More recent readings have implied US GDP growth rates will turn negative sometime in the second half of 2023 or the first half of 2024.

The latest reading of the LEI indicates it decreased by 0.1% in December. The fall was a smaller one than the 0.3% decrease which had been generally expected as well as November’s figure of -0.5%.

“Despite the overall decline, six out of ten leading indicators made positive contributions to the LEI in December,” said Justyna Zabinska-La Monica of The Conference Board.  “Nonetheless, these improvements were more than offset by weak conditions in manufacturing, the high interest-rate environment and low consumer confidence.”

US Treasury bond yields fell on the day. By the close of business, the 2-year Treasury yield had slipped 1bp to 4.39%, the 10-year yield had lost 4bps to 4.10% while the 30-year yield finished 3bps lower at 4.32%.

In terms of US Fed policy, expectations of a lower federal funds rate in the next 12 months firmed, factoring in several cuts. At the close of business, contracts implied the effective federal funds rate would average 5.325% in February,  in line with the current spot rate, 5.29% in March and 5.22% in April. January 2025 contracts implied 3.97%, 136bps less than the current rate.

“As the magnitude of monthly declines has lessened, the LEI’s six-month and twelve-month growth rates have turned upward but remain negative, continuing to signal the risk of recession ahead,” added Zabinska-La Monica.

The Conference Board had previously forecast a “shallow” recession in the first half of 2024 and now it expects negative GDP growth in the June and September quarters of 2024. Regression analysis suggests the latest reading implies a -1.1% year-on-year growth rate in March, up from the -1.3% implied for the year to February by the previous month’s LEI.

UoM sentiment index jumps again in January

19 January 2024

Summary: University of Michigan consumer confidence index jumps in January, reading markedly more than expected; views of present conditions, future conditions both improved; reading supported by confidence regarding inflation, strengthening income expectations; short-term Treasury yields rise, longer-term yields either steady or down; 2024 rate-cut expectations soften; ANZ: US recession never started when consumer confidence trending up.

US consumer confidence started 2020 at an elevated level but, after a few months, surveys began to reflect a growing unease with the global spread of COVID-19 and its reach into the US. Household confidence plunged in April 2020 and then recovered in a haphazard fashion, generally fluctuating at below-average levels according to the University of Michigan. The University’s measure of confidence had recovered back to the long-term average by April 2021 but then it plunged again in the September quarter and remained at historically low levels through 2022 and 2023.

The latest survey conducted by the University indicates confidence among US households has improved markedly for a second consecutive month. The preliminary reading of the Index of Consumer Sentiment registered 78.8 in January, considerably more than the 70.0 which had been generally expected as well as December’s final figure of 69.7.

Consumers’ views of current conditions and their views of future conditions both improved relative to those held at the time of the December survey.

“Consumer views were supported by confidence that inflation has turned a corner and strengthening income expectations,” said the University’s Surveys of Consumers Director Joanne Hsu. “Like December, there was a broad consensus of improved sentiment across age, income, education, and geography.”

Short-term US Treasury bond yields rose on the day while longer-term yields either remained steady or declined. By the close of business, the 2-year Treasury yield had gained 5bps to 4.40%, the 10-year yield had returned to its starting point at 4.14% while the 30-year yield finished 2bps lower at 4.35%.

In terms of US Fed policy, expectations of a lower federal funds rate in the next 12 months softened while still factoring in several cuts. At the close of business, contracts implied the effective federal funds rate would average 5.325% in February,  in line with the current spot rate, 5.285% in March and 5.21% in April. January 2025 contracts implied 4.00%, 133bps less than the current rate.

“Since the series began in 1952, a recession has never started when consumer confidence is trending up,” ANZ FX analyst Felix Ryan observed.

It was once thought less-confident households are generally inclined to spend less and save more; some decline in household spending could be expected to follow. However, recent research suggests the correlation between household confidence and retail spending is quite weak.

US retail sales surprise again with 0.6% rise in December

17 January 2024

Summary: US retail sales up 0.6% in December, rise exceeds expectation; annual growth rate accelerates to 5.6%; US Treasury yields rise; rate-cut expectations soften; higher sales in nine of thirteen categories; “non-store retails” largest single influence on month’s result.

US retail sales had been trending up since late 2015 but, commencing in late 2018, a series of weak or negative monthly results led to a drop-off in the annual growth rate below 2.0%. Growth rates then increased in trend terms through 2019 and into early 2020 until pandemic restrictions sent them into negative territory. A “v-shaped” recovery then took place which was followed by some short-term spikes as federal stimulus payments hit US households in the first and second quarters of 2021.

According to the latest “advance” numbers released by the US Census Bureau, total retail sales increased by 0.6% in December. The result exceeded the 0.4% increase which had been generally expected as well as November’s 0.3% rise. On an annual basis, the growth rate accelerated from November’s revised rate of 4.0% to 5.6%.

The figures were released on the same day as the latest industrial production report and US Treasury yields rose, especially at the short end of the curve. By the close of business, the 2-year Treasury yield had jumped 13bps to 4.35%, the 10-year yield had added 4bps to 4.10% while the 30-year yield finished 1bp lower at 4.31%.

In terms of US Fed policy, expectations of a lower federal funds rate in the next 12 months softened while still factoring in several cuts. At the close of business, contracts implied the effective federal funds rate would average 5.32% in February, 1bp less than the current spot rate, 5.275% in March and 5.185% in April. January 2025 contracts implied 3.92%, 141bps less than the current rate.

Nine of the thirteen categories recorded higher sales over the month. The “Non-store retails” segment provided the largest single influence on the overall result, rising by 1.5% over the month and contributing 0.26 percentage points to the total.    

The non-store segment includes vending machine sales, door-to-door sales and mail-order sales but nowadays this segment has become dominated by online sales. It now accounts for 17% of all US retail sales and it is the second-largest segment after vehicles and parts.

Modest December rise for US industrial output

17 January 2024

US industrial output up 0.1% in December, slightly above expectations; up 1.0% over past 12 months; Treasury yields rise; rate-cut expectations soften; capacity utilisation rate steady at 78.6%, below long-term average.

The Federal Reserve’s industrial production (IP) index measures real output from manufacturing, mining, electricity and gas company facilities located in the United States. These sectors are thought to be sensitive to consumer demand and so some leading indicators of GDP use industrial production figures as a component. US production collapsed through March and April of 2020 before recovering the ground lost over the fifteen months to July 2021.

According to the Federal Reserve, US industrial production expanded by 0.1% on a seasonally adjusted basis in December. The rise was slightly above the expected flat result as well as November’s unchanged figure after it was revised down from +0.2%. On an annual basis the growth accelerated from November’s revised figure of -0.6% to 1.0%.

The figures were released on the same day as the latest retail sales report and US Treasury yields rose, especially at the short end of the curve. By the close of business, the 2-year Treasury yield had jumped 13bps to 4.35%, the 10-year yield had added 4bps to 4.10% while the 30-year yield finished 1bp lower at 4.31%.

In terms of US Fed policy, expectations of a lower federal funds rate in the next 12 months softened while still factoring in several cuts. At the close of business, contracts implied the effective federal funds rate would average 5.32% in February, 1bp less than the current spot rate, 5.275% in March and 5.185% in April. January 2025 contracts implied 3.92%, 141bps less than the current rate.

The same report includes capacity utilisation figures which are generally accepted as an indicator of future investment expenditure and/or inflationary pressures. Capacity usage hit a high for the last business cycle in early 2019 before it began a downtrend which ended with April 2020’s multi-decade low of 64.2%. December’s reading remained unchanged from November’s downwardly-revised figure of 78.6%, below the long-term average of 80.1%.

While the US utilisation rate’s correlation with the US jobless rate is solid, it is not as high as the comparable correlation in Australia.

Consumers much more ‘hawkish’ on rate outlook; consumer sentiment remains pessimistic

16 January 2024

Summary: Westpac-Melbourne Institute consumer sentiment index down in January; More pessimistic starts to year only previously seen during early 1990s recession; ACGB yields increase; rate-cut expectations soften; consumers much more ‘hawkish’ on interest rate outlook than financial markets, economists; three of five sub-indices lower; more respondents expecting higher jobless rate.

After a lengthy divergence between measures of consumer sentiment and business confidence in Australia which began in 2014, confidence readings of the two sectors converged again in mid-July 2018. Both measures then deteriorated gradually in trend terms, with consumer confidence leading the way. Household sentiment fell off a cliff in April 2020 but, after a few months of to-ing and fro-ing, it then staged a full recovery. However, consumer sentiment has deteriorated significantly over the past two years, while business sentiment has been more robust.

According to the latest Westpac-Melbourne Institute survey conducted in the second week of January, household sentiment remains stuck at quite pessimistic levels.  Their Consumer Sentiment Index declined from December’s reading of 82.1 to 81.0, a reading which is well below the “normal” range and significantly lower than the long-term average reading of just over 101.

“The latest January read is in the bottom 7% of all observations since the survey was first run in the mid-1970s,” said Westpac senior economist Matthew Hassan. “More pessimistic starts to the year have only been seen during the deep recession of the early 1990s.”

Any reading of the Consumer Sentiment Index below 100 indicates the number of consumers who are pessimistic is greater than the number of consumers who are optimistic.

Commonwealth Government bond yields increased on the day. By the close of business, the 3-year ACGB yield had added 7bps to 3.70%, the 10-year yield had gained 8bps to 4.17% while the 20-year yield finished 5bps higher at 4.48%.

In the cash futures market, expectations regarding rate cuts later this year softened.  At the end of the day, contracts implied the cash rate would remain close to the current rate of 4.32% and average 4.32% through February, 4.31% in March and 4.295% in April. August contracts implied a 4.10% average cash rate while November contracts implied 3.915%, 40bps less than the current rate.

“Despite easing rate rise fears, consumers are much more ‘hawkish’ on the interest rate outlook in Australia than both financial markets and economists,” added Hassan. “While just over half of consumers expect mortgage rates to rise, futures markets are currently pricing in 50bps in cuts by year-end, with three out of four economists also expecting the cash rate to move lower.”

Three of the five sub-indices registered lower readings, with the “Family finances versus a year ago” sub-index posting the largest monthly percentage loss.

The Unemployment Expectations index, formerly a useful guide to RBA rate changes, rose from 128.9 to 130.7. Higher readings result from more respondents expecting a higher unemployment rate in the year ahead.

Another contraction for euro-zone industrial production; down 0.3% in November

15 January 2024

Euro-zone industrial production down 0.3% in November, fall in line with expectations; down 6.8% on annual basis; ANZ: broad-based, expected to remain this way for some time; German, French 10-year yields up; output contracts in two of four largest euro economies.

Following a recession in 2009/2010 and the debt-crisis which flowed from it, euro-zone industrial production recovered and then reached a peak four years later in 2016. Growth rates then fluctuated for two years before beginning a steady and persistent slowdown from the start of 2018. That decline was transformed into a plunge in March and April of 2020 which then took over a year to claw back. Production levels in recent quarters have generally stagnated in trend terms.

According to the latest figures released by Eurostat, euro-zone industrial production contracted by 0.3% in November on a seasonally-adjusted and calendar-adjusted basis. The fall was in line with consensus expectations but it was a smaller one than October’s 0.7% contraction. The calendar-adjusted contraction rate on an annual basis increased, from October’s revised rate of 6.6% to 6.8%.

“The fall in production was broad-based across many sectors and is expected to remain this way for some time to come,” said ANZ senior economist Adelaide Timbrell.

German and French sovereign bond yields both rose noticeably on the day despite the figures. By the close of business, the German 10-year bond yield had gained 10bps to 2.25%, while the French 10-year bond yield finished 5bps higher at 2.73%.

Industrial production contracted in two of the euro-zone’s four largest economies. Germany’s production fell by 0.3% over the month while the comparable figures for France, Spain and Italy were +0.5%, +1.1% and -1.5% respectively.

Click for more news