News

Job ads index inches higher in December; no sign of sharp deterioration

15 January 2024

Summary: Job ads up 0.1% in December; 14.9% lower than December 2022; ANZ: 10.0% month-on-month fall in unadjusted terms; short-term ACGB yields fall, longer-terms steady/up modestly; rate-cut expectations soften slightly; ANZ: no signs of sharp deterioration approaching; ad index-to-workforce ratio steady.

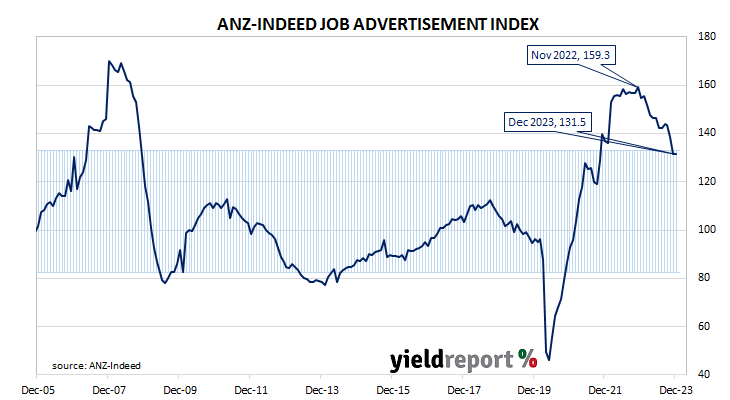
From mid-2017 onwards, year-on-year growth rates in the total number of Australian job advertisements consistently exceeded 10%. That was until mid-2018 when the annual growth rate fell back markedly. 2019 was notable for its reduced employment advertising and this trend continued into the first quarter of 2020. Advertising then plunged in April and May of 2020 as pandemic restrictions took effect but recovered quite quickly, reaching historically-high levels in 2022.

According to the latest ANZ-Indeed figures, total advertisements rose by 0.1% in December on a seasonally adjusted basis. The result followed losses of 5.1% in November and 3.4% in October. On a 12-month basis, total job advertisements were 14.9% lower than in December 2022, up from November’s revised figure of -17.5%.

“In original terms, there was a 10.0% month-on-month fall, reflecting the seasonal drop off in recruiting going into the holiday break,” said ANZ senior economist Catherine Birch.

Short-term Commonwealth Government bond yields fell on the day while long-term yields were either steady or modestly higher, somewhat similar to movements of US Treasury yields on Friday night. By the close of business, the 3-year ACGB yields had lost 2bps to 3.63%, the 10-year yield had returned to its starting point at 4.09% while the 20-year yield finished 3bps higher at 4.43%.

In the cash futures market, expectations regarding rate cuts later this year softened slightly.  At the end of the day, contracts implied the cash rate would remain close to the current rate of 4.32% and average 4.32% through February, 4.31% in March and 4.295% in April. August contracts implied a 4.07% average cash rate while November contracts implied 3.88%, 44bps less than the current rate.

“ABS job vacancies only declined 0.7% quarter-on-quarter in November, adding to the evidence that while the labour market is easing, there are no signs of a sharp deterioration approaching,” Birch added. “Vacancies per unemployed person declined to 0.68, a two-year low, but this is still double the pre-COVID level.”

The inverse relationship between job advertisements and the unemployment rate has been quite strong (see below chart), although ANZ themselves called the relationship between the two series into question in early 2019.  A higher job advertisement index as a proportion of the labour force is suggestive of lower unemployment rates in the near future while a lower ratio suggests higher unemployment rates will follow. December’s ad index-to-workforce ratio remained steady at 0.89 after revisions.

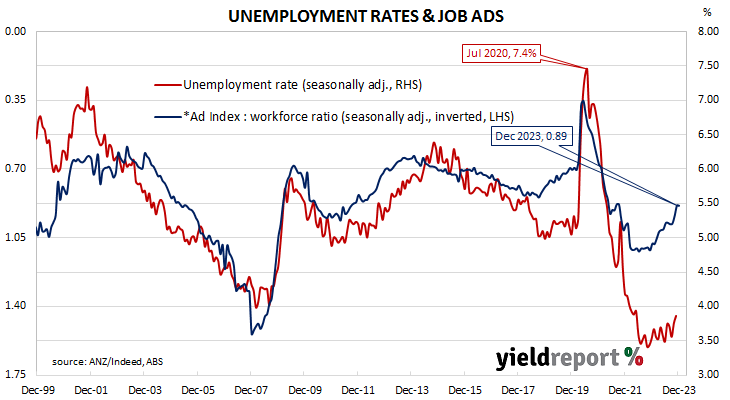
In 2008/2009, advertisements plummeted and Australia’s unemployment rate jumped from 4% to nearly 6% over a period of 15 months. When a more dramatic fall in advertisements took place in April 2020, the unemployment rate responded much more quickly.

Melbourne Inst. Inflation Gauge ends 2023 with 1.0% jump

15 January 2024

Melbourne Institute Inflation Gauge index up 1.0% in December; up 5.2% on annual basis; short-term ACGB yields fall, longer-terms steady/up modestly; rate-cut expectations soften slightly.

The Melbourne Institute’s Inflation Gauge is an attempt to replicate the ABS consumer price index (CPI) on a monthly basis. It has turned out to be a reliable leading indicator of the CPI, although there are periods in which the Inflation Gauge and the CPI have diverged for as long as twelve months. On average, the Inflation Gauge’s annual rate tends to overestimate the ABS rate by around 0.1%, at least until recently.

The Melbourne Institute’s latest reading of its Inflation Gauge index indicates consumer prices jumped by 1.0% in December, following a 0.3% rise in November and a 0.1% decline in October. The index rose by 5.2% on an annual basis, up from November’s comparable figure of 4.4%.

Short-term Commonwealth Government bond yields fell on the day while long-term yields were either steady or modestly higher, somewhat similar to movements of US Treasury yields on Friday night. By the close of business, the 3-year ACGB yields had lost 2bps to 3.63%, the 10-year yield had returned to its starting point at 4.09% while the 20-year yield finished 3bps higher at 4.43%.

In the cash futures market, expectations regarding rate cuts later this year softened slightly.  At the end of the day, contracts implied the cash rate would remain close to the current rate of 4.32% and average 4.32% through February, 4.31% in March and 4.295% in April. August contracts implied a 4.07% average cash rate while November contracts implied 3.88%, 44bps less than the current rate.

Given the Inflation Gauge’s tendency to overestimate, the latest figures imply an official CPI reading of 1.8% (seasonally adjusted) for the December quarter or 5.1% in annual terms. However, it is worth noting the annual CPI rate to the end of March was 7.0% while the Inflation Gauge had implied a 5.7% annual rate at the time.

US PPI goes into reverse in December

12 January 2024

Summary: US producer price index (PPI) down 0.1% in December, contrasts with expected increase; annual rate accelerates slightly to 0.9%; “core” PPI flat; US Treasury yields generally lower; 2024 rate-cut expectations harden; goods prices fall, services prices flat.

Around the end of 2018, the annual inflation rate of the US producer price index (PPI) began a downtrend which continued through 2019. Months in which producer prices increased suggested the trend may have been coming to an end, only for it to continue, culminating in a plunge in April 2020. Figures returned to “normal” towards the end of that year but then moved well above the long-term average in 2021 and 2022 before falling back over 2023.

The latest figures published by the Bureau of Labor Statistics indicate producer prices slipped by 0.1% after seasonal adjustments in December. The result contrasted with the 0.1% increase which had been generally expected but it was in line with November 0.1% decline after revisions. On a 12-month basis, the rate of producer price inflation after seasonal adjustments and revisions accelerated from November’s revised figure of 0.8% to 0.9%.

Producer prices excluding foods and energy, or “core” PPI, were flat after seasonal adjustments. The result was less than the expected 0.2% increase but in line with November’s unchanged reading. The annual growth rate slowed from 1.9% to 1.7%.

US Treasury bond yields generally fell on the day. By the close of business, the 2-year Treasury yield had shed 11bps to 4.15%, the 10-year yield had lost 2bps to 3.96% while the 30-year yield finished 1bp higher at 4.20%.

In terms of US Fed policy, expectations of a lower federal funds rate in the next 12 months hardened. At the close of business, contracts implied the effective federal funds rate would average 5.315% in February, 1bp less than the current spot rate, 5.245% in March and 5.115% in April. January 2025 contracts implied 3.635%, 169bps less than the current rate.

The BLS stated the index for final demand goods fell by 0.4% while the final demand services index remained flat.

The producer price index is a measure of prices received by producers for domestically produced goods, services and construction. It is put together in a fashion similar to the consumer price index (CPI) except it measures prices received from the producer’s perspective rather than from the perspective of a retailer or a consumer. It is another one of the various measures of inflation tracked by the US Fed, along with core personal consumption expenditure (PCE) price data. 

US bond yields fall, rate cut expectations harden after December CPI report

11 January 2024

Summary: US CPI up 0.3% in December, above expectations; “core” rate also up 0.3%; Citi: core CPI at 3-4% annualized pace for past 5 months; Treasury yields down, especially at short end; rate-cut expectations harden; Citi: core goods prices weak, services inflation consistently much stronger; prices of non-energy services main driver again.

The annual rate of US inflation as measured by changes in the consumer price index (CPI) halved from nearly 3% in the period from July 2018 to February 2019. It then fluctuated in a range from 1.5% to 2.0% through 2019 before rising above 2.0% in the final months of that year. Substantially lower rates were reported from March 2020 to May 2020 and they remained below 2% until March 2021. Rates then rose significantly before declining from mid-2022.

The latest US CPI figures released by the Bureau of Labor Statistics indicated seasonally-adjusted consumer prices rose by 0.3% on average in December. The increase was above the 0.2% rise which had been generally expected as well as November’s 0.1%. However, on a 12-month basis, the inflation rate accelerated from 3.1% to 3.3%.

“Headline” inflation is known to be volatile and so references are often made to “core” inflation for analytical purposes. The core prices index, the index which excludes the more variable food and energy components, also increased by 0.3% on a seasonally-adjusted basis over the month, in line with expectation. The annual growth rate slowed from 4.0% to 3.9%.

“Core CPI has been running around a 3-4% annualized pace for the last five months, with a 0.31% increase in December that was somewhat stronger than our 0.26% forecast,” said Citi economist Veronica Clark.

US Treasury bond yields fell on the day, especially at the short end. By the close of business, the 2-year Treasury yield had shed 11bps to 4.26%, the 10-year yield had lost 6bps to 3.98% while the 30-year yield finished 2bps lower at 4.19%.

In terms of US Fed policy, expectations of a lower federal funds rate in the next 12 months hardened. At the close of business, contracts implied the effective federal funds rate would average 5.32% in February, 1bp less than the current spot rate, 5.255% in March and 5.14% in April. January 2025 contracts implied 3.785%, 155bps less than the current rate.

“Details underlying core inflation have also been very similar month to month; core goods prices remain weak but services inflation, for both shelter and non-shelter services, is consistently much stronger, ” Clark added.

The largest influence on headline results is often the change in fuel prices. Prices of “Energy commodities”, the segment which contains vehicle fuels, decreased by 0.1% and contributed zero percentage points to the total. However, prices of non-energy services, the segment which includes actual and implied rents, again had the largest effect on the total, adding 0.24 percentage points after increasing by 0.4% on average.

Retail sales jump in November on Black Friday effect

09 January 2024

Summary: Retail sales up 2.0% in November, greater than expected; up 2.2% on 12-month basis; ANZ: Black Friday effects affecting data; ACGB yields fall; rate-cut expectations firm; ANZ: November sales cannibalising spending in surrounding months; largest influence on result from household goods sales.

Growth figures of domestic retail sales spent most of the 2010s at levels below the post-1992 average. While economic conditions had been generally favourable, wage growth and inflation rates were low. Expenditures on goods then jumped in the early stages of 2020 as government restrictions severely altered households’ spending habits. Households mostly reverted to their usual patterns as restrictions eased in the latter part of 2020 and throughout 2021.

According to the latest ABS figures, total retail sales jumped by 2.0% on a seasonally adjusted basis in November. The rise was greater than the 1.2% increase which had been generally expected and in contrast with October 0.4% loss after revisions. Sales increased by 2.2% on an annual basis, up from October’s comparable figure of 1.2%.

“While this would usually represent very strong monthly growth, the growing importance of Black Friday sales in recent years means the impacts are not fully accounted for in seasonally adjusted data,” said ANZ senior economist Adelaide Timbrell.

The figures were released at the same time as the latest dwelling approval numbers and Commonwealth Government bond yields moved lower on the day. By the close of business, the 3-year ACGB yield had lost 7bps to 3.71%, the 10-year yield had shed 5bps to 4.12% while the 20-year yield finished 6bps lower at 4.41%.

In the cash futures market, expectations regarding rate cuts later this year firmed.  At the end of the day, contracts implied the cash rate would remain close to the current rate of 4.32% and average 4.33% through February, 4.32% in March and 4.305% in April. August contracts implied a 4.085% average cash rate while November contracts implied 3.915%, 40bps less than the current rate.

“Black Friday sales tend to cannibalise spending in surrounding months,” added Timbrell, “and we expect December retail sales to fall, as they have in seasonally adjusted terms every year since 2019.”

Retail sales are typically segmented into six categories (see below), with the “Food” segment accounting for 40% of total sales. The largest influences on the month’s total came from the “Household goods” segment where sales rose by 7.5% over the month.

US output grows by 0.2% in November after strikes’ resolution

15 December 2023

US industrial output up 0.2% in November, in line with expectations; down 0.4% over past 12 months; manufacturing output up following resolution of car maker strikes; short-term Treasury yields rise, longer-term yields decline; rate-cut expectations soften; capacity utilisation rate up 0.1ppts to 78.8%, below long-term average.

The Federal Reserve’s industrial production (IP) index measures real output from manufacturing, mining, electricity and gas company facilities located in the United States. These sectors are thought to be sensitive to consumer demand and so some leading indicators of GDP use industrial production figures as a component. US production collapsed through March and April of 2020 before recovering the ground lost over the fifteen months to July 2021.

According to the Federal Reserve, US industrial production expanded by 0.2% on a seasonally adjusted basis in November. The result was in line with expectations and in contrast with October’s 0.9% contraction after it was revised down from -0.6%. On an annual basis the contraction rate slowed from October’s revised figure of -1.0% to -0.4%.

“The increase in manufacturing output was more than accounted for by a 7.1% bounce-back in motor vehicles and parts production following the resolution of strikes at several major automakers.”

Short-term US Treasury yields rose on the day while longer-term yields declined. By the close of business, the 2-year Treasury yield had added 6bps to 4.45%, the 10-year yield had slipped 1bp to 3.91% while the 30-year yield finished 3bps lower at 4.01%.

In terms of US Fed policy, expectations of a lower federal funds rate in the next 12 months softened. At the close of business, contracts implied the effective federal funds rate would average 5.33% in January, in line with the current spot rate, 5.245% in March and 4.935% in May. December 2024 contracts implied 4.02%, 131bps less than the current rate.

The same report includes US capacity utilisation figures which are generally accepted as an indicator of future investment expenditure and/or inflationary pressures. Capacity usage had hit a high for the last business cycle in early 2019 before it began a downtrend which ended with April 2020’s multi-decade low of 64.2%. November’s reading increased from October’s downwardly-revised figure of 78.7% to 78.8%, below the long-term average of 80.1%.

While the US utilisation rate’s correlation with the US jobless rate is solid, it is not as high as the comparable correlation in Australia.

US retail sales up 0.3% in November, beats expected decline

14 December 2023

Summary: US retail sales up 0.3% in November, rise  contrasts with expected decline; annual growth rate accelerates to 4.1%; US Treasury yields down noticeably; 2024 rate-cut expectations firm; higher sales in eight of thirteen categories; gasoline station sales largest single influence on month’s result.

US retail sales had been trending up since late 2015 but, commencing in late 2018, a series of weak or negative monthly results led to a drop-off in the annual growth rate below 2.0%. Growth rates then increased in trend terms through 2019 and into early 2020 until pandemic restrictions sent them into negative territory. A “v-shaped” recovery then took place which was followed by some short-term spikes as federal stimulus payments hit US households in the first and second quarters of 2021.

According to the latest “advance” numbers released by the US Census Bureau, total retail sales increased by 0.3% in November. The rise contrasted with the 0.1% decrease which had been generally expected as well as October’s 0.2% fall after it was revised down from a 0.1% fall. On an annual basis, the growth rate accelerated from October’s revised rate of 2.2% to 4.1%.

US Treasury bond yields fell noticeably on the day. By the close of business, the 2-year Treasury yield had lost 6bps to 4.39%, the 10-year yield had shed 11bps to 3.92% while the 30-year yield finished 14bps lower at 4.04%.

In terms of US Fed policy, expectations of a lower federal funds rate in the next 12 months firmed. At the close of business, contracts implied the effective federal funds rate would average 5.33% in January, in line with the current spot rate, 5.225% in March and 4.89% in May. December 2024 contracts implied 3.95%, 138bps less than the current rate.

Eight of the thirteen categories recorded higher sales over the month. The “Gasoline stations” segment provided the largest single influence on the overall result, falling by 2.9% over the month and subtracting 0.23 percentage points from the total.   

The non-store segment includes vending machine sales, door-to-door sales and mail-order sales but nowadays this segment has become dominated by online sales. It now accounts for nearly 17% of all US retail sales and it is the second-largest segment after vehicles and parts.

November PPI flat; supply-chain price pressures normalising

13 December 2023

Summary: US producer price index (PPI) flat in November, less than expected; annual rate slows to 0.8%; “core” PPI also flat; ANZ: shows normalisation in supply-chain price pressures, firms’ pricing power; US Treasury yields plunge; 2024 rate-cut expectations harden; goods prices, services prices both flat.

Around the end of 2018, the annual inflation rate of the US producer price index (PPI) began a downtrend which continued through 2019. Months in which producer prices increased suggested the trend may have been coming to an end, only for it to continue, culminating in a plunge in April 2020. Figures returned to “normal” towards the end of that year but then moved well above the long-term average in 2021 and 2022.

The latest figures published by the Bureau of Labor Statistics indicate producer prices remained flat after seasonal adjustments in November. The result was less than the 0.1% increase which had been generally expected but more than October’s -0.4% after revisions. On a 12-month basis, the rate of producer price inflation after seasonal adjustments and revisions slowed from October’s revised figure of 1.2% to 0.8%.

Producer prices excluding foods and energy, or “core” PPI, were also flat after seasonal adjustments. The result was less than the expected 0.2% increase but in line with October’s unchanged reading. The annual growth rate slowed from 2.3% to 2.0%.

“As has been the case in recent months, the data show a normalisation in supply-chain price pressures and reduced firms’ pricing power,” said ANZ senior economist Blair Chapman.

The figures were released on the same day as the latest FOMC policy decision and US Treasury bond yields plunged on the day. By the close of business, the 2-year Treasury yield had shed 28bps to 4.45%, the 10-year yield had lost 17bps to 4.03% while the 30-year yield finished 13bps lower at 4.18%.

In terms of US Fed policy, expectations of a lower federal funds rate in the next 12 months hardened significantly. At the close of business, contracts implied the effective federal funds rate would average 5.33% in January, in line with the current spot rate, 5.245% in March and 4.92% in May. December 2024 contracts implied 4.025%, 130bps less than the current rate.

The BLS stated the indices for final demand goods and final demand services both remained flat.

The producer price index is a measure of prices received by producers for domestically produced goods, services and construction. It is put together in a fashion similar to the consumer price index (CPI) except it measures prices received from the producer’s perspective rather than from the perspective of a retailer or a consumer. It is another one of the various measures of inflation tracked by the US Fed, along with core personal consumption expenditure (PCE) price data. 

Euro-zone industrial production worsens in October

13 December 2023

Euro-zone industrial production down 0.7% in October, fall greater than expected; down 6.7% on annual basis; German, French 10-year yields fall; output contracts in four largest euro economies.

Following a recession in 2009/2010 and the debt-crisis which flowed from it, euro-zone industrial production recovered and then reached a peak four years later in 2016. Growth rates then fluctuated for two years before beginning a steady and persistent slowdown from the start of 2018. That decline was transformed into a plunge in March and April of 2020 which then took over a year to claw back. Production levels in recent quarters have generally stagnated in trend terms.

According to the latest figures released by Eurostat, euro-zone industrial production contracted by 0.7% in October on a seasonally-adjusted and calendar-adjusted basis. The fall was a larger one than the 0.3% contraction which had been generally expected but it was smaller than September’s 1.0% contraction. The calendar-adjusted contraction rate on an annual basis slowed, from September’s revised rate of 6.8% to 6.7%.

German and French sovereign bond yields fell on the day. By the close of business, the German 10-year bond yield had lost 6bps to 2.16%, as did the French 10-year bond yield which finished at 3.71%.

Industrial production contracted in all of the euro-zone’s four largest economies. Germany’s production slipped by 0.1% over the month while the comparable figures for France, Spain and Italy were -0.3%, -0.6% and -0.2% respectively.

US November CPI up 0.1%; core annual rate still 4%

12 December 2023

Summary: US CPI up 0.1% in November, above expectations; “core” rate up 0.3%; ANZ: core inflation running at 4.0%, twice FOMC’s target; short-term Treasury yields creep higher, longer-term yields decrease; rate-cut expectations soften slightly; ANZ: services inflation ex-shelter still looks “punchy”; prices of non-energy services main driver.

The annual rate of US inflation as measured by changes in the consumer price index (CPI) halved from nearly 3% in the period from July 2018 to February 2019. It then fluctuated in a range from 1.5% to 2.0% through 2019 before rising above 2.0% in the final months of that year. Substantially lower rates were reported from March 2020 to May 2020 and they remained below 2% until March 2021. Rates then rose significantly before declining from mid-2022.

The latest US CPI figures released by the Bureau of Labor Statistics indicated seasonally-adjusted consumer prices rose by 0.1% on average in November. The increase was above expectations of no change as well as October’s flat result. On a 12-month basis, the inflation rate slowed from 3.2% to 3.1%.

“Headline” inflation is known to be volatile and so references are often made to “core” inflation for analytical purposes. The core prices index, the index which excludes the more variable food and energy components, increased by 0.3% on a seasonally-adjusted basis over the month, in line with expectation. The annual growth rate remained steady at 4.0%.

“Core CPI inflation is running at 4.0%, twice the FOMC’s target,” said ANZ senior economist Adelaide Timbrell.

Short-term US Treasury bond yields crept higher while longer-term yields decreased on the day. By the close of business, the 2-year Treasury yield had inched up 1bp to 4.73%, the 10-year yield had lost 4bps to 4.20% while the 30-year yield finished 2bps lower at 4.31%.

In terms of US Fed policy, expectations of a lower federal funds rate in the next 12 months softened slightly. At the close of business, contracts implied the effective federal funds rate would average 5.33% in December, in line with the current spot rate, 5.335% in January and 5.29% in March. December 2024 contracts implied 4.325%, 100bps less than the current rate.

“Rents were the biggest contributor to the growth in core inflation,” Timbrell added. “Services inflation ex-shelter still looks punchy and it also carries a bigger weight in the Federal Reserve’s preferred inflation measure than it does in the CPI. A marked softening in core inflation is needed before the Fed will be in a position to cut rates.”

The largest influence on headline results is often the change in fuel prices. Prices of “Energy commodities”, the segment which contains vehicle fuels, decreased by 5.8% and contributed -0.22 percentage points to the total. However, prices of non-energy services, the segment which includes actual and implied rents, had the largest effect on the total, adding 0.29 percentage points after increasing by 0.5% on average.

Click for more news