News

Rate pause lifts consumer sentiment in December

12 December 2023

Summary: Westpac-Melbourne Institute consumer sentiment index up in December; consumers remain far from upbeat; ACGB yields decline a little; rate-rise expectations unchanged; responses showed material lift following RBA’s decision to pause; three of five sub-indices higher; more respondents expecting lower jobless rate.

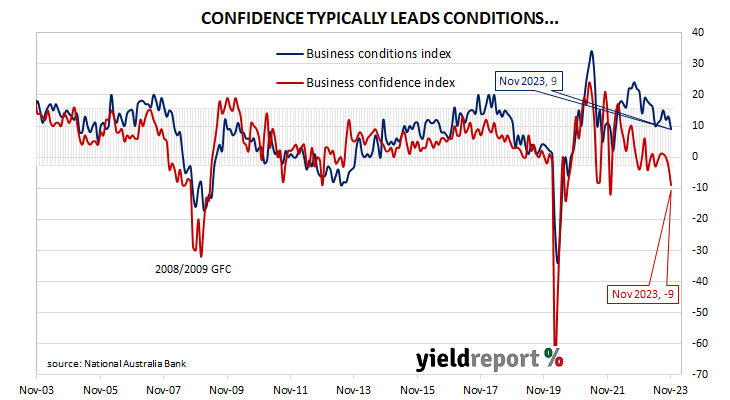
After a lengthy divergence between measures of consumer sentiment and business confidence in Australia which began in 2014, confidence readings of the two sectors converged again in mid-July 2018. Both measures then deteriorated gradually in trend terms, with consumer confidence leading the way. Household sentiment fell off a cliff in April 2020 but, after a few months of to-ing and fro-ing, it then staged a full recovery. However, consumer sentiment has deteriorated significantly over the past two years, while business sentiment has been more robust.

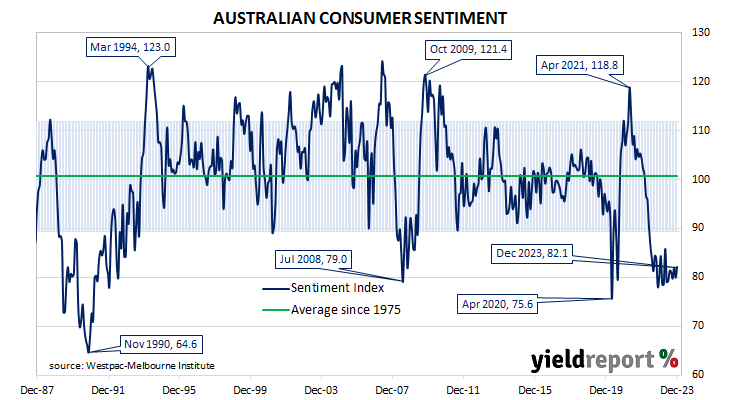
According to the latest Westpac-Melbourne Institute survey conducted in the first week of December, household sentiment has improved, albeit to a level which is still quite pessimistic.  Their Consumer Sentiment Index rose from November’s reading of 79.9 to 82.1, a reading which is still well below the “normal” range and significantly lower than the long-term average reading of just over 101.

“The gloom that deepened last month has lifted slightly heading into year-end but consumers remain far from upbeat,” said Westpac senior economist Matthew Hassan.

Any reading of the Consumer Sentiment Index below 100 indicates the number of consumers who are pessimistic is greater than the number of consumers who are optimistic.

The report was released on the same day as the latest NAB Business Survey and Commonwealth Government bond yields generally declined a little. By the close of business, the 3-year ACGB yield had slipped 1bp to 3.95%, the 10-year yield lost 2bps to 4.33% while the 20-year yield finished 1bp higher at 4.64%.

In the cash futures market, expectations regarding rate cuts remained essentially unchanged.  At the end of the day, contracts implied the cash rate would remain close to the current rate of 4.32% and average 4.305% in January and 4.34% in February. May contracts implied a 4.29% average cash rate, as did August contracts, while November contracts implied 4.08%, 24bps less than the current rate.

“The December survey detail again shows a clear impact from the RBA’s latest decision,” added Hassan. “This time, responses showed a material lift following the Reserve Bank Board’s decision to pause, with an average index read of 79.1 amongst those surveyed prior, lifting 5.4% to an average index read of 83.4 amongst those surveyed after.”

Three of the five sub-indices registered higher readings, with the “Economic conditions next 5 years” sub-index posting the largest monthly percentage gain.

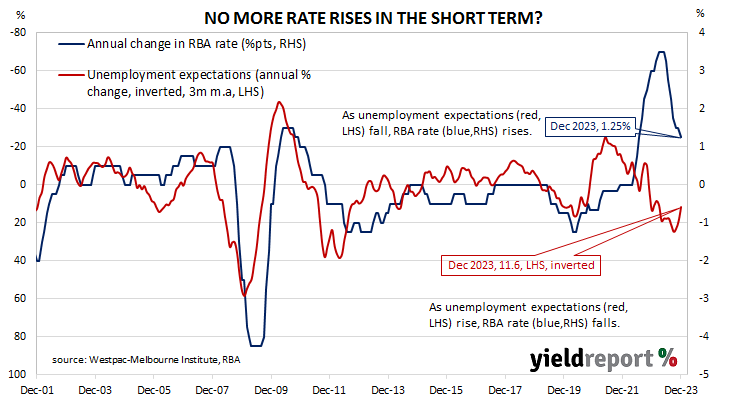
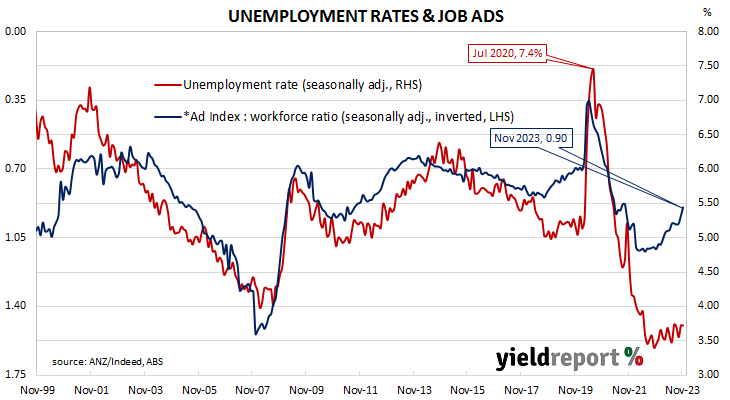
The Unemployment Expectations index, formerly a useful guide to RBA rate changes, fell from 130.4 to 128.9. Lower readings result from more respondents expecting a lower unemployment rate in the year ahead.

Business confidence crumbles; NAB indices down in November

12 December 2023

Summary: Business conditions deteriorate in November; business pessimism deepens, well below average; conditions, confidence appear to be softening further; ACGB yields decline a little; rate-rise expectations unchanged; Westpac: business confidence has crumbled; capacity utilisation rate declines, still at elevated level.

NAB’s business survey indicated Australian business conditions were robust in the first half of 2018, with a cyclical-peak reached in April of that year. Readings from NAB’s index then began to slip and forecasts of a slowdown in the domestic economy began to emerge in the first half of 2019 as the index trended lower. It hit a nadir in April 2020 as pandemic restrictions were introduced but then improved markedly over the next twelve months and has subsequently remained at robust levels.

According to NAB’s latest monthly business survey of around 500 firms conducted in last week of November, business conditions have deteriorated somewhat, albeit to a level which about average. NAB’s conditions index registered 9 points, down 4 points from October’s reading.

Business confidence deteriorated for a third consecutive month.  NAB’s confidence index fell from October’s revised reading of -3 points to -9 points, well below the long-term average.  Typically, NAB’s confidence index leads the conditions index by one month, although some divergences have appeared from time to time.

“Both confidence and conditions declined in the month and, after a period of relative stability through mid-2023, appear to be softening further,” said NAB Chief Economist Alan Oster. “Outside of the pandemic period, business confidence is now its weakest since around 2012, when conditions were significantly weaker and growth in advanced economies was slowing.”

The report was released on the same day as the latest Westpac-Melbourne Institute consumer sentiment survey and Commonwealth Government bond yields generally declined a little. By the close of business, the 3-year ACGB yield had slipped 1bp to 3.95%, the 10-year yield lost 2bps to 4.33% while the 20-year yield finished 1bp higher at 4.64%.

In the cash futures market, expectations regarding rate cuts remained essentially unchanged.  At the end of the day, contracts implied the cash rate would remain close to the current rate of 4.32% and average 4.305% in January and 4.34% in February. May contracts implied a 4.29% average cash rate, as did August contracts, while November contracts implied 4.08%, 24bps less than the current rate.

“In another sobering update on the Australian economy, it is apparent that business confidence has crumbled at year end,” said Westpac senior economist Andrew Hanlan. “The economy has buckled in the face of the sharply higher interest rates to tame inflation. These developments point to a looming business investment downturn and an easing of inflation pressures.”

NAB’s measure of national capacity utilisation slipped from October’s reading of 84.0% to 83.9%, a level which is still elevated from a historical perspective. All eight sectors of the economy were reported to be operating at or above their respective long-run averages.

Capacity utilisation is generally accepted as an indicator of future investment expenditure and it also has a strong inverse relationship with Australia’s unemployment rate.

US jobless rate falls to 3.7% in November

08 December 2023

Summary: US non-farm payrolls up 199,000 in November, in line with expectations; previous two months’ figures revised down by 35,000; jobless rate falls to 3.7%, participation rate ticks up to 62.8%; ANZ: recent months’ growth well above level associated with price stability; employed-to-population ratio rises to 60.5%; underutilisation rate down; annual hourly pay growth steady at 4.0%.

The US economy ceased producing jobs in net terms as infection controls began to be implemented in March 2020. The unemployment rate had been around 3.5% but that changed as job losses began to surge through March and April of 2020. The May 2020 non-farm employment report represented a turning point and subsequent months provided substantial employment gains which continued through into 2021 and 2022. Changes in recent months have been generally more in line with the average of the last decade.

According to the US Bureau of Labor Statistics, the US economy created an additional 199,000 jobs in the non-farm sector in November. The increase was in line with consensus expectations but more than the 150,000 jobs which had been added in October. Employment figures for October and September were revised down by a total of 35,000.

“The three-month average of 204,000 is well above the 150,000 long-run level often associated with price stability,” said ANZ FX analyst Felix Ryan.

The total number of unemployed decreased by 215,000 to 6.291 million while the total number of people who were either employed or looking for work increased by 532,000 to 168.260 million. These changes led to the US unemployment rate falling from October’s figure of 3.9% to 3.7% while the participation rate ticked up from 62.7% to 62.8%.

US Treasury yields rose significantly on the day, especially at the short end. By the close of business, the 2-year yield had gained 13bps to 4.72%, the 10-year yield had added 9bps to 4.23% while the 30-year yield finished 6bps higher at 4.31%.

In terms of US Fed policy, expectations of a lower federal funds rate in the next 12 months softened. At the close of business, contracts implied the effective federal funds rate would average 5.33% in December, in line with the current spot rate, 5.34% in January and 5.285% in March. November 2024 contracts implied 4.425%, 90bps less than the current rate.

One figure which is indicative of the “spare capacity” of the US employment market is the employment-to-population ratio. This ratio is simply the number of people in work divided by the total US population. It hit a cyclical-low of 58.2 in October 2010 before slowly recovering to just above 61% in late-2019. November’s reading rose from 60.2% to 60.5%, still some way from the April 2000 peak reading of 64.7%.

Apart from the unemployment rate, another measure of tightness in the labour market is the underutilisation rate and the latest reading of it registered 7.0%, down from 7.2% in October. Wage inflation and the underutilisation rate usually have an inverse relationship; hourly pay growth in the year to November remained steady at 4.0% after revisions.

ADP: Jobs boost over, more moderate hiring, wage growth expected in 2024

06 December 2023

Summary: ADP payrolls up 103,000 in November, less than consensus expectations; October number revised down by 7,000; ADP: boost behind us, more moderate hiring and wage growth expected in 2024; short-term US Treasury yields up modestly, longer-term yields down; expectations of Fed rate cuts in 2024 soften; positions up in small, medium, large businesses; all gains in services sector, led by trade, transportation, utilities sector.

The ADP National Employment Report is a monthly report which provides an estimate of US non-farm jobs in the private sector. Publishing of the report began in 2006 and its figures exhibited a high correlation with official non-farm payroll figures even though large differences arose in individual months. A major revamp of the ADP report took place in mid-2022, materially altering the data. However, month-on-month changes in the non-farm payroll data and ADP series are still highly correlated.

The latest ADP report indicated private sector job numbers increased by 103,000 in November, less than the 120,000 increase which had been generally expected. October’s rise was revised down by 7,000 to 106,000.

“Restaurants and hotels were the biggest job creators during the post-pandemic recovery,” said ADP Chief Economist Nela Richardson. “But that boost is behind us, and the return to trend in leisure and hospitality suggests the economy as a whole will see more moderate hiring and wage growth in 2024.”

Short-term US Treasury yields rose modestly on the day while longer-term yields fell. By the close of business, the 2-year had added 2bps to 4.60% while 10-year and 30-year yields both finished 6bps lower at 4.12% and 4.23% respectively.

In terms of US Fed policy, expectations of a lower federal funds rate in the next 12 months softened. At the close of business, contracts implied the effective federal funds rate would average 5.33% in December, in line with the current spot rate, 5.33% in January and 5.245% in March. November 2024 contracts implied 4.29%, 104bps less than the current rate.

Employment numbers in net terms increased in small, medium and large enterprises. Firms with less than 50 employees gained a net 6,000 positions, mid-sized firms (50-499 employees) added 68,000 positions while large businesses (500 or more employees) accounted for 33,000 more positions.

Employment at service providers accounted all of the total net increase, adding 117,000 positions. The “Trade, transportation and utilities” sector was the largest single source of gains, with 55,000 more positions, while the “Leisure and hospitality” sector was the month’s largest single source of losses, with 7,000 fewer positions. Total jobs among goods producers decreased by a net 14,000 positions.

Prior to the ADP report, the consensus estimate of the change in November’s official non-farm employment figure was 200,000. The non-farm payroll report will be released by the Bureau of Labor Statistics this coming Friday night (AEST), 8 December.

Job openings plunge in October JOLTS report; Treasury yields drop, rate cut likelihood rises

05 December 2023

Summary: US quit rate steady at 2.3% in October; US Treasury yields fall noticeably; expectations of Fed rate cuts in 2024 firm; fewer quits, openings, more separations; ANZ: conditions for FOMC rate cuts gradually falling into place.

The number of US employees who quit their jobs as a percentage of total employment increased slowly but steadily after the GFC. It peaked in March 2019 and then tracked sideways until virus containment measures were introduced in March 2020. The quit rate then plummeted as alternative employment opportunities rapidly dried up. Following the easing of US pandemic restrictions, it proceeded to recover back to its pre-pandemic rate in the third quarter of 2020 and trended higher through 2021 before easing through 2022 and the first half of 2023.

Figures released as part of the latest Job Openings and Labor Turnover Survey (JOLTS) report show the quit rate remained steady in October. 2.3% of the non-farm workforce left their jobs voluntarily, unchanged from September after rounding. Quits in the month declined by 18,000 while an additional 150,000 people were employed in non-farm sectors.

The report was released on the same day as the latest ISM services PMI reading and US Treasury yields fell noticeably on the day. By the close of business, the 2-year Treasury bond yield had lost 6bps to 4.58%, the 10-year yield had shed 9bps to 4.18% while the 30-year yield finished 12bps lower at 4.31%.

In terms of US Fed policy, expectations of a lower federal funds rate in the next 12 months firmed. At the close of business, contracts implied the effective federal funds rate would average 5.33% in December, in line with the current spot rate, 5.335% in January and 5.245% in March. November 2024 contracts implied 4.225%, 100bps less than the current rate.

The fall in total quits was led by 62,000 fewer resignations in the “Retail trade” sector while the “Professional and business services” sector experienced the largest gain, rising by 97,000. Overall, the total number of quits for the month decreased from September’s revised figure of 3.646 million to 3.628 million.         

Total vacancies at the end of October dropped by 617,000, or 6.6%, from September’s revised figure of 9.350 million to 8.733 million. The fall was driven by a 236,000 loss in the “Health care and social assistance” sector and a 168,000 loss in the Finance and insurance sector while the “Professional and business services” sector experienced the single largest increase, rising by 93,000. Overall, 12 out of 18 sectors experienced fewer job openings than in the previous month.  

“This underpinned expectations that the conditions for FOMC rate cuts are gradually, but persistently, falling into place,” said ANZ economist Kishti Sen. “Our assessment is that the gradual moderation in hiring remains but the labour market is not experiencing a hard landing.”

Total separations increased by 51,000, or 0.9%, from September’s revised figure of 5.595 million to 5.646 million. The rise was led by the “Professional and business services” sector where there were 121,000 more separations than in September. Separations increased in 9 of the 18 sectors.

The “quit” rate time series produced by the JOLTS report is a leading indicator of US hourly pay. As wages account for around 55% of a product’s or service’s price in the US, wage inflation and overall inflation rates tend to be closely related. Former Federal Reserve chief and current Treasury Secretary Janet Yellen was known to pay close attention to it.

Third consecutive month of job ad falls in November

04 December 2023

Summary: Job ads down 4.6% in November; 16.8% lower than November 2022; ANZ: down 8.4% over last 3 months; ACGB yields fall; rate-rise expectations soften; ANZ: points to further lift in jobless rate; ad index-to-workforce ratio falls.

From mid-2017 onwards, year-on-year growth rates in the total number of Australian job advertisements consistently exceeded 10%. That was until mid-2018 when the annual growth rate fell back markedly. 2019 was notable for its reduced employment advertising and this trend continued into the first quarter of 2020. Advertising plunged in April and May of 2020 as pandemic restrictions took effect but then recovered quite quickly, reaching historically-high levels in 2022.

According to the latest ANZ-Indeed figures, total advertisements fell by 4.6% in November on a seasonally adjusted basis. The result followed losses of 3.5% in October and 0.6% in September. On a 12-month basis, total job advertisements were 16.8% lower than in November 2022, down from October’s revised figure of -11.6%.

“ANZ-Indeed Australian Job Ads has fallen a cumulative 8.4% over the last three months but the series remains very high compared to historical levels,” said ANZ economist Madeline Dunk.

Commonwealth Government bond yields fell on the day, dragged down by large falls of US Treasury yields on Friday night. By the close of business, 3-year and 10-year ACGB yields had both lost 4bps to 4.04% and 4.46% respectively while the 20-year yield finished 5bps lower at 4.75%.

In the cash futures market, expectations regarding further rate rises softened.  At the end of the day, contracts implied the cash rate would remain close to the current rate of 4.32% and average 4.33% through December and January but then average 4.385% in February. May 2024 contracts implied a 4.40% average cash rate while August 2024 contracts implied 4.33%, just 1bp more than the current rate.

“The decline in job opportunities highlights that the labour market is cooling, and points to a further lift in the unemployment rate,” Dunk  added. “We expect the number of job ads to moderate as the impacts of this tightening cycle continue to show up in the labour market.”

The inverse relationship between job advertisements and the unemployment rate has been quite strong (see below chart), although ANZ themselves called the relationship between the two series into question in early 2019.  A higher job advertisement index as a proportion of the labour force is suggestive of lower unemployment rates in the near future while a lower ratio suggests higher unemployment rates will follow. November’s ad index-to-workforce ratio fell from 0.94 to 0.90 after revisions.

In 2008/2009, advertisements plummeted and Australia’s unemployment rate jumped from 4% to nearly 6% over a period of 15 months. When a more dramatic fall in advertisements took place in April 2020, the unemployment rate responded much more quickly.

Inflation Gauge up 0.3% in November; annual rate slows

04 December 2023

Melbourne Institute Inflation Gauge index up 0.3% in November; up 4.4% on annual basis; ACGB yields fall; rate-rise expectations soften.

The Melbourne Institute’s Inflation Gauge is an attempt to replicate the ABS consumer price index (CPI) on a monthly basis. It has turned out to be a reliable leading indicator of the CPI, although there are periods in which the Inflation Gauge and the CPI have diverged for as long as twelve months. On average, the Inflation Gauge’s annual rate tends to overestimate the ABS rate by around 0.1%, at least until recently.

The Melbourne Institute’s latest reading of its Inflation Gauge index indicates consumer prices increased by 0.3% in November, following a 0.1% decline in October and a flat result in September. The index rose by 4.4% on an annual basis, down from October’s comparable figure of 5.1%.

Commonwealth Government bond yields fell on the day, dragged down by large falls of US Treasury yields on Friday night. By the close of business, 3-year and 10-year ACGB yields had both lost 4bps to 4.04% and 4.46% respectively while the 20-year yield finished 5bps lower at 4.75%.

In the cash futures market, expectations regarding further rate rises softened.  At the end of the day, contracts implied the cash rate would remain close to the current rate of 4.32% and average 4.33% through December and January but then average 4.385% in February. May 2024 contracts implied a 4.40% average cash rate while August 2024 contracts implied 4.33%, just 1bp more than the current rate.

Central bankers desire a certain level of inflation which is “sufficiently low that it does not materially distort economic decisions in the community” but high enough so it does not constrain “a central bank’s ability to combat recessions.”

Home loan approvals up 5.4% in October

04 December 2023

Summary: Value of loan commitments up 5.4% in October, more than expected; 4.9% higher than October 2022; UBS: upside risk for housing credit growth; ACGB yields fall; rate-rise expectations soften; value of owner-occupier loan approvals up 5.6%; investor approvals up 5.0%; number of owner-occupier home loan approvals up 2.8%.

The number and value of home-loan approvals began to noticeably increase after the RBA reduced its cash rate target in a series of cuts beginning in mid-2019, potentially ending the downtrend which had been in place since mid-2017. Figures from February through to May of 2020 provided an indication the downtrend was still intact but subsequent figures then pushed both back to record highs in 2021. However, there has been a considerable pullback since then, although the total value of new loans is still elevated by historical standards.

October’s housing finance figures have now been released and total loan approvals excluding refinancing increased by 5.4% In dollar terms over the month, more than the 1.1% rise which had been generally expected as well as September’s revised gain of 1.5%. On a year-on-year basis, total approvals excluding refinancing rose by 4.9%, in contrast to the previous month’s comparable figure of -4.0%.

“Since the level of loans troughed in February 2023, they rebounded by a cumulative 17.5% and are now at the highest level since August 2022,” said UBS economist George Tharenou. “The stronger trend of loans in recent months now suggests upside risk to our outlook for housing credit growth.”

Commonwealth Government bond yields fell on the day, dragged down by large falls of US Treasury yields on Friday night. By the close of business, 3-year and 10-year ACGB yields had both lost 4bps to 4.04% and 4.46% respectively while the 20-year yield finished 5bps lower at 4.75%.

In the cash futures market, expectations regarding further rate rises softened.  At the end of the day, contracts implied the cash rate would remain close to the current rate of 4.32% and average 4.33% through December and January but then average 4.385% in February. May 2024 contracts implied a 4.40% average cash rate while August 2024 contracts implied 4.33%, just 1bp more than the current rate.

The total value of owner-occupier loan commitments excluding refinancing increased by 5.6%, up from September’s 0.8% rise. On an annual basis, owner-occupier loan commitments were 1.4% higher than in October 2022, in contrast with September’s comparable figure of -7.7%.

The total value of investor commitments excluding refinancing increased by 5.0%. The rise followed a 2.8% gain in September, taking the growth rate over the previous 12 months from 3.4% to 12.1%.

The total number of loan commitments to owner-occupiers excluding refinancing increased by 2.8% to 26351 on a seasonally adjusted basis. The rise was greater than September’s 0.6% increase and the annual contraction rate slowed 8.0% after revisions to 0.6%.

ISM PMI steady in November, at contractionary levels

01 December 2023

ISM PMI steady in November, below expectations; US Treasury yields fall heavily; expectations of Fed rate cuts in 2024 harden; ISM: reading corresponds to 0.7% US GDP contraction annualised.

The Institute of Supply Management (ISM) manufacturing Purchasing Managers Index (PMI) reached a cyclical peak in September 2017. It then started a downtrend which ended in March 2020 with a contraction in US manufacturing which lasted until June 2020. Subsequent month’s readings implied growth had resumed, with the index becoming stronger through to March 2021. Readings have since declined fairly steadily.

According to the ISM’s November survey, its PMI recorded a reading of 46.7%, below the generally expected figure of 47.7% but unchanged from October’s reading. The average reading since 1948 is roughly 53.0% and any reading below 50% implies a contraction in the US manufacturing sector relative to the previous month.

US Treasury yields fell heavily on the day. By the close of business, the 2-year Treasury bond yield had lost 15bps to 4.56%, the 10-year yield had shed 13bps to 4.22% while the 30-year yield finished 11bps lower at 4.41%.

In terms of US Fed policy, expectations of a lower federal funds rate in the next 12 months hardened materially. At the close of business, contracts implied the effective federal funds rate would average 5.33% in December, in line with the current spot rate, 5.33% in January and 5.24% in March. November 2024 contracts implied 4.21%, 102bps less than the current rate.

Purchasing managers’ indices (PMIs) are economic indicators derived from monthly surveys of executives in private-sector companies. They are diffusion indices, which means a reading of 50% represents no change from the previous period, while a reading under 50% implies respondents reported a deterioration on average. A reading “above 48.7%, over a period of time, generally indicates an expansion of the overall economy”, according to the ISM.    

The ISM’s manufacturing PMI figures appear to lead US GDP by several months despite a considerable error in any given month. The chart below shows US GDP on a “year on year” basis (and not the BEA annualised basis) against US GDP implied by monthly PMI figures. 

According to the ISM and its analysis of past relationships between the PMI and US GDP, November’s PMI corresponds to an annualised contraction rate of -0.7%, or -0.2% over a quarter. However, regression analysis on a year-on-year basis still suggests a 12-month GDP growth rate of 1.6% five months after this latest report.

The ISM index is one of two monthly US PMIs, the other being an index published by S&P Global. S&P Global produces a “flash” estimate in the last week of each month which comes out about a week before the ISM index is published. The S&P Global flash November manufacturing PMI registered 50.7%, unchanged from October’s final figure.

Core PCE inflation slowdown continues in October

30 November 2023

Summary: US core PCE price index up 0.2% in October, as expected; annual rate slows to 3.5%; NAB: decline in recent months impressive; Treasury yields rise; Fed rate-cut expectations for 2024 soften; ANZ: clear step down in core inflation pressures.

One of the US Fed’s favoured measures of inflation is the change in the core personal consumption expenditures (PCE) price index. After hitting the Fed’s target at the time of 2.0% in mid-2018, the annual rate then hovered in a range between 1.8% and 2.0% before it eased back to a range between 1.5% and 1.8% through 2019. It then plummeted below 1.0% in April 2020 before rising back to around 1.5% in the September quarter of that year. It has since increased significantly and still remains above the Fed’s target even after recent declines.

The latest figures have now been published by the Bureau of Economic Analysis as part of the October personal income and expenditures report. Core PCE prices rose by 0.2% over the month, in line with expectations but less than September’s 0.3% increase. On a 12-month basis, the core PCE inflation rate slowed from September’s rate of 3.7% to 3.5%.

“To put these numbers into perspective, back in July the core PCE was 4.3%, so the decline in recent months has been quite impressive with the 3-month annualised rate now ticking at just 2.2%,” said NAB senior FX strategist Rodrigo Catril.

US Treasury bond yields rose noticeably on the day despite the figures. By the close of business, the 2-year Treasury bond yield had added 6bps to 4.71%, the 10-year yield had gained 9bps to 4.35% while the 30-year yield finished 8bps higher at 4.52%.

In terms of US Fed policy, expectations of a lower federal funds rate in the next 12 months softened. At the close of business, contracts implied the effective federal funds rate would average 5.33% in December, in line with the current spot rate, 5.335% in January and 5.29% in March. November 2024 contracts implied 4.41%, 92bps less than the current rate.

“There is a clear step down in core inflation pressures,” said ANZ Head of FX Research Mahjabeen Zaman. “In Q1, the 3-month average was 0.37%, [in] Q2 it was 0.32% and now the 3-month average is 0.2%.”

The core version of PCE strips out energy and food components, which are volatile from month to month, in an attempt to identify the prevailing trend. It is not the only measure of inflation used by the Fed; the Fed also tracks the Consumer Price Index (CPI) and the Producer Price Index (PPI) from the Department of Labor. However, it is the one measure which is most often referred to in FOMC minutes.

Click for more news