News

Euro-zone industrial production steady in October

13 December 2024

Summary: Euro-zone industrial production flat in October, in line with expectations; down 1.2% on annual basis; German, French 10-year yields rise; expansion in only one of four largest EU economies.

Following a recession in 2009/2010 and the debt-crisis which flowed from it, euro-zone industrial production recovered and then reached a peak four years later in 2016. Growth rates then fluctuated for two years before beginning a steady and persistent slowdown from the start of 2018. That decline was transformed into a plunge in March and April of 2020 which then took over a year to claw back. Production levels since early 2023 have generally declined.

According to the latest figures released by Eurostat, euro-zone industrial production remained unchanged in October on a seasonally-adjusted and calendar-adjusted basis. The flat result was in line with expectations and up from September’s 1.5% contraction after revisions. On an annual basis, the contraction rate slowed from September’s revised rate of 2.2% to 1.2%.

Long-term German and French sovereign bond yields finished higher on the day. By the close of business, German and French 10-year bond yield had both gained 6bps to 2.25% and 3.05% respectively.

Industrial production expanded in only one of the euro-zone’s four largest economies. Germany’s production contracted by 1.1% over the month while the comparable growth figures for France, Spain and Italy were -0.2%, 1.0% and 0.0% respectively.

US producer prices continue upward drift in November

12 December 2024

Summary: US producer price index (PPI) up 0.4% in November, greater than expected; annual rate rises to 3.0%; “core” PPI up 0.2% over month, up 3.5% over year; ANZ: egg prices, profit margins a major driver; US Treasury yields rise; rate-cut expectations soften; services prices up 0.2%, goods prices up 0.7%.

Around the end of 2018, the annual inflation rate of the US producer price index (PPI) began a downtrend which continued through 2019. Months in which producer prices increased suggested the trend may have been coming to an end, only for it to continue, culminating in a plunge in April 2020. Figures returned to “normal” towards the end of that year but then moved well above the long-term average in 2021 and 2022 before falling back over 2023.

The latest figures published by the Bureau of Labor Statistics indicate producer prices increased by 0.4% in November after seasonal adjustments. The rise was greater than the 0.3% increase which had been generally expected as well as October’s increase of the same amount. On a 12-month basis, the rate of producer price inflation after seasonal adjustments accelerated from 2.6% to 3.0%.

Producer prices excluding foods and energy, or “core” PPI, rose by 0.2% after seasonal adjustments. The rise was in line with expectations but less than October’s 0.3% increase. The annual growth rate ticked up from 3.4% after revisions to 3.5%.

“The rise in the price of eggs accounted for 25% of the rise in final demand goods,” observed ANZ economist Jack Chambers. “Within final demand services, wholesaler and retailer margins rose 0.8% as outlets took advantage of the holiday season and buoyant consumers to push up margins.”

US Treasury bond yields rose on the day. By the close of business, the 2-year Treasury yield had added 4bps to 4.20%, the 10-year had gained 6bps to 4.33% while the 30-year yield finished 7bps higher at 4.55%.

In terms of US Fed policy, expectations of a lower federal funds rate in the next 12 months softened, although another three 25bp cuts are still currently priced in. At the close of business, contracts implied the effective federal funds rate would average 4.48% in December, 4.34% in January and 4.28% in February. November 2025 contracts implied 3.825%, 75bps less than the current rate.

“October PPI data showed a slight acceleration in price pressures but no imminent reversal of the disinflation process,” said ANZ economist Felix Ryan. “Together with the CPI data the day before, early estimates signal that October PCE data could be firm.”

The BLS stated the rise of the index was mostly attributable to a 0.3% increase in services prices. The final demand goods index rose by 0.1%.

The producer price index is a measure of prices received by producers for domestically produced goods, services and construction. It is put together in a fashion similar to the consumer price index (CPI) except it measures prices received from the producer’s perspective rather than from the perspective of a retailer or a consumer. It is another one of the various measures of inflation tracked by the US Fed, along with core personal consumption expenditure (PCE) price data. 

Trend is “bumpy”; US CPI up 0.3% in November, rises to 2.7% over year

11 December 2024

Summary: US CPI up 0.3% in November, in line with expectations; annual inflation rate ticks up 2.6% to 2.7%; “core” rate up 0.3%, up 3.3% over year; ANZ: services sector seems to be showing evidence of disinflation, although trend is bumpy; US Treasury yields up; rate-cut expectations soften; Westpac: largely be attributable to strong growth in used car and truck prices; non-energy services again main driver of overall result.

The annual rate of US inflation as measured by changes in the consumer price index (CPI) halved from nearly 3% in the period from July 2018 to February 2019. It then fluctuated in a range from 1.5% to 2.0% through 2019 before rising above 2.0% in the final months of that year. Substantially lower rates were reported from March 2020 to May 2020 and they remained below 2% until March 2021. They then rose significantly before declining from mid-2022.

The latest US CPI figures released by the Bureau of Labor Statistics indicated seasonally-adjusted consumer prices increased by 0.3% on average in November. The rise was in line with expectations but up from the 0.2% increase in October. On a 12-month basis, the inflation rate ticked up from 2.6% to 2.7%.

“Headline” inflation is known to be volatile and so references are often made to “core” inflation for analytical purposes. The core prices index, the index which excludes the more variable food and energy components, increased by 0.3% on a seasonally-adjusted basis over the month, in line with expectations as well the rises in the previous three months. The annual growth rate remained steady at 3.3%.

“For core, the services sector seems to be showing evidence of disinflation, although the trend is bumpy,” said ANZ senior economist Adelaide Timbrell.

US Treasury bond yields rose by increasing amounts along the curve. By the close of business, the 2-year Treasury yield had added 2bps to 4.16%, the 10-year yield had gained 5bps to 4.27% while the 30-year yield 6bps higher at 4.48%.

In terms of US Fed policy, expectations of a lower federal funds rate in the next 12 months soften, although another three 25bp cuts are still currently priced in. At the close of business, contracts implied the effective federal funds rate would average 4.48% in December, 4.43% in January and 4.29% in February. November 2025 contracts implied 3.78%, 80bps less than the current rate.

“Core goods prices ticked up 0.3% after a lengthy period of disinflation/deflation,” noted Westpac economist Jameson Coombs. “However, this result looks to largely be attributable to strong growth in used car and truck prices as vehicles are replaced following recent severe weather events.” The largest influence on headline results is often the change in fuel prices.

Prices of “Energy commodities”, the segment which includes vehicle fuels, increased by 0.5% and contributed 0.02 percentage points to the total. However, prices of non-energy services, the segment which includes actual and implied rents, again had the largest single effect on the total as they contributed 0.18 percentage points following a 0.3% increase on average.

Business conditions, confidence, slump in November; Feb rate cut back in play

10 December 2024

Summary: Business conditions deteriorate in November; business confidence slumps, well below long-term average; NAB: points to soft growth in Dec quarter; ACGB yields fall noticeably; rate-cut expectations harden; Westpac: update consistent with broader downward trend in businesses’ assessment of business conditions; capacity utilisation rate unchanged.

NAB’s business survey indicated Australian business conditions were robust in the first half of 2018, with a cyclical-peak reached in April of that year. Readings from NAB’s index then began to slip and forecasts of a slowdown in the domestic economy began to emerge in the first half of 2019 as the index trended lower. It hit a nadir in April 2020 as pandemic restrictions were introduced but then improved markedly over the next twelve months and subsequently remained at robust levels until recently.

According to NAB’s latest monthly business survey of around 350 firms conducted in the third week of November, business conditions have deteriorated noticeably to a level below the long-term average. NAB’s conditions index registered 2 points, down 5 points from October’s reading.

Business confidence also slumped.  NAB’s confidence index dropped 8 points to -3 points, a reading which is well below its long-term average.  NAB’s confidence index typically leads the conditions index by one month, although some divergences have appeared from time to time.

“Overall, the survey points to ongoing soft growth in Q4, though with capacity utilisation unchanged at an above-average level it will likely take more time for price pressures to fully normalise,” said NAB Head of Australian Economics Gareth Spence. “Indeed, price and cost growth indicators were broadly unchanged across the survey, though retail prices fell back to 0.6% in quarterly terms.”

The figures came out on the same day as the latest RBA monetary policy decision and Commonwealth Government bond yields fell noticeably across the curve. By the close of business, the 3-year ACGB yield had shed 8bps to 3.71% while 10-year and 20-year yields both finished 6bps lower at 4.15% and 4.50% respectively.

Expectations regarding rate cuts in the next twelve months hardened, with a February cut now viewed again as likely. Cash futures contracts implied an average of 4.265% in February, 3.945% in May and 3.6445% in August. November contracts implied 3.505%, 83bps less than the current cash rate.

“While recent NAB business survey updates had given some hope that Australian businesses might be turning more optimistic, the latest survey’s update for November was more consistent with the broader downward trend in their assessment of business conditions seen since early 2022,” noted Westpac senior economist Mantas Vanagas. “That resulted in more pessimism about the future economic outlook.”

NAB’s measure of national capacity utilisation remained unchanged from October’s revised reading of 82.4%, a level which is still quite robust from a historical perspective. Five of the eight sectors of the economy were reported to be operating at or above their respective long-run averages.

Capacity utilisation is generally accepted as an indicator of future investment expenditure and it also has a strong inverse relationship with Australia’s unemployment rate.

US job market “slowly softening”; beats expectations in Nov

06 December 2024

Summary: US non-farm payrolls up 227,000 in November, above expectations; previous two months’ figures revised up by 56,000; jobless rate ticks up to 4.2%, participation rate slips to 62.5%; Westpac: US labour market conditions slowly softening; US Treasury yields fall; expectations of Fed rate cuts harden; employed-to-population ratio falls to 59.8%; underutilisation rate ticks up to 7.8%; annual hourly pay growth steady at 4.0%.

The US economy ceased producing jobs in net terms as infection controls began to be implemented in March 2020. The unemployment rate had been around 3.5% but that changed as job losses began to surge through March and April of 2020. The May 2020 non-farm employment report represented a turning point and subsequent months provided substantial employment gains which have continued to the present.

According to the US Bureau of Labor Statistics, the US economy created an additional 227,000 jobs in the non-farm sector in November. The increase was greater than the 200,000 rise which had been generally expected but well in excess of the 36,000 jobs which had been added in October after revisions. Employment figures for September and October were revised up by a total of 56,000.

The total number of unemployed increased by 161,000 to 7.145 million while the total number of people who were either employed or looking for work decreased by 194,000 to 168.286 million. These changes led to the US unemployment rate ticking up from 4.1% in October to 4.2%. The participation rate slipped from 62.6% to 62.5%.

“Labour market conditions are slowly softening with the unemployment rate ticking higher to 4.2% in November, while wage pressures remain contained,” said Westpac senior economist Pat Bustamante.

US Treasury bond yields fell by declining amounts across a steeper curve on the day. By the close of business, the 2-year yield had shed 5bps to 4.10%, the 10-year yield had lost 2bps to 4.16% while the 30-year yield finished unchanged at 4.34%.

In terms of US Fed policy, expectations of a lower federal funds rate in the next 12 months hardened, with at least another three 25bp cuts currently priced in. At the close of business, contracts implied the effective federal funds rate would average 4.49% in December, 4.36% in January and 4.285% in February. November 2025 contracts implied 3.715%, 87bps less than the current rate.

One figure which is indicative of the “spare capacity” of the US employment market is the employment-to-population ratio. This ratio is simply the number of people in work divided by the total US population. It hit a cyclical-low of 58.2 in October 2010 before slowly recovering to just above 61% in early 2020. November’s reading fell 0.2 percentage points to 59.8%, some way from the April 2000 peak reading of 64.7%.

Apart from the unemployment rate, another measure of tightness in the labour market is the underutilisation rate. The underutilisation rate ticked up from 7.7% to 7.8% in November. Wage inflation and the underutilisation rate have an inverse relationship over time but not necessarily from month to month. Private hourly pay growth in the year to November remained steady at 4.0%.

US quits, openings, separations all up in October

03 December 2024

Summary: US quit rate rises in October; ANZ: monetary policy is restrictive, restraining labour demand; short-term US Treasury yields steady, longer-term yields rise; expectations of Fed rate cuts firm; more quits, more openings, more separations; Westpac: job openings consistent with gradually loosening conditions in labour market.

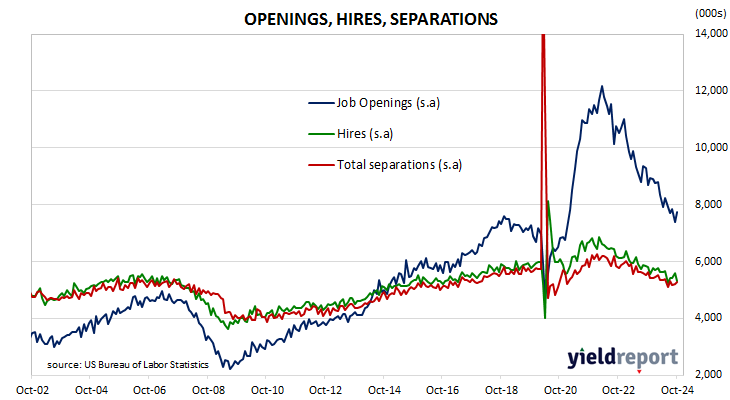
The number of US employees who quit their jobs as a percentage of total employment increased slowly but steadily after the GFC. It peaked in March 2019 and then tracked sideways until virus containment measures were introduced in March 2020. The quit rate then plummeted as alternative employment opportunities rapidly dried up. Following the easing of US pandemic restrictions, it proceeded to recover back to its pre-pandemic rate in the third quarter of 2020 and trended higher through 2021 before easing through 2022, 2023 and the first half of 2024.

Figures released as part of the latest Job Openings and Labor Turnover Survey (JOLTS) report show the quit rate increased in October after revisions. 2.1% of the non-farm workforce left their jobs voluntarily, up from 1.9% in September. Quits in the month increased by 228,000 while an additional 12,000 people were employed in non-farm sectors.

“The data imply monetary policy is restrictive and restraining labour demand,” said ANZ senior economist Adelaide Timbrell. “The rise in the quits ratio to 2.1 in October may have reflected the bounce in job openings in the month.”

Short-term US Treasury bond yields remained unchanged on the day while longer-term yields increased. By the close of business, the 2-year Treasury bond yield had returned to its starting point at 4.18%, the 10-year yield had gained 4bps to 4.23% while the 30-year yield finished 1bp higher at 4.41%.

In terms of US Fed policy, expectations of a lower federal funds rate in the next 12 months firmed. At the close of business, contracts implied the effective federal funds rate would average 4.505% in December, 4.395% in January and 4.335% in February. November 2025 contracts implied 3.805%, 77bps less than the current rate.

The rise in total quits was led by 90,000 more resignations in the “Accommodation and food services” sector while the “Retail trade” sector experienced the largest decrease, 26,000. Overall, the total number of quits for the month increased from September’s revised figure of 3.098 million to 3.326 million.         

Total vacancies at the end of October jumped by 372,000, or 5.0%, from September’s revised figure of 7.372 million to 7.744 million. The increase was driven by 209,000 more open positions in the “Professional and business services” sector while the “Wholesale trade” and “Other services” sectors both experienced 37,000 fewer offerings, representing the largest sectoral declines. Overall, 10 out of 18 sectors experienced more job openings than in the previous month.  

“So while the monthly changes are hard to interpret due to one-off distortions, in the bigger picture the job openings are consistent with gradually loosening conditions in the labour market,” said Westpac economist Jameson Coombs.

Total separations increased by 65,000, or 1.3%, from September’s revised figure of 5.196 million to 5.261 million. The rise was led by the “Health care and social assistance” sector where there were 75,000 more separations while the “Construction” sector experienced 52,000 fewer separations. Separations increased in 9 of the 18 sectors.

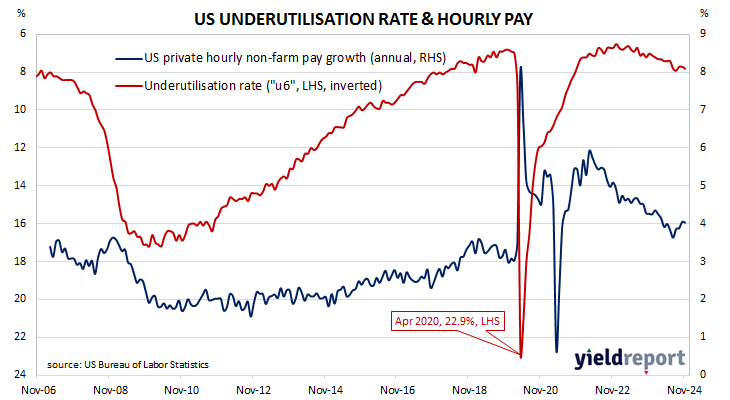
The “quit” rate time series produced by the JOLTS report is a leading indicator of US hourly pay. As wages account for around 55% of a product’s or service’s price in the US, wage inflation and overall inflation rates tend to be closely related. Former Federal Reserve chief and current Treasury Secretary Janet Yellen was known to pay close attention to it.

ISM November PMI: US manufacturing still contracting but at slower rate

02 December 2024

Summary: ISM manufacturing PMI up in November, above expectations; ISM: activity contracts again but at slower rate; US Treasury yields rise; expectations of Fed rate cuts soften; Westpac: new orders index up above 50; ISM: reading corresponds to 1.7% US GDP growth annualised.

The Institute of Supply Management (ISM) manufacturing Purchasing Managers Index (PMI) reached a cyclical peak in September 2017. It then started a downtrend which ended in March 2020 with a contraction in US manufacturing which lasted until June 2020. Subsequent month’s readings implied growth had resumed, with the index becoming stronger through to March 2021. Readings then declined fairly steadily until mid-2023 and have since generally stagnated.

According to the ISM’s November survey, its manufacturing PMI recorded a reading of 48.4%, above the generally expected figure of 47.6% as well as October’s reading of 46.5. The average reading since 1948 is roughly 53.0% and any reading below 50% implies a contraction in the US manufacturing sector relative to the previous month.

“US manufacturing activity contracted again in November, but at a slower rate compared to last month,” said Timothy Fiore of the ISM Manufacturing Business Survey Committee. “Demand continues to be weak but may be moderating, output declined again and inputs stayed accommodative.”

US Treasury bond yields rose modestly across the curve on the day. By the close of business, the 2-year Treasury bond yield had gained 2bps to 4.18%, the 10-year yield had added 1bp to 4.19% while the 30-year yield finished 3bps higher at 4.40%.

In terms of US Fed policy, expectations of a lower federal funds rate in the next 12 months softened, although  three 25bp cuts are still almost fully priced in. At the close of business, contracts implied the effective federal funds rate would average 4.50% in December, 4.425% in January and 4.38% in February. November 2025 contracts implied 3.85%, 73bps less than the current rate.

“The new orders index was up solidly to 50.4, the first reading above 50 in eight months,” noted Westpac economist Jameson Coombs. “Manufacturers responded by advancing their hiring, with the employment index also rising.”

Purchasing managers’ indices (PMIs) are economic indicators derived from monthly surveys of executives in private-sector companies. They are diffusion indices, which means a reading of 50% represents no change from the previous period, while a reading under 50% implies respondents reported a deterioration on average. A reading “above 42.5%, over a period of time, generally indicates an expansion of the overall economy” according to the ISM’s most-recent estimate.      

The ISM’s manufacturing PMI figures appear to lead US GDP by several months despite a considerable error in any given month. The chart below shows US GDP on a “year on year” basis (and not the BEA annualised basis) against US GDP implied by monthly PMI figures.  

According to the ISM and its analysis of past relationships between the PMI and US GDP, November’s PMI corresponds to an annualised growth rate of 1.7%, or about 0.4% over a quarter. Regression analysis on a year-on-year basis suggests a 12-month GDP growth rate of 2.0% five months after this latest report.

The ISM index is one of two monthly US PMIs, the other being an index published by S&P Global. S&P Global produces a “flash” estimate in the last week of each month which comes out about a week before the ISM index is published. The S&P Global November flash manufacturing PMI registered 48.8%, up 0.3 percentage point from September’s final figure.

November job ads pull back after Sep & Oct rises

02 December 2024

Summary: Job ads down 1.3% in November; 11.5% lower than November 2023; ANZ: September, October advertising may have eaten into end-of-year-related hiring; short-term ACGB yields rise modestly, longer-terms yields steady; rate-cut expectations soften; Indeed: sharp fall in retail only partially offset by food services; ad index-to-workforce ratio slips.

From mid-2017 onwards, year-on-year growth rates in the total number of Australian job advertisements consistently exceeded 10%. That was until mid-2018 when the annual growth rate fell back markedly. 2019 was notable for its reduced employment advertising and this trend continued into the first quarter of 2020. Advertising then plunged in April and May of 2020 as pandemic restrictions took effect but recovered quite quickly, reaching historically-high levels in 2022.

According to the latest reading of the ANZ-Indeed Job Ads Index, total job advertisements in November decreased by 1.3% on a seasonally adjusted basis. Their index declined from 116.6 in October after revisions to 115.1, with the loss following rises of 2.3% and 0.7% in September and October respectively. On a 12-month basis, total job advertisements were 11.5% lower than in November 2023, up from October’s revised figure of -15.4%.

“It is possible some of the lift in September and October Job Ads reflected a pull-forward in end-of-year-related hiring,” said ANZ economist Madeline Dunk. “The coming months will determine whether the series resumes its previous downward trend.”

Short-term Australian Commonwealth Government bond yields rose modestly on the day while longer-term yields finished unchanged, ignoring the noticeable downward movement of US Treasury yields on Friday night. By the close of business, the 3-year ACGB yield had added 2bps to 3.93% while 10-year and 20-year yields both finished steady at 4.35% and 4.68% respectively.

Expectations regarding rate cuts in the next twelve months softened a touch. Cash futures contracts implied an average of 4.335% in December, 4.305% in February and 4.135% in May. November 2025 contracts implied 3.80%, 54bps less than the current cash rate.

“Christmas-related hiring continues to influence national trends, with a sharp fall in retail opportunities in November only partially offset by growing opportunities in food services ahead of the holidays,” said Indeed senior economist Callam Pickering. “Overall, Christmas-related hiring has provided more uplift to Job Ads this year than last year.”

The inverse relationship between job advertisements and the unemployment rate or the underemployment rate has been quite strong (see below chart), although ANZ themselves called the relationship between the series into question in early 2019. 

A higher job advertisement index as a proportion of the labour force is suggestive of lower unemployment rates in the near future while a lower ratio suggests higher unemployment rates will follow. November’s ad index-to-workforce ratio slipped from 0.77 to 0.76.

In 2008/2009, advertisements plummeted and Australia’s unemployment rate jumped from 4% to nearly 6% over a period of 15 months. When a more dramatic fall in advertisements took place in April 2020, the unemployment rate responded much more quickly.

Inflation Gauge up 0.2% in November; up 2.9% over year

02 December 2024

Summary: Melbourne Institute Inflation Gauge index up 0.2% in November; up 2.9% on annual basis; short-term ACGB yields rise modestly, longer-terms yields steady; rate-cut expectations soften.

The Melbourne Institute’s Inflation Gauge is an attempt to replicate the ABS consumer price index (CPI) on a monthly basis. It has turned out to be a reliable leading indicator of the CPI, although there are periods in which the Inflation Gauge and the CPI have diverged for as long as twelve months. On average, the Inflation Gauge’s annual rate tends to overestimate the ABS rate by around 0.1%, or at least until recently.

The Melbourne Institute’s latest reading of its Inflation Gauge index indicates consumer prices increased by 0.2% in November, down from 0.3% in October but up from September’s 0.1%. Inflation on an annual basis slowed from 3.0% to 2.9%.

Short-term Australian Commonwealth Government bond yields rose modestly on the day while longer-term yields finished unchanged, ignoring the noticeable downward movement of US Treasury yields on Friday night. By the close of business, the 3-year ACGB yield had added 2bps to 3.93% while 10-year and 20-year yields both finished steady at 4.35% and 4.68% respectively.

Expectations regarding rate cuts in the next twelve months softened a touch. Cash futures contracts implied an average of 4.335% in December, 4.305% in February and 4.135% in May. November 2025 contracts implied 3.80%, 54bps less than the current cash rate

Central bankers desire a certain level of inflation which is “sufficiently low that it does not materially distort economic decisions in the community” but high enough so it does not constrain “a central bank’s ability to combat recessions.”

October retail spending up 0.6%; back above population growth

02 December 2024

Summary: Retail sales up 0.6% in October, more than expected; up 3.4% on 12-month basis; Westpac: implies steady recovery in nominal per capita spending; short-term ACGB yields rise modestly, longer-terms yields steady; rate-cut expectations soften; Westpac: expect spending growth to recover from here; largest influence on result from “Other” segment.

Growth figures of domestic retail sales spent most of the 2010s at levels below the post-1992 average. While economic conditions had been generally favourable, wage growth and inflation rates were low. Expenditures on goods then jumped in the early stages of 2020 as government restrictions severely altered households’ spending habits. Households mostly reverted to their usual patterns as restrictions eased in the latter part of 2020 and throughout 2021.

According to the latest ABS figures, total retail sales increased by 0.6% on a seasonally adjusted basis in October. The result was greater than the 0.4% increase which had been generally expected as well as September’s 0.1% rise. Sales increased by 3.4% on an annual basis, up from September’s comparable figure of 2.4%.

“With population growth running around 2.3% per year, the result implies a steady recovery in nominal per capita spending trends,” said Westpac economist Neha Sharma.

Short-term Australian Commonwealth Government bond yields rose modestly on the day while longer-term yields finished unchanged, ignoring the noticeable downward movement of US Treasury yields on Friday night. By the close of business, the 3-year ACGB yield had added 2bps to 3.93% while 10-year and 20-year yields both finished steady at 4.35% and 4.68% respectively.

Expectations regarding rate cuts in the next twelve months softened a touch. Cash futures contracts implied an average of 4.335% in December, 4.305% in February and 4.135% in May. November 2025 contracts implied 3.80%, 54bps less than the current cash rate.

“Stage 3 tax cuts, cost-of-living relief and moderating inflation appear to be supporting the upward trend in retail turnover,” said ANZ economist Sophia Angala. “We continue to expect spending growth to recover from here, with near-term strength as price-sensitive households participate in end-of-year sales events like Black Friday.”

Retail sales are typically segmented into six categories, with the “Food” segment accounting for 40% of total sales. However, the largest influence on the month’s total came from the “Other” segment where sales rose by 1.6%.

Click for more news