News

Margin squeeze; US PPI falls 0.5% in October

15 November 2023

Summary: US producer price index (PPI) down 0.5% in October, contrasts with expected rise; annual rate slows to 1.3%; “core” PPI flat; NAB: squeeze on margins is supporting disinflation process; US Treasury yields up noticeably; 2024 rate-cut expectations soften; goods prices down 1.4%, services prices flat.

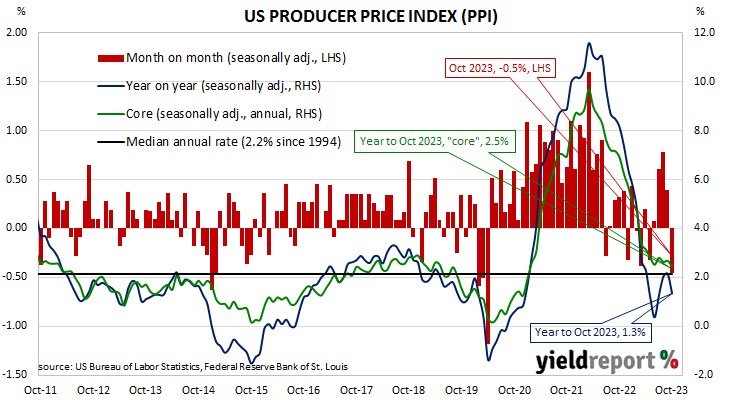
Around the end of 2018, the annual inflation rate of the US producer price index (PPI) began a downtrend which continued through 2019. Months in which producer prices increased suggested the trend may have been coming to an end, only for it to continue, culminating in a plunge in April 2020. Figures returned to “normal” towards the end of that year but then moved well above the long-term average in 2021 and 2022.

The latest figures published by the Bureau of Labor Statistics indicate producer prices decreased by 0.5% after seasonal adjustments in October. The result contrasted with the 0.1% increase which had been generally expected as well as September’s 0.4% increase after revisions. On a 12-month basis, the rate of producer price inflation after seasonal adjustments and revisions slowed from September’s revised figure of 2.1% to 1.3%.

Producer prices excluding foods and energy, or “core” PPI, were flat after seasonal adjustments. The result was less than the expected 0.3% increase as well as September’s 0.2%. The annual rate slowed from 2.7% to 2.5%.

“A 0.7% fall in trade services margins offset gains elsewhere and suggests some squeeze on margins is supporting the disinflation process as the demand and supply balance improves,” said NAB senior economist Taylor Nugent.

The figures were released at the same time as the latest retail sales report and US Treasury bond yields rose noticeably on the day. By the close of business, the 2-year Treasury yield had added 8bps to 4.92%, the 10-year yield had gained 9bps to 4.54% while the 30-year yield finished 7bps higher at 4.70%.

In terms of US Fed policy, expectations of a lower federal funds rate in the next 12 months softened.  At the close of business, contracts implied the effective federal funds rate would average 5.33% in December, in line with the current spot rate, 5.33% in January and 5.31% in March. November 2024 contracts implied 4.615%, 71bps less than the current rate.

The BLS stated a 1.4% fall in final demand goods was behind the overall fall. Prices of final demand services remained flat.

The producer price index is a measure of prices received by producers for domestically produced goods, services and construction. It is put together in a fashion similar to the consumer price index (CPI) except it measures prices received from the producer’s perspective rather than from the perspective of a retailer or a consumer. It is another one of the various measures of inflation tracked by the US Fed, along with core personal consumption expenditure (PCE) price data. 

One step forward, one back: euro-zone ind. production figures down 1.1% in Sep

15 November 2023

Summary: Euro-zone industrial production down 1.1% in September, less than expected; down 6.9% on annual basis; German, French 10-year yields rise; output contracts in two of four largest euro economies.

Following a recession in 2009/2010 and the debt-crisis which flowed from it, euro-zone industrial production recovered and then reached a peak four years later in 2016. Growth rates then fluctuated for two years before beginning a steady and persistent slowdown from the start of 2018. That decline was transformed into a plunge in March and April of 2020 which then took over a year to claw back. Production levels in recent quarters have generally stagnated in trend terms.

According to the latest figures released by Eurostat, euro-zone industrial production contracted by 1.1% in September on a seasonally-adjusted and calendar-adjusted basis. The fall was slightly greater than the 1.0% contraction which had been generally expected and it contrasted with August’s 0.6% expansion. The calendar-adjusted contraction rate on an annual basis accelerated, from August’s rate of 5.1% to 6.9%.

German and French sovereign bond yields rose on the day despite the figures. By the close of business, the German 10-year bond yield had added 4bps to 2.64% while the French 10-year bond yield finished 5bps higher at 3.36%.

Industrial production contracted in two of the euro-zone’s four largest economies. Germany’s production fell by 1.6% over the month while the comparable figures for France, Spain and Italy were -0.5%, +1.0% and 0.0% respectively.

Bond yields plunge on US October CPI miss

14 November 2023

Summary: US CPI flat in October, below expectations; “core” rate up 0.2%; ANZ: monetary restraint having desired outcome on inflation, labour market; Treasury yields plunge; rate-cut expectations harden; energy prices main driver.

The annual rate of US inflation as measured by changes in the consumer price index (CPI) halved from nearly 3% in the period from July 2018 to February 2019. It then fluctuated in a range from 1.5% to 2.0% through 2019 before rising above 2.0% in the final months of that year. Substantially lower rates were reported from March 2020 to May 2020 and they remained below 2% until March 2021. Rates have since risen significantly, although they have been declining since mid-2022.

The latest US CPI figures released by the Bureau of Labor Statistics indicated seasonally-adjusted consumer prices remained flat on average in October. The result was below expectations of a 0.1% rise as well as September’s 0.4% increase. On a 12-month basis, the inflation rate slowed from 3.7% to 3.2%.

“Headline” inflation is known to be volatile and so references are often made to “core” inflation for analytical purposes. The core prices index, the index which excludes the more variable food and energy components, increased by 0.2% on a seasonally-adjusted basis over the month, less than the 0.3% which had been generally expected. The annual growth rate slowed from 4.1% to 4.0%.

“Increasingly it looks as if the level of monetary restraint is having the desired outcome on both inflation and the labour market,” said ANZ economist Madeline Dunk.

US Treasury bond yields plunged across the yield curve on the day. By the close of business, the 2-year Treasury yield had shed 20bps to 4.84%, the 10-year yield had lost 19bps to 4.45% while the 30-year yield finished 13bps lower at 4.63%.

In terms of US Fed policy, expectations of a lower federal funds rate in the next 12 months hardened.  At the close of business, contracts implied the effective federal funds rate would average 5.33% in December, in line with the current spot rate, 5.33% in January and 5.295% in March. November 2024 contracts implied 4.495%, 84bps less than the current rate.

“The detail within the CPI report probably does not justify the eagerness with which the market wants to bring forward US rate cuts and take bond yields lower,” said NAB Head of Research (Markets) Skye Masters.

The largest influence on headline results is often the change in fuel prices. Prices of “Energy commodities”, the segment which contains vehicle fuels, decreased by 4.9% and contributed -0.19 percentage points to the total. Prices of non-energy services, the segment which includes actual and implied rents, also had a significant effect on the total, adding 0.18 percentage points after increasing by 0.3% on average.

November rate rise hits consumer sentiment

14 November 2023

Summary: Westpac-Melbourne Institute consumer sentiment index down in November; rate rise puts “renewed pressure on family finances”; ACGB yields barely move; rate-rise expectations unchanged; tentative signs sentiment starting to lift “cut short”; three of five sub-indices lower; more respondents expecting higher jobless rate.

After a lengthy divergence between measures of consumer sentiment and business confidence in Australia which began in 2014, confidence readings of the two sectors converged again in mid-July 2018. Both measures then deteriorated gradually in trend terms, with consumer confidence leading the way. Household sentiment fell off a cliff in April 2020 but, after a few months of to-ing and fro-ing, it then staged a full recovery. However, consumer sentiment has deteriorated significantly over the past two years, while business sentiment has been more robust.

According to the latest Westpac-Melbourne Institute survey conducted in the second week of November, household sentiment has deteriorated and is at a quite pessimistic level.  Their Consumer Sentiment Index fell from October’s reading of 82.0 to 79.9, a reading which is still well below the “normal” range and significantly lower than the long-term average reading of just over 101.

“The RBA’s November rate hike has put renewed pressure on family finances and reignited concerns about both the rising cost of living and the prospect of further rate rises to come,” said Westpac senior economist Matthew Hassan.

Any reading of the Consumer Sentiment Index below 100 indicates the number of consumers who are pessimistic is greater than the number of consumers who are optimistic.

The report was released on the same day as the latest NAB Business Survey and Commonwealth Government bond yields barely moved on the day. By the close of business, 3-year and 10-year ACGB yields had both returned to their respective starting points at 4.30% and 4.68% while the 20-year yield finished 1bp lower at 4.97%.

In the cash futures market, expectations regarding further rate rises remained essentially unchanged. At the end of the day, contracts implied the cash rate would increase from the current rate of 4.32% and average 4.335% through December and 4.405% in February. May 2024 contracts implied a 4.49% average cash rate while August 2024 contracts implied 4.48%, 16bps more than the current rate.

“Previous months had been showing some tentative signs that sentiment might was starting to lift out of the deep pessimism that has prevailed since the middle of last year,” added Hassan. “That rally looks to have been cut short before it even really began.”

Three of the five sub-indices registered lower readings, with the “Family finances – next 12mths” sub-index posting the largest monthly percentage loss.

The Unemployment Expectations index, formerly a useful guide to RBA rate changes, rose from 127.3 to 130.4. Higher readings result from more respondents expecting a higher unemployment rate in the year ahead.

Business pessimism deepens, conditions still robust in October

14 November 2023

Summary: Business conditions improve in October; business pessimism deepens, well below average; broad theme of resilience in current indicators but weaker outlook in forward indicators continues; ACGB yields barely move; rate-rise expectations unchanged; Westpac: economy in midst of gradual slowdown; will likely broaden; capacity utilisation rate declines, still at elevated level.

NAB’s business survey indicated Australian business conditions were robust in the first half of 2018, with a cyclical-peak reached in April of that year. Readings from NAB’s index then began to slip and forecasts of a slowdown in the domestic economy began to emerge in the first half of 2019 as the index trended lower. It hit a nadir in April 2020 as pandemic restrictions were introduced but then improved markedly over the next twelve months and have subsequently remained at robust levels.

According to NAB’s latest monthly business survey of around 400 firms conducted in last week of October, business conditions improved modestly, maintaining a level which is above average. NAB’s conditions index registered 13 points, up 2 points from September’s revised reading.

However, business confidence deteriorated for a second consecutive month.  NAB’s confidence index declined from September’s revised reading of  zero to -2 points, well below the long-term average.  Typically, NAB’s confidence index leads the conditions index by one month, although some divergences have appeared from time to time.

“The broad theme of resilience in current indicators of activity but a weaker outlook in forward looking indicators continued in October, down slightly in September but remaining above average at +11 index points, where the index has hovered since May,” said NAB senior economist Brody Viney.

The report was released on the same day as the latest Westpac-Melbourne Institute consumer sentiment survey and Commonwealth Government bond yields barely moved on the day. By the close of business, 3-year and 10-year ACGB yields had both returned to their respective starting points at 4.30% and 4.68% while the 20-year yield finished 1bp lower at 4.97%.

In the cash futures market, expectations regarding further rate rises remained essentially unchanged. At the end of the day, contracts implied the cash rate would increase from the current rate of 4.32% and average 4.335% through December and 4.405% in February. May 2024 contracts implied a 4.49% average cash rate while August 2024 contracts implied 4.48%, 16bps more than the current rate.

Westpac economist Ryan Wells said the latest reading “and is consistent with official evidence that the Australian economy is in the midst of a gradual slowdown.”

“We continue to anticipate that this slowdown will broaden as the full impact of high inflation and the RBA’s rapid tightening cycle continues to materialise,” he added. “Output growth has already slowed from 2.7% in 2022 to a 1.5% annualised pace over the first half of 2023 and we expect a further slowing to around a 1.0% annualised pace for both the second half of 2023 and the first half of 2024.”

NAB’s measure of national capacity utilisation declined from September’s revised reading of 84.1% to 84.0%, a level which is still elevated from a historical perspective. All eight sectors of the economy were reported to be operating at or above their respective long-run averages.

Capacity utilisation is generally accepted as an indicator of future investment expenditure and it also has a strong inverse relationship with Australia’s unemployment rate.

U of M sentiment falls in November; poor, young, especially unhappy

10 November 2023

Summary: University of Michigan consumer confidence index falls in November, less than expected; views of present conditions, future conditions both deteriorate; largest falls from lower-income consumers, younger consumers; Treasury yields generally rise; 2024 rate-cut expectations soften modestly.

US consumer confidence started 2020 at an elevated level but, after a few months, surveys began to reflect a growing unease with the global spread of COVID-19 and its reach into the US. Household confidence plunged in April 2020 and then recovered in a haphazard fashion, generally fluctuating at below-average levels according to the University of Michigan. The University’s measure of confidence had recovered back to the long-term average by April 2021 but then it plunged again in the September quarter and remained at historically low levels through 2022 and 2023.

The latest survey conducted by the University indicates confidence among US households has deteriorated for a fourth consecutive month. The preliminary reading of the Index of Consumer Sentiment registered 60.4 in November, less than the 63.5 which had been generally expected and down from October’s final figure of 63.8.

Consumers’ views of current conditions and their views of future conditions both deteriorated relative to those held at the time of the October survey.

“Overall, lower-income consumers and younger consumers exhibited the strongest declines in sentiment. In contrast, sentiment of the top tercile of stock holders improved 10%, reflecting the recent strengthening in equity markets,” said the University’s Surveys of Consumers Director Joanne Hsu.

US Treasury bond yields generally rose on the day, although ultra-long yields declined a little. By the close of business, the 2-year Treasury yield had gained 5bps to 5.07%, the 10-year yield had added 2bps to 4.65% while the 30-year yield finished 1bp lower at 4.76%.

In terms of US Fed policy, expectations of a lower federal funds rate in 2024 softened modestly. At the close of business, contracts implied the effective federal funds rate would average 5.345% in December, 2bps more than the current spot rate, 5.355% in January and 5.375% in March. November 2024 contracts implied 4.775%, 56bps less than the current rate.

It was once thought less-confident households are generally inclined to spend less and save more; some decline in household spending could be expected to follow. However, recent research suggests the correlation between household confidence and retail spending is quite weak.

Jobless rise coming; October job ads index down 3%; October job ads index down 3%

06 November 2023

Summary: Job ads down 3.0% in October; 11.4% lower than October 2022; ANZ: down 3.5% over last 2 months; short-term ACGB yields slip, longer-term yields barely move; rate-rise expectations soften slightly; ANZ: slack slowly creeping into labour market, jobless rate will rise further; ad index-to-workforce ratio falls to 0.95.

From mid-2017 onwards, year-on-year growth rates in the total number of Australian job advertisements consistently exceeded 10%. That was until mid-2018 when the annual growth rate fell back markedly. 2019 was notable for its reduced employment advertising and this trend continued into the first quarter of 2020. Advertising plunged in April and May of 2020 as pandemic restrictions took effect but then recovered quite quickly, reaching historically-high levels in 2022.

According to the latest ANZ-Indeed figures, total advertisements lost 3.0% in October on a seasonally adjusted basis. The result followed a loss of 0.5% in September and a gain of 1.4% in August. On a 12-month basis, total job advertisements were 11.4% lower than in October 2022, down from September’s revised figure of -8.5%.

“ANZ-Indeed Australian Job Ads has declined 3.5% over the last two months, taking the series to its lowest level since January 2022,” said ANZ economist Madeline Dunk. “The number of job ads, however, is still elevated compared to historical levels.”

Short-term Commonwealth Government bond yields slipped a touch while longer-term yields barely moved on the day, ignoring overnight falls of US Treasury yields. By the close of business, the 3-year ACGB yield had ticked down 1bp to 4.209%, the 10-year yield had returned to its starting point at 4.74% while the 20-year yield finished 2bps higher at 5.06%.

In the cash futures market, expectations regarding further rate rises softened slightly. At the end of the day, contracts implied the cash rate would increase from the current rate of 4.07% and average 4.195% through November, 4.275% in December and 4.355% in February. May 2024 contracts implied a 4.45% average cash rate while August 2024 contracts implied 4.44%, 37bps more than the current rate.

“Slack is slowly creeping into the labour market. Hours worked have been falling, recent jobs growth has been driven by part-time employment, youth unemployment has been rising and the underemployment rate has been moving up,” Dunk  added. “This, along with the modest unwinding in job ads numbers, suggests the unemployment rate will rise further.”

The inverse relationship between job advertisements and the unemployment rate has been quite strong (see below chart), although ANZ themselves called the relationship between the two series into question in early 2019.  A higher job advertisement index as a proportion of the labour force is suggestive of lower unemployment rates in the near future while a lower ratio suggests higher unemployment rates will follow. October’s ad index-to-workforce ratio fell from 0.98 to 0.95 after revisions.

In 2008/2009, advertisements plummeted and Australia’s unemployment rate jumped from 4% to nearly 6% over a period of 15 months. When a more dramatic fall in advertisements took place in April 2020, the unemployment rate responded much more quickly.

Lower prices? Inflation Gauge down in October

06 November 2023

Summary: Melbourne Institute Inflation Gauge index down 0.1% in October; up 5.1% on annual basis; short-term ACGB yields slip, longer-term yields barely move; rate-rise expectations soften slightly.

The Melbourne Institute’s Inflation Gauge is an attempt to replicate the ABS consumer price index (CPI) on a monthly basis. It has turned out to be a reliable leading indicator of the CPI, although there are periods in which the Inflation Gauge and the CPI have diverged for as long as twelve months. On average, the Inflation Gauge’s annual rate tends to overestimate the ABS rate by around 0.1%, at least until recently.

The Melbourne Institute’s latest reading of its Inflation Gauge index indicates consumer prices declined by 0.1% in October, following increases of 0.0% and 0.2% in September and August respectively. The index rose by 5.1% on an annual basis, down from September’s comparable figure of 5.7%.

Short-term Commonwealth Government bond yields slipped a touch while longer-term yields barely moved on the day, ignoring overnight falls of US Treasury yields. By the close of business, the 3-year ACGB yield had ticked down 1bp to 4.209%, the 10-year yield had returned to its starting point at 4.74% while the 20-year yield finished 2bps higher at 5.06%.

In the cash futures market, expectations regarding further rate rises softened slightly. At the end of the day, contracts implied the cash rate would increase from the current rate of 4.07% and average 4.195% through November, 4.275% in December and 4.355% in February. May 2024 contracts implied a 4.45% average cash rate while August 2024 contracts implied 4.44%, 37bps more than the current rate.

Central bankers desire a certain level of inflation which is “sufficiently low that it does not materially distort economic decisions in the community” but high enough so it does not constrain “a central bank’s ability to combat recessions.”

Heat coming out of US labour market; Oct payrolls undershoots

03 November 2023

Summary: Non-farm payrolls up 150,000 in October, less than expected; previous two months’ figures revised down by 101,000; jobless rate ticks up to 3.9%, participation rate slips to 62.7%; Westpac: US labour market in robust structural health, although heat coming out; employed-to-population ratio falls to 60.2%; underutilisation rate up; annual hourly pay growth slows to 4.1%.

The US economy ceased producing jobs in net terms as infection controls began to be implemented in March 2020. The unemployment rate had been around 3.5% but that changed as job losses began to surge through March and April of 2020. The May 2020 non-farm employment report represented a turning point and subsequent months provided substantial employment gains which continued through into 2021 and 2022. Changes in recent months have been generally more in line with the average of the last decade.

According to the US Bureau of Labor Statistics, the US economy created an additional 150,000 jobs in the non-farm sector in October. The increase was less than 168,000 rise which had been generally expected and about half the 297,000 jobs which had been added in September after revisions. Employment figures for August and September were revised down by a total of 101,000.

The total number of unemployed increased by 146,000 to 6.506 million while the total number of people who were either employed or looking for work decreased by 202,000 to 167.728 million. These changes led to the US unemployment rate ticking up from September’s figure of 3.8% to 3.9% while the participation rate slipped from 62.8% to 62.7%.

“Overall, the US labour market is still in robust structural health, yet it is evident that the heat has come out and downside risks for employment and household incomes are forming,” said Westpac Head of International Economics Elliot Clarke.

US Treasury yields fell significantly on the day, especially at the short end. By the close of business, the 2-year yield had shed 15bps to 4.84%, the 10-year yield had lost 9bps to 4.57% while the 30-year yield finished 3bps higher at 4.77%.

In terms of US Fed policy, expectations of a lower federal funds rate in the second half of 2024 hardened materially. At the close of business, contracts implied the effective federal funds rate would average 5.34% in December, 3bps more than the current spot rate, 5.345% in January and 5.33% in March. November 2024 contracts implied 4.51%, 82bps less than the current rate.

One figure which is indicative of the “spare capacity” of the US employment market is the employment-to-population ratio. This ratio is simply the number of people in work divided by the total US population. It hit a cyclical-low of 58.2 in October 2010 before slowly recovering to just above 61% in late-2019. October’s reading declined from 60.4% to 60.2%, some way from the April 2000 peak reading of 64.7%.

Apart from the unemployment rate, another measure of tightness in the labour market is the underutilisation rate and the latest reading of it registered 7.2%, up from 7.0% in September. Wage inflation and the underutilisation rate usually have an inverse relationship and hourly pay growth in the year to October slowed from 4.3% to 4.1% after revisions.

Tensions evident in housing sector; home loan approvals up 0.6% in Sep

02 November 2023

Summary: Value of loan commitments up 0.6% in September, less than expected; 4.7% lower than September 2022; Westpac: point to clear tensions in the sector; ACGB yields drop; rate-rise expectations soften; ANZ: peak of competition for debt may have passed; value of owner-occupier loan approvals down 0.1%; investor approvals up 2.0%; number of owner-occupier home loan approvals flat.

The number and value of home-loan approvals began to noticeably increase after the RBA reduced its cash rate target in a series of cuts beginning in mid-2019, potentially ending the downtrend which had been in place since mid-2017. Figures from February through to May of 2020 provided an indication the downtrend was still intact but subsequent figures then pushed both back to record highs in 2021. However, there has been a considerable pullback since then, although the total value of new loans is still elevated by historical standards.

September’s housing finance figures have now been released and total loan approvals excluding refinancing increased by 0.6% In dollar terms over the month, less than the 1.3% rise which had been generally expected as well as August’s 2.4% gain. On a year-on-year basis, total approvals excluding refinancing fell by 4.7%, up from the previous month’s comparable figure of -9.3%.

“All up, this week’s batch of housing updates point to clear tensions in the sector; prices seeing a sustained rise but volumes and new building remain much patchier,” said Westpac senior economist Matthew Hassan.

Commonwealth Government bond yields dropped materially on the day, following similar overnight movements of US Treasury yields. By the close of business, the 3-year ACGB yield had shed 11bps to 4.33% while 10-year and 20-year yields both finished 16bps lower at 4.81% and 5.14% respectively.

In the cash futures market, expectations regarding further rate rises softened. At the end of the day, contracts implied the cash rate would increase from the current rate of 4.07% and average 4.195% through November, 4.285% in December and 4.365% in February. May 2024 contracts implied a 4.465% average cash rate while August 2024 contracts implied 4.47%, 40bps more than the current rate.

“Lack of supply is an important suppressor of sales volumes and credit growth, but it is also creating momentum in housing prices, which rose 0.9% in October and 0.7% in September,” said ANZ senior economist Adelaide Timbrell. “External refinancing for housing dipped to its lowest level since late 2022, suggesting the peak of competition for debt may have passed.”

The total value of owner-occupier loan commitments excluding refinancing slipped by 0.1%, in contrast with August’s 2.8% rise. On an annual basis, owner-occupier loan commitments were 8.4% lower than in September 2022, above August’s comparable figure of -12.5%.

The total value of investor commitments excluding refinancing increased by 2.0%. The rise followed a 1.7% gain in August, taking the growth rate over the previous 12 months from -2.9% to 2.6%.

The total number of loan commitments to owner-occupiers excluding refinancing were effectively flat at 25,359 on a seasonally adjusted basis. The result was lower than August’s 2.4% increase and the annual contraction rate slowed from 12.4% after revisions to 8.3%.

Click for more news