News

Fewer quits, separations, more openings in Sep JOLTS report

01 November 2023

Summary: US quit rate steady at 2.3% in September; US Treasury yields plunge; expectations of Fed rate cuts in 2024 harden; fewer quits, separations, more openings.

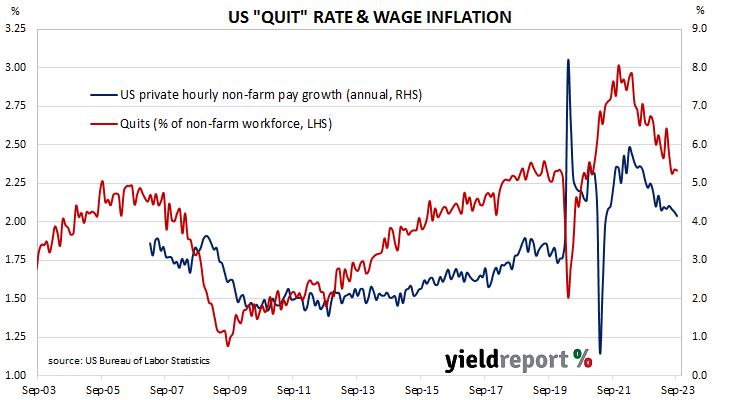
The number of US employees who quit their jobs as a percentage of total employment increased slowly but steadily after the GFC. It peaked in March 2019 and then tracked sideways until virus containment measures were introduced in March 2020. The quit rate then plummeted as alternative employment opportunities rapidly dried up. Following the easing of US pandemic restrictions, it proceeded to recover back to its pre-pandemic rate in the third quarter of 2020 and trended higher through 2021 before easing through 2022 and the first half of 2023.

Figures released as part of the latest Job Openings and Labor Turnover Survey (JOLTS) report show the quit rate remained steady in September. 2.3% of the non-farm workforce left their jobs voluntarily, unchanged from August. Quits in the month declined by 2,000 while an additional 336,000 people were employed in non-farm sectors.

“Overall, the labour market data continued to point to a healthy job market in the context of slower hiring,” said ANZ economist Kishti Sen.

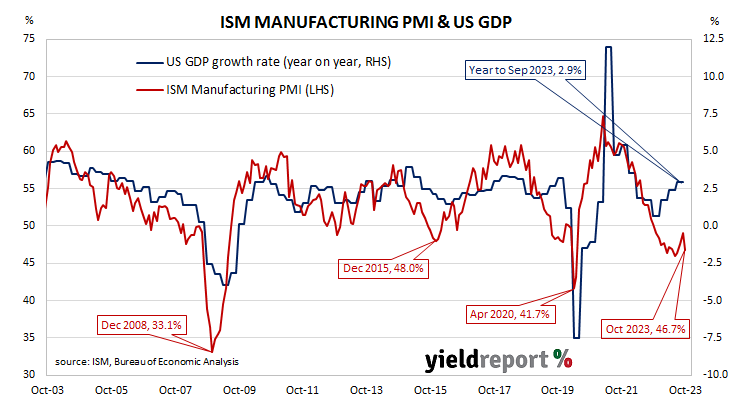
The report was released on the same day as the latest ISM PMI reading, ADP’s October report and the FOMC’s decision to hold its federal funds rate target range steady. US Treasury yields plunged on the day and, by the close of business, the 2-year Treasury bond yield had lost 14bps to 4.95%, the 10-year yield had shed 19bps to 4.74% while the 30-year yield finished 16bps lower at 4.93%.

In terms of US Fed policy, expectations of a lower federal funds rate in the second half of 2024 hardened. At the close of business, contracts implied the effective federal funds rate would average 5.355% in December, 3bps more than the current spot rate, 5.375% in January and 5.38% in March. November 2024 contracts implied 4.695%, 63bps less than the current rate.

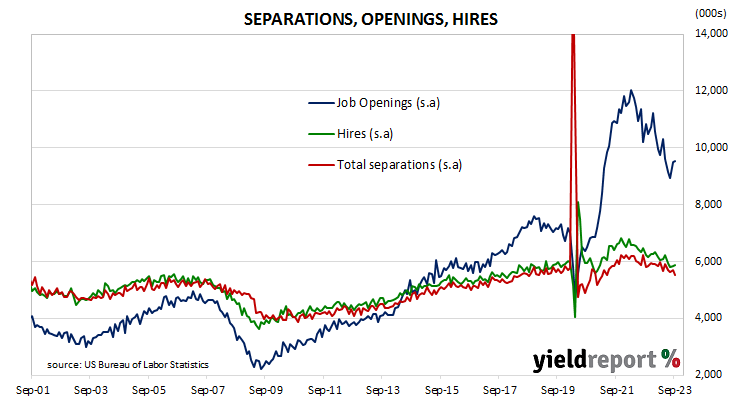
The fall in total quits was led by 26,000 fewer resignations in both the “Health care and social assistance” and “State and local government” sectors while the “Retail trade” sector experienced the largest gain, rising by 74,000. Overall, the total number of quits for the month slipped from August’s revised figure of 3.663 million to 3.661 million.     

Total vacancies at the end of September increased by 56,000, or 0.6%, from August’s revised figure of 9.497 million to 9.553 million. The rise was driven by a 141,000 gain in the “Accommodation and food services” sector while the “Other services” sector experienced the single largest decline, falling by 124,000. Overall, 12 out of 18 sectors experienced more job openings than in the previous month.  

Total separations decreased by 157,000, or 2.8%, from August’s revised figure of 5.687 million to 5.530 million. The fall was led by the “Professional and business services” sector where there were 75,000 fewer separations than in August. Separations decreased in 9 of the 18 sectors.

The “quit” rate time series produced by the JOLTS report is a leading indicator of US hourly pay. As wages account for around 55% of a product’s or service’s price in the US, wage inflation and overall inflation rates tend to be closely related. Former Federal Reserve chief and current Treasury Secretary Janet Yellen was known to pay close attention to it.

ISM October PMI dents expectations US manufacturing weakness over

01 November 2023

Summary: ISM PMI down in October, below expectations; ANZ: dents expectations US manufacturing may be bottoming out; US Treasury yields plunge; expectations of Fed rate cuts in 2024 harden; ISM: reading corresponds to 0.7% US GDP contraction annualised.

The Institute of Supply Management (ISM) manufacturing Purchasing Managers Index (PMI) reached a cyclical peak in September 2017. It then started a downtrend which ended in March 2020 with a contraction in US manufacturing which lasted until June 2020. Subsequent month’s readings implied growth had resumed, with the index becoming stronger through to March 2021. Readings have since declined fairly steadily.

According to the ISM’s October survey, its PMI recorded a reading of 46.7%, below the generally expected figure of 49.0% as well as September’s 49.0%. The average reading since 1948 is roughly 53.0% and any reading below 50% implies a contraction in the US manufacturing sector relative to the previous month.

“The October ISM manufacturing index fell to 46.7, its lowest reading since July and denting expectations that activity in the sector may be bottoming out,” said ANZ economist Kishti Sen.

The report was released on the same day as the latest JOLTS data, ADP’s October report and the FOMC’s decision to hold its federal funds rate target range steady. US Treasury yields plunged on the day and, by the close of business, the 2-year Treasury bond yield had lost 14bps to 4.95%, the 10-year yield had shed 19bps to 4.74% while the 30-year yield finished 16bps lower at 4.93%.

In terms of US Fed policy, expectations of a lower federal funds rate in the second half of 2024 hardened. At the close of business, contracts implied the effective federal funds rate would average 5.355% in December, 3bps more than the current spot rate, 5.375% in January and 5.38% in March. November 2024 contracts implied 4.695%, 63bps less than the current rate.

Purchasing managers’ indices (PMIs) are economic indicators derived from monthly surveys of executives in private-sector companies. They are diffusion indices, which means a reading of 50% represents no change from the previous period, while a reading under 50% implies respondents reported a deterioration on average. A reading “above 48.7%, over a period of time, generally indicates an expansion of the overall economy”, according to the ISM.    

The ISM’s manufacturing PMI figures appear to lead US GDP by several months despite a considerable error in any given month. The chart below shows US GDP on a “year on year” basis (and not the BEA annualised basis) against US GDP implied by monthly PMI figures. 

According to the ISM and its analysis of past relationships between the PMI and US GDP, October’s PMI corresponds to an annualised contraction rate of -0.7%, or about -0.2% over a quarter. However, regression analysis on a year-on-year basis still suggests a 12-month GDP growth rate of 1.6% five months after this latest report.

The ISM index is one of two monthly US PMIs, the other being an index published by S&P Global. S&P Global produces a “flash” estimate in the last week of each month which comes out about a week before the ISM index is published. The S&P Global flash October manufacturing PMI registered 50.0%, 0.2 percentage points higher than September’s final figure.

“Soft”, at “low levels”; home approvals down 4.6% in September

01 November 2023

Home approval numbers down 4.6% in September, contrasts with expected gain; 22.3% lower than September 2022; Westpac: moderately soft set of results, at low levels by historical standards; ACGB yields up modestly; rate-rise expectations firm a touch; house approvals down 4.0%, apartments down 5.8%; non-residential approvals down 7.2% in dollar terms, residential alterations up 0.7%.

Building approvals for dwellings, that is apartments and houses, headed south after mid-2018. As an indicator of investor confidence, falling approvals had presented a worrying signal, not just for the building sector but for the overall economy. However, approval figures from late-2019 and the early months of 2020 painted a picture of a recovery taking place, even as late as April of that year. Subsequent months’ figures then trended sharply upwards before falling back through 2021, 2022 and the first half of 2023.

The Australian Bureau of Statistics has released the latest figures from September which show total residential approvals fell by 4.6% on a seasonally-adjusted basis. The result contrasted with the 2.5% gain which had been generally expected as well as August’s 8.1% gain after revisions. Total approvals fell by 22.3% on an annual basis, down from the previous month’s revised figure of -20.6%. Monthly growth rates are often volatile.

“Overall, the September update showcased a moderately soft set of results, at a time where signs of an underlying stabilisation in dwelling approvals have begun to emerge, albeit at low levels by historical standards,” said Westpac economist Ryan Wells. “That said, the outlook for dwelling approvals remains mixed; just as wider housing markets are benefitting from rapid population growth, legacy issues around elevated construction costs and capacity constraints remain a drag on building activity.”

Commonwealth Government bond yields rose modestly on the day, lagging overnight movements of US Treasury yields. By the close of business, the 3-year ACGB yield had crept up 1bp to 4.44%, the 10-year had gained 2bps to 4.97% while the 20-year yield finished 1bp higher at 5.30%.

In the cash futures market, expectations regarding further rate rises firmed a touch. At the end of the day, contracts implied the cash rate would increase from the current rate of 4.07% to average 4.20% through November, 4.285% in December and 4.375 in February. May 2024 contracts implied a 4.505% average cash rate while August 2024 contracts implied 4.515%, 45bps more than the current rate.

Approvals for new houses fell by 4.0% over the month, in contrast with August’s 7.5% gain after revisions. On a 12-month basis, house approvals were 11.4% lower than they were in September 2022, up from August’s comparable figure of -13.5%.                                              

Apartment approval figures are usually a lot more volatile and September’s total fell by 5.8% after a 9.2% gain in August. The 12-month growth rate rose from August’s revised rate of -34.3% to -33.4%.

Non-residential approvals decreased by 7.2% in dollar terms over the month but were 2.1% higher on an annual basis. Figures in this segment also tend to be rather volatile.

Residential alteration approvals increased by 0.7% in dollar terms over the month and were 2.6% higher than in September 2022.

Groceries, fuel prices drag on US consumer confidence; Conf. Board index slides again in October

31 October 2023

Summary: Conference Board Consumer Confidence Index falls in October, reading more than expected; decline across all income groups, evident among respondents aged 35+; Treasury yields rise moderately; Fed rate-cut expectations for 2024 soften; views of present conditions, short-term outlook deteriorate.

US consumer confidence clawed its way back to neutral over the five years after the GFC in 2008/2009 and then went from strength to strength until late 2018. Measures of consumer confidence then oscillated within a relatively narrow band at historically high levels until they plunged in early 2020. Subsequent readings then fluctuated around the long-term average until March 2021 when they returned to elevated levels. However, a noticeable gap has since emerged between the two most-widely followed surveys.

The latest Conference Board survey held during the first three weeks of October indicated US consumer confidence has deteriorated for a third consecutive month. October’s Consumer Confidence Index registered 102.6 on a preliminary basis, above the generally-expected figure of 100.0 but below September’s final figure of 104.3.

“Write-in responses showed that consumers continued to be preoccupied with rising prices in general, and for grocery and gasoline prices in particular,” said Dana Peterson, Chief Economist at The Conference Board. “The decline in consumer confidence was evident across householders aged 35 and up, and not limited to any one income group.”

US Treasury yields finished the day moderately higher. By the close of business, the 2-year, 10-year and 30-year Treasury bond yields had each added 4bps to 5.09%, 4.93% and 5.09% respectively.

In terms of US Fed policy, expectations of a lower federal funds rate in the next 12 months generally softened. At the close of business, contracts implied the effective federal funds rate would average 5.33% in November, in line with the current spot rate, 5.365% in December and 5.395% in January. September 2024 contracts implied 5.005%, 32bps less than the current rate.

Consumers’ views of present conditions and the near-future both deteriorated. The Present Situation Index decreased from September’s revised figure of 146.2 to 143.1 while the Expectations Index slipped from 76.4 to 75.6.

The Consumer Confidence Survey is one of two widely followed monthly US consumer sentiment surveys which produce sentiment indices. The Conference Board’s index is based on perceptions of current business and employment conditions, as well as respondents’ expectations of conditions six months in the future. The other survey, conducted by the University of Michigan, is similar and it is used to produce an Index of Consumer Sentiment. That survey differs in that it does not ask respondents explicitly about their views of the labour market and it also includes some longer-term questions.

Private credit growth continues slowdown; up 0.5% in September

31 October 2023

Summary: Private sector credit up 0.5% in September, above expectations; annual growth rate slows to 4.9%; ACGB yields up moderately; rate-rise expectations over next 3 months ease slightly; business lending segment accounts for around 50% of net growth.

The pace of lending growth in the non-bank private sector by financial institutions in Australia followed a steady-but-gradual downtrend from late 2015 through to early 2020 before hitting what appears to be a nadir in March 2021. That downtrend ended later in that same year and annual growth rates shot up through 2022, peaking in September/October before easing in 2023.

According to the latest RBA figures, private sector credit increased by 0.5% in September. The result was greater than the 0.3% rise which had been generally expected as well as August’s 0.4% increase. On an annual basis, the growth rate slowed from August’s revised figure of 5.2% to 4.9%.

Commonwealth Government bond yields rose moderately across the curve, broadly in line with overnight movements of US Treasury yields. By the close of business, the 3-year ACGB yield had gained 4bps to 4.43% while  10-year and 20-year yields both finished 6bps higher at 4.95% and 5.29% respectively.

In the cash futures market, expectations regarding further rate rises over the next three months eased slightly. At the end of the day, contracts implied the cash rate would increase from the current rate of 4.07% to average 4.195% through November, 4.275% in December and 4.37% in February. May 2024 contracts implied a 4.505% average cash rate while August 2024 contracts implied 4.515%, 45bps more than the current rate.

Business lending accounted for just under half of the net growth over the month, while lending in the owner-occupier segment accounted for around 40%. Investor lending and personal lending both increased in net terms and accounted for the balance.

The traditional driver of overall loan growth, the owner-occupier segment, grew by 0.4% over the month, up from the 0.3% growth rates registered in the previous two months. The sector’s 12-month growth rate slowed again, this time from 5.0% to 4.9%.

Total lending in the non-financial business sector increased by 0.8%, up from 0.7% in the previous month after revisions. Growth on an annual basis slowed from 7.4% to 6.8%.

Monthly growth in the investor-lending segment slowed to a near-halt in early 2018 and essentially stayed that way until mid-2021. In September, net lending rose by 0.2%, down from 0.3% in August and July, maintaining the 12-month growth rate at 2.9%.

Total personal loans rose by 0.6%, down from 0.8% in August, taking the annual growth rate from 1.6% to 2.3%. This category of debt includes fixed-term loans for large personal expenditures, credit cards and other revolving credit facilities.

Euro-zone ESI slips in October

30 October 2023

Summary: Euro-zone composite sentiment indicator down a little in October, slightly above expected figure; readings down in three of five sectors; down in two of four largest euro-zone economies; German, French 10-year yields either modestly higher or flat; index implies annual GDP growth rate of -0.2%.

The European Commission’s Economic Sentiment Indicator (ESI) is a composite index comprising five differently weighted sectoral confidence indicators.  It is heavily weighted towards confidence surveys from the business sector, with the consumer confidence sub-index only accounting for 20% of the ESI. However, it has a good relationship with euro-zone GDP growth rates, although not necessarily as a leading indicator.

The ESI posted a reading of 93.3 in October, slightly above the generally-expected figure of 93.0 but down a little from September’s revised reading of 93.4. The average reading since 1985 is just under 100.

German and French 10-year bond yields finished the day either a little higher or flat. By the close of business, the German 10-year bund yield had added 2bps to 2.83% while the French 10-year OAT yield finished unchanged at 3.44%.

Confidence deteriorated in three of the five sectors of the economy. On a geographical basis, the ESI decreased in two of the euro-zone’s four largest economies, France and Italy, but improved in Germany and Spain.

End-of-quarter ESI readings and annual euro-zone GDP growth rates are highly correlated. This latest reading corresponds to a year-to-October GDP growth rate of -0.2%, unchanged from September’s implied growth rate.

Economists not sold on 0.9% rise for September retail sales

30 October 2023

Summary: Retail sales up 0.9% in September, considerably greater than expected; up 2.0% on 12-month basis; Westpac: represents sizeable decline accounting for impact of inflation, population growth; ACGB yields rise; rate-rise expectations firm; ANZ: underlying weakness in retail sector right now; largest influence on result from food sales.

Growth figures of domestic retail sales spent most of the 2010s at levels below the post-1992 average. While economic conditions had been generally favourable, wage growth and inflation rates were low. Expenditures on goods then jumped in the early stages of 2020 as government restrictions severely altered households’ spending habits. Households mostly reverted to their usual patterns as restrictions eased in the latter part of 2020 and throughout 2021.

According to the latest ABS figures, total retail sales increased by 0.9% on a seasonally adjusted basis in September. The rise was considerably greater than the 0.3% increase which had been generally expected as well as August’s 0.3% gain. Sales increased by 2.0% on an annual basis, up from August’s revised figure of 1.6%.

“Annual growth in nominal sales growth lifted slightly, from 1.6% to 2.0% in September,” said Westpac economist Ryan Wells. “However, this still represents a sizeable decline once the impact of inflation and population growth are accounted for.”

Long-term Commonwealth Government bond yields moved higher on the day. By the close of business, the 3-year ACGB yield had added 5bps to 4.39%, the 10-year yield had gained 6bps to 4.89% while the 20-year yield finished 7bps higher at 5.23%.

In the cash futures market, expectations regarding further rate rises firmed. At the end of the day, contracts implied the cash rate would increase from the current rate of 4.07% to average 4.20% through November, 4.285% in December and 4.37% in February. May 2024 contracts implied a 4.495% average cash rate as did August 2024 contracts, 43bps more than the current rate.

“The bumper September result takes the level of nominal retail sales just above where the series printed back in November 2022,” said ANZ economist Madeline Dunk. “The fact that it has taken ten months to get back to this level highlights the underlying weakness in the retail sector right now, particularly given the rapid pace of population growth.

Retail sales are typically segmented into six categories (see below), with the “Food” segment accounting for 40% of total sales. The largest influences on the month’s total came from this segment where sales rose by 1.0% over the month.

Core PCE inflation slows in September; ahead of FOMC projections

27 October 2023

Summary: US core PCE price index up 0.3% in September, as expected; annual rate slows 3.8% to 3.7%; ANZ: improvement slightly ahead of FOMC projections; Treasury yields generally fall; Fed rate-cut expectations for 2024 firm a little.

One of the US Fed’s favoured measures of inflation is the change in the core personal consumption expenditures (PCE) price index. After hitting the Fed’s target at the time of 2.0% in mid-2018, the annual rate then hovered in a range between 1.8% and 2.0% before it eased back to a range between 1.5% and 1.8% through 2019. It then plummeted below 1.0% in April 2020 before rising back to around 1.5% in the September quarter of that year. It has since increased significantly and still remains above the Fed’s target even after recent declines.

The latest figures have now been published by the Bureau of Economic Analysis as part of the September personal income and expenditures report. Core PCE prices rose by 0.3% over the month, in line with expectations but more than August’s 0.1% increase. On a 12-month basis, the core PCE inflation rate slowed from August’s revised rate of 3.8% to 3.7%.

“Core inflation actually came in at 3.7% in September, so the improvement in annual inflation is coming slightly ahead of the FOMC’s projections,” said ANZ economist Kishti Sen. “The FOMC will be comfortable with its inflation forecasts for now.”

US Treasury bond yields generally fell on the day. By the close of business, the 2-year Treasury bond yield had lost 3bps to 5.01%, the 10-year yield had slipped 1bp to 4.84% while the 30-year yield finished 3bps higher at 5.02%.

In terms of US Fed policy, expectations of a lower federal funds rate in the next 12 months firmed a little. At the close of business, contracts implied the effective federal funds rate would average 5.33% in November, in line with the current spot rate, 5.355% in December and 5.375% in January. September 2024 contracts implied 4.92%, 41bps less than the current rate.

The core version of PCE strips out energy and food components, which are volatile from month to month, in an attempt to identify the prevailing trend. It is not the only measure of inflation used by the Fed; the Fed also tracks the Consumer Price Index (CPI) and the Producer Price Index (PPI) from the Department of Labor. However, it is the one measure which is most often referred to in FOMC minutes.

Consumers, inventories boost US Sep quarter GDP; details softer

26 October 2023

Summary: US GDP up 1.2% (4.9% annualised) in September quarter, above expectations; NAB: underpinned by strong consumer spending, inventory growth; US Treasury yields fall noticeably; rate-cut expectations firm; GDP price deflator rate slows from 3.5% to 3.2%.

US GDP growth slowed in the second quarter of 2019 before stabilising at about 0.5% per quarter.  At the same time, US bond yields suggested future growth rates would be below trend. The US Fed agreed and it reduced its federal funds range three times in the second half of 2019. Pandemic restrictions in the June quarter of 2020 sent parts of the US economy into hibernation; the lifting of those same restrictions sparked a rapid recovery which lasted until 2022.

The US Bureau of Economic Analysis has now released the September quarter’s advance GDP estimates and they indicate the US economy expanded by 1.2% or at an annualised rate of 4.9%. The result was more than the 1.1% increase (4.3% annualised) which had been generally expected as well as the June quarter’s 0.5% rise after revisions.

“Growth was underpinned by strong consumer spending which rose 4.0% and added 2.7 percentage points to the GDP figure, while inventories also added 1.3 percentage points,” said NAB Head of Market Economics Tapas Strickland. “That breakdown suggests growth in Q4 should be slower with many analysts citing the details were softer than the headline.”

US GDP numbers are published in a manner which is different to most other countries; quarterly figures are compounded to give an annualised figure. In countries such as Australia and the UK, an annual figure is calculated by taking the latest number and comparing it with the figure from the same period in the previous year. The diagram above shows US GDP once it has been expressed in the normal manner, as well as the annualised figure.

US Treasury bond yields fell noticeably on the day. By the close of business, the 2-year Treasury bond yield had lost 8bps to 5.04%, the 10-year yield had shed 11bps to 4.85% while the 30-year yield finished 10bps lower at 4.99%.

In terms of US Fed policy, expectations of a lower federal funds rate in the next 12 months firmed. At the close of business, contracts implied the effective federal funds rate would average 5.33% in November, in line with the current spot rate, 5.36% in December and 5.38% in January. September 2024 contracts implied 4.94%, 39bps less than the current rate.

One part of the report which is often overlooked are the figures regarding the GDP price deflator, which is another measure of inflation. The GDP price deflator is restricted to new, domestically-produced goods and services and it is not based on a fixed basket as is the case for the consumer price index (CPI). The annual rate slowed from the June quarter’s revised figure of 3.5% to 3.2%.

ifo index up in October; “silver lining ahead” for German economy

25 October 2023

ifo business climate index rises in October, above expected figure; managers less pessimistic in view of coming months; current conditions index up, expectations index up; German, French 10-year yields higher; NAB: slightly more optimistic picture than advance PMIs; expectations index implies euro-zone GDP contraction of 2.1% in year to January.

Following recessions in euro-zone economies in 2009/2010, the ifo Institute’s Business Climate Index largely ignored the European debt-crisis of 2010-2012, mostly posting average-to-elevated readings through to early-2020. However, the index was quick to react in the March 2020 survey, falling precipitously before recovering quickly in subsequent months. Readings through much of 2021 generally fluctuated around the long-term average before dropping away in 2022.

According to the latest report released by ifo, German business sentiment has improved after five consecutive months of decline. October’s Business Climate Index recorded a reading of 86.9, above the generally expected figure of 86.0 as well as  September’s final reading of 85.8. The average reading since January 2005 is 96.5.

“Companies are somewhat more satisfied with their current business,” said Clemens Fuest, President of the ifo Institute. “In addition, managers were less pessimistic in their view of the coming months. Germany’s economy can see a silver lining ahead.”

German firms’ views of current conditions and their collective outlook both improved. The current situation index increased from September’s figure of 88.7 to 89.2 while the expectations index crept up from 83.1 after revisions to 84.7.

German and French long-term bond yields finished higher on the day. By the close of business, the German 10-year yield had gained 8bps to 2.90% while the French 10-year OAT yield finished 4bps higher at 3.53%.

“This paints a slightly more optimistic picture than the advance PMIs, released earlier in the week, where the composite index fell further into contractionary territory,” said NAB senior FX strategist Rodrigo Catril.

The ifo Institute’s business climate index is a composite index which combines German companies’ views of current conditions with their outlook for the next six months. It has similarities to consumer sentiment indices in the US such as the ones produced by The Conference Board and the University of Michigan.

It also displays a solid correlation with euro-zone GDP growth rates. However, the expectations index is a better predictor as it has a higher correlation when lagged by one quarter. October’s expectations index implies a 2.1% year-on-year GDP contraction to the end of January.  

Click for more news