News

Consumer pessimism continues in euro-zone; sentiment index declines

23 October 2023

Summary: Euro-zone household sentiment slightly more pessimistic in October; consumer confidence index noticeably below long-term average, lower bound of “normal” readings; euro-zone yields fall.

EU consumer confidence plunged during the GFC and again in 2011/12 during the European debt crisis. After bouncing back through 2013 and 2014, it fell back significantly in late 2018 but only to a level which corresponds to significant optimism among households. Following the plunge which took place in April 2020, a recovery began a month later, with household confidence returning to above-average levels from March 2021. However, readings subsequent to early 2022 were extremely low by historical standards until recently.

Consumer confidence deteriorated for a third consecutive month in September according to the latest survey conducted by the European Commission. Its Consumer Confidence Indicator recorded a reading of -17.9, slightly above the generally expected figure of -18.2 but a touch below September’s reading of -17.8. This latest reading is  noticeably below the long-term average of -10.4 and below the lower end of the range in which “normal” readings usually occur.

Sovereign bond yields in major euro-zone bond markets fell on the day. By the close of business, the German 10-year bund yield had lost 3bps to 2.86% while the French 10-year OAT yield finished 5bps lower at 3.48%.

Conference Board expects US “shallow recession” in 2024

19 October 2023

Summary: Conference Board leading index down 0.7% in September, lower than expected; nine of index’s ten components negative; short-term US Treasury yields fall, long-term yields rise; rate-cut expectations firm; recession signal not sounded, shallow recession likely in first half of 2024; regression analysis implies 1.6% contraction in year to December.

The Conference Board Leading Economic Index (LEI) is a composite index composed of ten sub-indices which are thought to be sensitive to changes in the US economy. The Conference Board describes it as an index which attempts to signal growth peaks and troughs; turning points in the index have historically occurred prior to changes in aggregate economic activity. Readings from March and April of 2020 signalled “a deep US recession” while subsequent readings indicated the US economy would recover rapidly. More recent readings have implied US GDP growth rates will turn negative sometime in the second half of 2023 or the first half of 2024.

The latest reading of the LEI indicates it decreased by 0.7% in September. The fall was a larger one than the 0.4% decrease which had been generally expected as well as August’s revised figure of -0.5%.

“In September, negative or flat contributions from nine of the index’s ten components more than offset fewer initial claims for unemployment insurance,” said Justyna Zabinska-La Monica of The Conference Board.

Short-term US Treasury bond yields fell on the day while longer-term yields rose. By the close of business, the 2-year Treasury yield had lost 6bps to 5.16%, the 10-year yield had gained 8bps to 4.99% while the 30-year yield finished 11bps higher at 5.11%.

In terms of US Fed policy, expectations of a lower federal funds rate in the next 12 months firmed. At the close of business, contracts implied the effective federal funds rate would average 5.335% in November, 1bp more than the current spot rate, 5.375% in December and 5.405% in January. September 2024 contracts implied 5.03%, 30bps less than the current rate.

“Although the six-month growth rate in the LEI is somewhat less negative, and the recession signal did not sound, it still signals risk of economic weakness ahead,” added Zabinska-La Monica. While noting the “considerable resilience” of the US economy in the face of high inflation and high interest rates, she said “this trend will not be sustained for much longer and a shallow recession is likely in the first half of 2024.”

The Conference Board currently forecasts a “shallow” recession in the first half of 2024. Regression analysis suggests the latest reading implies a -1.6% year-on-year growth rate in December, down from the -1.5% implied by the previous month’s LEI.

Sub-trend growth into 2024; Westpac-MI leading index creeps up in September

18 October 2023

Summary: Leading index growth rate rises in September; sub-trend growth momentum into 2024; reading implies annual GDP growth of around 2.25%; ACGB yields rise materially; rate-rise expectations firm; Westpac: expects 1.2% GDP growth in calendar 2023, 1.1% annualised in first half of 2024.

Westpac and the Melbourne Institute describe their Leading Index as a composite measure which attempts to estimate the likely pace of Australian economic growth in the short-term. After reaching a peak in early 2018, the index trended lower through 2018 and 2019 before plunging to recessionary levels in the second quarter of 2020. Subsequent readings spiked towards the end of 2020 but then trended lower through 2021, 2022 and the first half of 2023.

The September reading of the six month annualised growth rate of the indicator registered -0.34%, up from August’s revised figure of -0.48%.

“September marks the fourteenth consecutive subzero read on the headline Index growth rate, implying that lacklustre sub-trend growth momentum will carry well into 2024,” said Westpac senior economist Matthew Hassan.

Index figures represent rates relative to “trend” GDP growth, which is generally thought to be around 2.75% per annum in Australia. The index is said to lead GDP by “three to nine months into the future” but the highest correlation between the index and actual GDP figures occurs with a three-month lead. The current reading is thus indicative of an annual GDP growth rate of around 2.25% in the next quarter.

Domestic Treasury bond yields rose materially on the day following sharp increases of US Treasury bonds yields overnight. By the close of business, the 3-year ACGB yield had added 9bps to 4.19%, the 10-year yield had gained 11bps to 4.67% while the 20-year yield finished 12bps higher at 5.00%.

In the cash futures market, expectations regarding further rate rises firmed. At the end of the day, contracts implied the cash rate would increase from the current rate of 4.07% and average 4.145% through November, 4.205% in December and 4.275% in February. May 2024 contracts implied a 4.35% average cash rate while August 2024 contracts implied 4.355%, 29bps more than the current rate.

Hassan said Westpac expects GDP growth of just 1.2% in 2023 and an annualised growth rate of 1.1% over the first half of 2024. “This is well below population growth which will be running at around 2.3%.”

US retail sales exceeds forecasts in Sep; activity “remains strong”

17 October 2023

Summary: US retail sales up 0.6% in September, considerably more than expected; annual growth rate accelerates to 3.9%; NAB: activity in the US remains strong; US Treasury yields jump; rate-cut expectations soften considerably; ANZ: strong momentum in consumption heading into Q4; higher sales in eight of thirteen categories; non-store retailer sales largest single influence on month’s result.

US retail sales had been trending up since late 2015 but, commencing in late 2018, a series of weak or negative monthly results led to a drop-off in the annual growth rate below 2.0%. Growth rates then increased in trend terms through 2019 and into early 2020 until pandemic restrictions sent it into negative territory. A “v-shaped” recovery then took place which was followed by some short-term spikes as federal stimulus payments hit US households in the first and second quarters of 2021.

According to the latest “advance” numbers released by the US Census Bureau, total retail sales increased by 0.7% in September. The result was considerably greater than the 0.3% increase which had been generally expected but it was slightly less than August’s 0.8% rise after it was revised up from 0.6%. On an annual basis, the growth rate accelerated from August’s revised rate of 2.9% to 3.8%.

“Headline retail sales were 0.7% versus 0.3% expected and the core control measure which feeds into GDP was 0.6% versus. 0.1% expected,” said NAB Head of Market Economics Tapas Strickland. “It is clear activity in the US remains strong.”

The figures were released at the same time as the latest US industrial production report and US Treasury yields increased significantly on the day. By the close of business, the 2-year Treasury yield had gained 11bps to 5.21%, the 10-year yield had jumped 14bps to 4.84% while the 30-year yield finished 8bps higher at 4.93%.

In terms of US Fed policy, expectations of a lower federal funds rate in the next 12 months softened considerably. At the close of business, contracts implied the effective federal funds rate would average 5.355% in November, 3bps more than the current spot rate, 5.41% in December and 5.445% in January. September 2024 contracts implied 5.085%, 24bps less than the current rate.  

“The data indicate strong momentum in consumption heading into Q4, but the data are nominal, not real, so the volume performance will not be as strong,” said ANZ senior economist ANZ Adelaide Timbrell.

Eight of the thirteen categories recorded higher sales over the month. The “Non-store retailers” segment provided the largest single influence on the overall result, rising by 1.1% over the month and contributing 0.18 percentage points to the total.  

The non-store segment includes vending machine sales, door-to-door sales and mail-order sales but nowadays this segment has become dominated by online sales. It now accounts for nearly 17% of all US retail sales and it is the second-largest segment after vehicles and parts.

US ind. output up 0.3% in September; more downward revisions

17 October 2023

US industrial output up 0.3% in September, above expectations; up 0.1% over past 12 months; US Treasury yields jump; rate-cut expectations soften considerably; capacity utilisation rate up 0.2ppts to 79.7%, slightly below long-term average.

The Federal Reserve’s industrial production (IP) index measures real output from manufacturing, mining, electricity and gas company facilities located in the United States. These sectors are thought to be sensitive to consumer demand and so some leading indicators of GDP use industrial production figures as a component. US production collapsed through March and April of 2020 before recovering the ground lost over the fifteen months to July 2021.

According to the Federal Reserve, US industrial production increased by 0.3% on a seasonally adjusted basis in September. The result contrasted with the 0.1% contraction which had been generally expected and it was greater than August’s unchanged reading after it was revised down from 0.4%. On an annual basis the expansion rate remained steady at August’s revised figure of 0.1%.

The figures were released at the same time as the latest US retail sales report and US Treasury yields increased significantly on the day. By the close of business, the 2-year Treasury yield had gained 11bps to 5.21%, the 10-year yield had jumped 14bps to 4.84% while the 30-year yield finished 8bps higher at 4.93%.

In terms of US Fed policy, expectations of a lower federal funds rate in the next 12 months softened considerably. At the close of business, contracts implied the effective federal funds rate would average 5.355% in November, 3bps more than the current spot rate, 5.41% in December and 5.445% in January. September 2024 contracts implied 5.085%, 24bps less than the current rate.  

The same report includes US capacity utilisation figures which are generally accepted as an indicator of future investment expenditure and/or inflationary pressures. Capacity usage had hit a high for the last business cycle in early 2019 before it began a downtrend which ended with April 2020’s multi-decade low of 64.2%. September’s reading increased from August’s downwardly-revised figure of 79.5% to 79.7%, slightly below the long-term average of 80.1%.

While the US utilisation rate’s correlation with the US jobless rate is solid, it is not as high as the comparable correlation in Australia.

Euro-zone production still down 5.1% over year after August gain

13 October 2023

Summary: Euro-zone industrial production up 0.6% in August, more than expected; down 5.1% on annual basis; German, French 10-year yields fall; output expands in two of four largest euro economies.

Following a recession in 2009/2010 and the debt-crisis which flowed from it, euro-zone industrial production recovered and then reached a peak four years later in 2016. Growth rates then fluctuated for two years before beginning a steady and persistent slowdown from the start of 2018. That decline was transformed into a plunge in March and April of 2020 which then took over a year to claw back. Production levels in recent quarters have generally stagnated in trend terms.

According to the latest figures released by Eurostat, euro-zone industrial production expanded by 0.6% in August on a seasonally-adjusted and calendar-adjusted basis. The result was more than the 0.2% expansion which had been generally expected and in contrast to July’s 1.3% contraction. However, the calendar-adjusted contraction rate on an annual basis accelerated, from July’s revised rate of -2.2% to -5.1%.

German and French sovereign bond yields fell on the day. By the close of business, the German 10-year bond yield had shed 6bps to 2.73% while the French 10-year bond yield finished 4bp lower at 3.36%.

Industrial production expanded in two of the euro-zone’s four largest economies. Germany’s production crept up 0.1% over the month while the comparable figures for France, Spain and Italy were -0.2%, -0.7% and 0.2% respectively.

“Surprisingly strong” core measures leads to bond sell-off; US September CPI up 0.4%

12 October 2023

Summary: US CPI up 0.4% in September, slightly above expectations; “core” rate up 0.3%; NAB: other core measures surprisingly strong; Treasury yields rise materially; rate-cut expectations soften; non-energy services main driver, adds 0.35ppts; New York Fed Underlying Inflation Gauge slows from 3.0% to 2.9%.

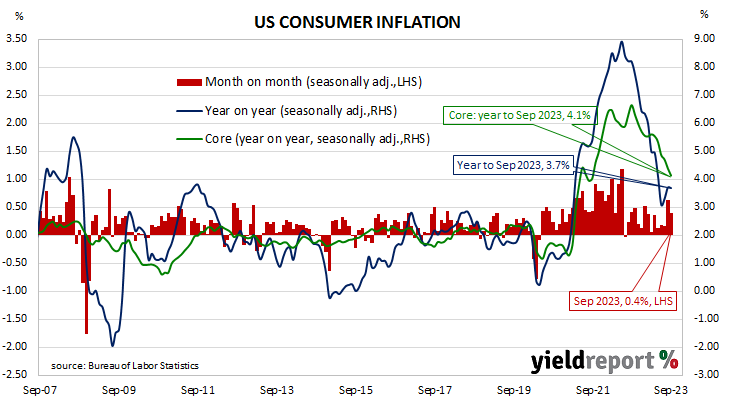
The annual rate of US inflation as measured by changes in the consumer price index (CPI) halved from nearly 3% in the period from July 2018 to February 2019. It then fluctuated in a range from 1.5% to 2.0% through 2019 before rising above 2.0% in the final months of that year. Substantially lower rates were reported from March 2020 to May 2020 and they remained below 2% until March 2021. Rates have since risen significantly, although they have been declining since mid-2022.

The latest US CPI figures released by the Bureau of Labor Statistics indicated seasonally-adjusted consumer prices increased by 0.4% on average in September. The result was slightly above expectations of a 0.3% rise but less than August’s 0.6% increase. On a 12-month basis, the inflation rate remained steady at 3.7%.

“Headline” inflation is known to be volatile and so references are often made to “core” inflation for analytical purposes. The core prices index, the index which excludes the more variable food and energy components, also increased by 0.3% on a seasonally-adjusted basis over the month, in line with expectations. The annual growth rate slowed from 4.4% to 4.1%.

“US headline CPI printed at 0.4%, only a little to upside of consensus…but it was sufficient to initiate a sharp selloff in bonds,” said NAB senior interest rate strategist Ken Crompton. “Although the core ex-food and energy measure met forecasts at 0.3%, some of the other core measures were surprisingly strong and helped drive the market reaction.”

US Treasury bond yields rose materially on the day. By the close of business, the 2-year Treasury yield had added 8bps to 5.07%, the 10-year yield had gained 14bps to 4.80% while the 30-year yield finished 17bps higher at 4.86%.

In terms of US Fed policy, expectations of a lower federal funds rate in the next 12 months softened. At the close of business, contracts implied the effective federal funds rate would average 5.355% in November, 3bps more than the current spot rate, 5.40% in December and 5.425% in January. September 2024 contracts implied 4.98%, 35bps less than the current rate.   

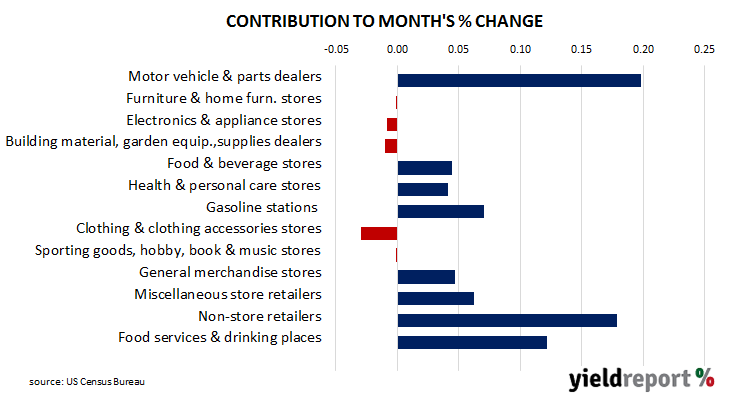
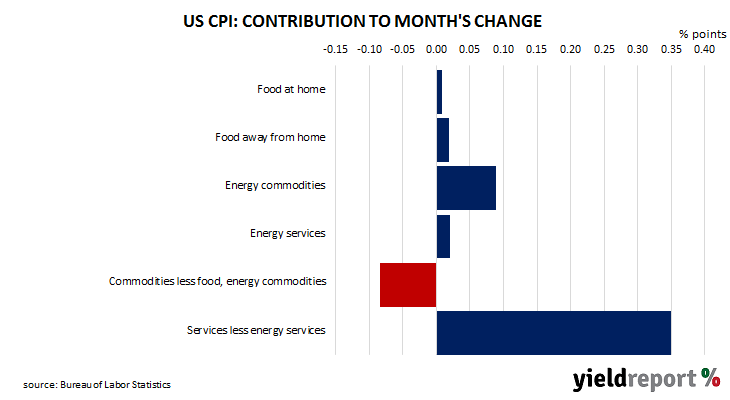
The largest influence on headline results is often the change in fuel prices. Prices of “Energy commodities”, the segment which contains vehicle fuels, increased by 2.3% and contributed 0.09 percentage points to the total. However, prices of non-energy services, the segment which includes actual and implied rents, had the largest effect on the total, adding 0.35 percentage points after increasing by 0.6% on average.

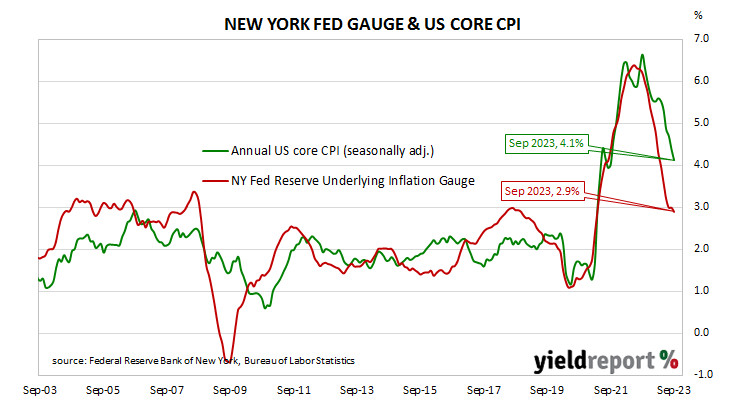
The Federal Reserve Bank of New York publishes an unofficial estimate of underlying inflation, known as the Underlying Inflation Gauge (UIG) and it was updated shortly after these latest CPI figures. While the Federal Reserve states the UIG does not represent an official estimate, the UIG does appear to lead the core CPI measure. September’s UIG registered an annual rate of 2.9%, down from August’s figure of 3.0%.

Higher-than-expected US September PPI driven by hardware, building materials margins

11 October 2023

Summary: US producer price index (PPI) up 0.5% in September, greater than expected; annual rate increases to 2.2%; “core” PPI up 0.3%; NAB: trade services prices jump, driven by margins for retailers of hardware, building materials; long-term Treasury yields down significantly, 2-year yield up a little; 2024 rate-cut expectations soften; goods prices up 0.9%, services prices up 0.3%.

Around the end of 2018, the annual inflation rate of the US producer price index (PPI) began a downtrend which continued through 2019. Months in which producer prices increased suggested the trend may have been coming to an end, only for it to continue, culminating in a plunge in April 2020. Figures returned to “normal” towards the end of that year but were well above the long-term average through 2021, 2022 and the first quarter of 2023.

The latest figures published by the Bureau of Labor Statistics indicate producer prices increased by 0.5% after seasonal adjustments in September. The result was greater than the 0.3% rise which had been generally expected but less than August’s 0.7% increase. On a 12-month basis, the rate of producer price inflation after seasonal adjustments and revisions accelerated from August’s figure of 1.9% to 2.2%.

Producer prices excluding foods and energy, or “core” PPI, increased by 0.3% after seasonal adjustments. The result was more than the expected 0.2% increase as well as August’s 0.2%. The annual rate accelerated from 2.5% to 2.7% after revisions.

“There was a 7.0% annualized jump in the trade services component, which measures gross wholesale and retail margins, driven by a leap in margins for retailers of hardware, building materials,” said NAB Head of Market Economics, Tapas Strickland. “If you exclude trade services from core then PPI was bang in line at 0.2%.”

Long-term US Treasury bond yields fell significantly on the day while short-term yields increased modestly. By the close of business, the 2-year Treasury yield had added 2bps to 4.99%, the 10-year yield had shed 10bps to 4.56% while the 30-year yield finished 15bps lower at 4.69%.

In terms of US Fed policy, expectations of a lower federal funds rate in the next 12 months softened a little. At the close of business, contracts implied the effective federal funds rate would average 5.355% in November, 3bps more than the current spot rate, 5.385% in December and 5.405% in January. September 2024 contracts implied 4.92%, 41bps less than the current rate.

The BLS stated a 0.9% rise in final demand goods was the main factor in the overall increase. Prices of final demand services increased by 0.3%.

The producer price index is a measure of prices received by producers for domestically produced goods, services and construction. It is put together in a fashion similar to the consumer price index (CPI) except it measures prices received from the producer’s perspective rather than from the perspective of a retailer or a consumer. It is another one of the various measures of inflation tracked by the US Fed, along with core personal consumption expenditure (PCE) price data. 

Optimism in “extremely short supply” despite higher sentiment index

10 October 2023

Summary: Household sentiment improves; optimism in “extremely short supply”; ACGB yields lower; rate-rise expectations soften; four of five sub-indices higher; fewer respondents expecting higher jobless rate.

After a lengthy divergence between measures of consumer sentiment and business confidence in Australia which began in 2014, confidence readings of the two sectors converged again in mid-July 2018. Both measures then deteriorated gradually in trend terms, with consumer confidence leading the way. Household sentiment fell off a cliff in April 2020 but, after a few months of to-ing and fro-ing, it then staged a full recovery. However, consumer sentiment has deteriorated significantly over the past two years, while business sentiment has been more robust.

According to the latest Westpac-Melbourne Institute survey conducted in the first week of October, household sentiment has improved, albeit to a still pessimistic level.  Their Consumer Sentiment Index rose from September’s reading of 79.7 to 82.0, a reading which is still well below the “normal” range and significantly lower than the long-term average reading of just over 101.

“The consumer mood has improved slightly but optimism remains in extremely short supply,” said Westpac Chief Economist Bill Evans. “At 82, the latest Index read is still in deeply pessimistic territory, consistent with a continuation of the contraction in per capita spending seen since late last year.”

Any reading of the Consumer Sentiment Index below 100 indicates the number of consumers who are pessimistic is greater than the number of consumers who are optimistic.

The report was released on the same day as the latest NAB Business Survey and Commonwealth Government bond yields moved lower on the day. By the close of business, the 3-year ACGB yield had lost 3bps to 3.93%, the 10-year yield had shed 7bps to 4.47% while the 20-year yield finished 5bps lower at 4.82%.

In the cash futures market, expectations regarding further rate rises softened. At the end of the day, contracts implied the cash rate would increase from the current rate of 4.07% and average 4.105% through November, 4.13% in December and 4.175% in February. May 2024 contracts implied a 4.185% average cash rate while August 2024 contracts implied 4.135%, 7bps more than the current rate.

Four of the five sub-indices registered higher readings, with the “Time to buy a major household item” sub-index posting the largest monthly percentage gain.

The Unemployment Expectations index, formerly a useful guide to RBA rate changes, dropped back from 130.8 to 127.3. Lower readings result from fewer respondents expecting a higher unemployment rate in the year ahead.

“Ongoing resilience” in Sep NAB business survey

10 October 2023

Summary: Business conditions deteriorate in September; business pessimism unchanged, still below average; survey points to ongoing resilience, cost pressures and price growth easing; ACGB yields lower; rate-rise expectations soften; capacity utilisation rate declines, still at elevated level.

NAB’s business survey indicated Australian business conditions were robust in the first half of 2018, with a cyclical-peak reached in April of that year. Readings from NAB’s index then began to slip and forecasts of a slowdown in the domestic economy began to emerge in the first half of 2019 as the index trended lower. It hit a nadir in April 2020 as pandemic restrictions were introduced but then conditions improved markedly over the next twelve months.

According to NAB’s latest monthly business survey of around 500 firms conducted in second half of September, business conditions deteriorated somewhat while maintaining a level which is above average. NAB’s conditions index registered 11 points, down 3 points from August’s revised reading.

Business confidence remained unchanged after three consecutive months of improvement.  NAB’s confidence index remained unchanged from August’s revised reading of 1 point, still below the long-term average.  Typically, NAB’s confidence index leads the conditions index by one month, although some divergences have appeared from time to time.

“Overall, the survey continues to point to ongoing resilience in activity with conditions down slightly in September but remaining above average at +11 index points, where the index has hovered since May,” said NAB senior economist Brody Viney. “The survey also showed some positive signs for inflation with cost pressures and price growth easing.”

The report was released on the same day as the latest Westpac-Melbourne Institute consumer sentiment survey and Commonwealth Government bond yields moved lower on the day. By the close of business, the 3-year ACGB yield had lost 3bps to 3.93%, the 10-year yield had shed 7bps to 4.47% while the 20-year yield finished 5bps lower at 4.82%.

In the cash futures market, expectations regarding further rate rises softened. At the end of the day, contracts implied the cash rate would increase from the current rate of 4.07% and average 4.105% through November, 4.13% in December and 4.175% in February. May 2024 contracts implied a 4.185% average cash rate while August 2024 contracts implied 4.135%, 7bps more than the current rate.

NAB’s measure of national capacity utilisation decreased from August’s reading of 85.1% to 84.2%, a level which is still elevated from a historical perspective. All eight sectors of the economy were reported to be operating at or above their respective long-run averages.

Capacity utilisation is generally accepted as an indicator of future investment expenditure and it also has a strong inverse relationship with Australia’s unemployment rate.

Click for more news