News

Sep non-farm payrolls double expected; “comfortably above” pre-COVID average

06 October 2023

Summary: Non-farm payrolls up 336,000 in September, double expectations; previous two months’ figures revised up by 119,000; jobless rate ticks steady at 3.8%, participation rate steady; NAB: “comfortably above” pre-COVID averages; employed-to-population ratio steady at 60.4%; underutilisation rate down; annual hourly pay growth slows to 4.2%.

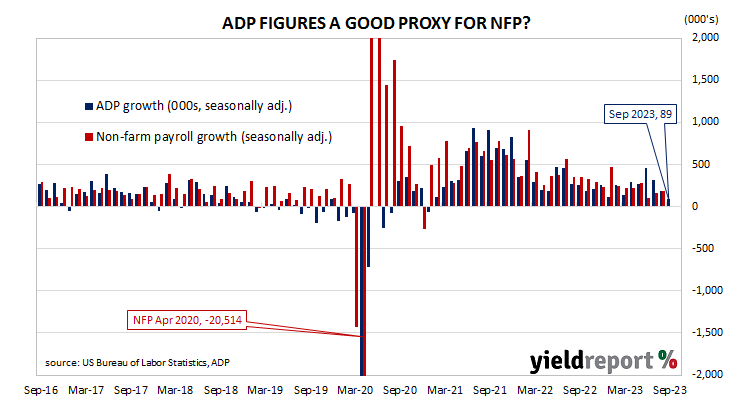
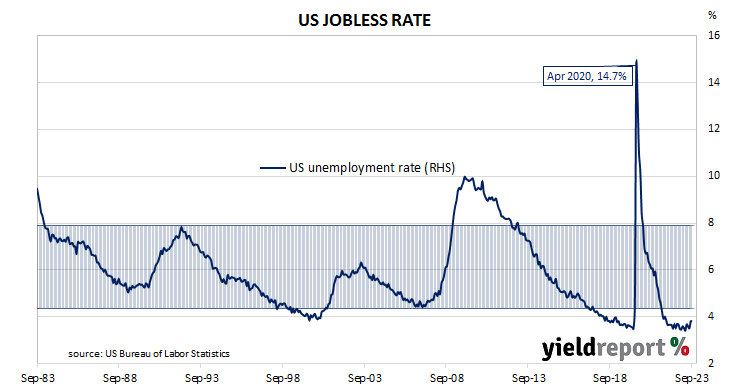
The US economy ceased producing jobs in net terms as infection controls began to be implemented in March 2020. The unemployment rate had been around 3.5% but that changed as job losses began to surge through March and April of 2020. The May 2020 non-farm employment report represented a turning point and subsequent months provided substantial employment gains which continued through into 2021 and 2022. Changes in recent months have been generally more in line with the average of the last decade.

According to the US Bureau of Labor Statistics, the US economy created an additional 336,000 jobs in the non-farm sector in September. The increase was double the 170,000 which had been generally expected and considerably more than the 227,000 jobs which had been added in August after revisions. Employment figures for July and August were revised up by a total of 119,000.

The total number of unemployed increased by 5,000 to 6.36 million while the total number of people who were either employed or looking for work increased by 91,000 to 167.93 million. These changes led to the US unemployment rate remaining unchanged after revisions from August’s figure of 3.8% as the participation rate remained steady at 62.6%.

“The three-month average of payrolls gains is 266,000, comfortably above pre-COVID averages near 200,000 and rates needed to keep pace with population growth,” said NAB economist Taylor Nugent. “It’s also faster than the pace of jobs growth earlier in 2023.”

US Treasury yields rose materially on the day. By the close of business, the 2-year yield had added 6bps to 5.08%, the 10-year yield had gained 8bps to 4.80% while the 30-year yield finished 7bps higher at 4.96%.

In terms of US Fed policy, expectations of a lower federal funds rate in the next 12 months softened. At the close of business, contracts implied the effective federal funds rate would average 5.405% in November, 8bps more than the current spot rate, 5.43% in December and 5.45% in January. September 2024 contracts implied 5.00%, 33bps less than the current rate.

One figure which is indicative of the “spare capacity” of the US employment market is the employment-to-population ratio. This ratio is simply the number of people in work divided by the total US population. It hit a cyclical-low of 58.2 in October 2010 before slowly recovering to just above 61% in late-2019. September’s reading remained unchanged at 60.4%, still some way from the April 2000 peak reading of 64.7%.

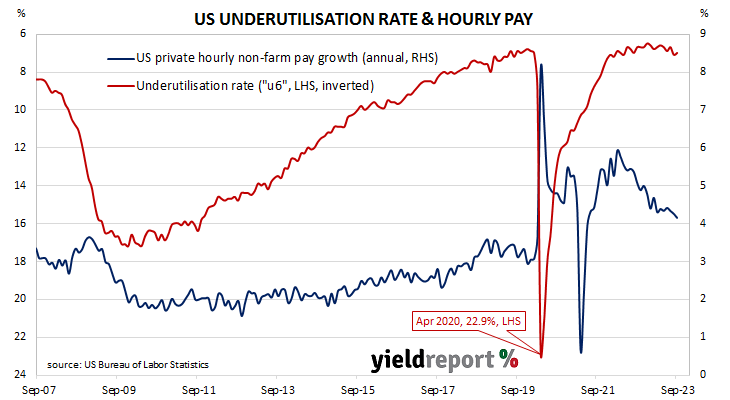
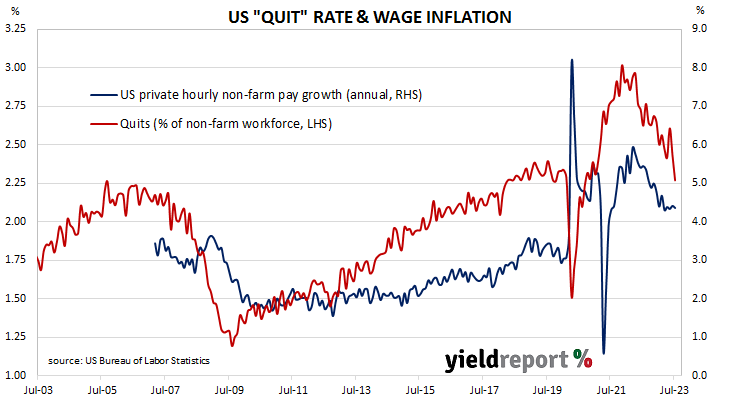
Apart from the unemployment rate, another measure of tightness in the labour market is the underutilisation rate and the latest reading of it registered 7.0%, down from 7.1% in August. Wage inflation and the underutilisation rate usually have an inverse relationship and hourly pay growth in the year to September slowed from 4.3% to 4.2%.

ADP September report posts 89k gain; smallest rise in 33 months

04 October 2023

Summary: ADP payrolls up 89,000 in September, less than consensus expectations; August number revised up by 3,000; ANZ: confirms slowing US labour market, smallest rise in 33 months; US Treasury yields fall noticeably; expectations of Fed rate cuts in 2024 harden; positions up in small, medium businesses, down in large ones; slightly over 90% of gains in services sector, led by leisure/hospitality sector.

The ADP National Employment Report is a monthly report which provides an estimate of US non-farm jobs in the private sector. Publishing of the report began in 2006 and its figures exhibited a high correlation with official non-farm payroll figures even though large differences arose in individual months. A major revamp of the ADP report took place in mid-2022, materially altering the data. However, month-on-month changes in the non-farm payroll data and ADP series are still highly correlated.

The latest ADP report indicated private sector job numbers increased by 89,000 in September, less than the 150,000 increase which had been generally expected. August’s rise was revised up by 3,000 to 180,000.

“The ADP data confirm the labour market is slowing and the September gain was the smallest rise in 33 months,” said ANZ economist Madeline Dunk. “The ADP also reported that median wage growth slowed to 5.9%, its 12th consecutive monthly decline.”

US Treasury yields fell noticeably on the day, especially at the short end of the curve. By the close of business, the 2-year had shed 10bps to 5.05% while 10-year and 30-year yields both finished 7bps lower at 4.73% and 4.86% respectively.

In terms of US Fed policy, expectations of a lower federal funds rate in the next 12 months hardened. At the close of business, contracts implied the effective federal funds rate would average 5.38% in November, 5bps more than the current spot rate, 5.41% in December and 5.425% in January. September 2024 contracts implied 4.965%, 36bps less than the current rate.

Employment numbers in net terms increased in small and medium-sized businesses while contracting in large enterprises. Firms with less than 50 employees gained a net 95,000 positions, mid-sized firms (50-499 employees) added 72,000 positions while large businesses (500 or more employees) accounted for 83,000 fewer positions.

Employment at service providers accounted for slightly more than 90% of the total net increase, or 81,000 positions. The “Leisure and hospitality” sector was the largest single source of gains, with 92,000 more positions, while the Professional and business services” sector was the month’s largest single source of losses, with 32,000 fewer positions . Total jobs among goods producers increased by a net 9,000 positions.

Prior to the ADP report, the consensus estimate of the change in September’s official non-farm employment figure was +170,000. The non-farm payroll report will be released by the Bureau of Labor Statistics this coming Friday night (AEST), 4 October.

US quit rate steady in August; consistent with less confidence

03 October 2023

Summary: US quit rate steady at 2.3% in August; NAB: consistent with less confidence; long-term US Treasury yields rise materially; expectations of Fed rate cuts in 2024 soften slightly; ANZ: opening numbers still high compared to historic numbers; quits, separations, openings all higher.

The number of US employees who quit their jobs as a percentage of total employment increased slowly but steadily after the GFC. It peaked in March 2019 and then tracked sideways until virus containment measures were introduced in March 2020. The quit rate then plummeted as alternative employment opportunities rapidly dried up. Following the easing of US pandemic restrictions, it proceeded to recover back to its pre-pandemic rate in the third quarter of 2020 and trended higher through 2021 before easing through 2022 and the first half of 2023.

Figures released as part of the latest Job Openings and Labor Turnover Survey (JOLTS) report show the quit rate remained steady in August. 2.3% of the non-farm workforce left their jobs voluntarily, unchanged from July. Quits in the month rose by 19,000 while an additional 187,000 people were employed in non-farm sectors.

NAB senior FX strategist Rodrigo Catril noted the steady quit rate, saying it matched ”the lowest level since 2020, consistent with workers remaining less confident in their ability to find another job in the current market, and suggesting some evidence of skill mismatch.”

Long-term US Treasury yields finished the day materially higher. By the close of business, the 2-year Treasury bond yields had added 4bps to 5.15%, the 10-year yield had gained 12bps to 4.80% while the 30-year yield finished 14bps higher at 4.93%.

In terms of US Fed policy, expectations of a lower federal funds rate in the next 12 months softened a touch. At the close of business, contracts implied the effective federal funds rate would average 5.405% in November, 8bps more than the current spot rate, 5.44% in December and 5.465% in January. September 2024 contracts implied 5.085%, 24bps less than the current rate.

The rise in total quits was led by 88,000 more resignations in the “Accommodation and food services” sector while the “Retail trade” sector experienced the largest loss, falling by 52,000. Overall, the total number of quits for the month rose from July’s revised figure of 3.619 million to 3.638 million.

Total vacancies at the end of August jumped by 690,000, or 7.7%, from July’s revised figure of 8.920 million to 9.610 million. The rise was driven by a 509,000 gain in the “Professional and business services” sector while the “Accommodation and food services” sector experienced the single largest decline, falling by 55,000. Overall, 11 out of 18 sectors experienced more job openings than in the previous month.  

“Job opening numbers are still high compared to historic numbers,” said ANZ senior economist Adelaide Timbrell. “Further progress on bringing supply and demand back to greater balance is required but it is gradually trending in the right direction.”

Total separations increased by 38,000, or 0.7%, from July’s revised figure of 5.638 million to 5.676 million. The increase was led by the “Accommodation and food services” sector where there were 105,000 more separations than in July. Separations increased in 10 of the 18 sectors.

The “quit” rate time series produced by the JOLTS report is a leading indicator of US hourly pay. As wages account for around 55% of a product’s or service’s price in the US, wage inflation and overall inflation rates tend to be closely related. Former Federal Reserve chief and current Treasury Secretary Janet Yellen was known to pay close attention to it.

September job ads index holds; market “loosening”

03 October 2023

Summary: Job ads slip 0.1% in September; 8.3% lower than September 2022; ANZ: up 2.3% over last 3 months; long-term ACGB yields up moderately; rate-rise expectations soften slightly; ANZ: labour market is loosening; ad index-to-workforce ratio steady at 0.99.

From mid-2017 onwards, year-on-year growth rates in the total number of Australian job advertisements consistently exceeded 10%. That was until mid-2018 when the annual growth rate fell back markedly. 2019 was notable for its reduced employment advertising and this trend continued into the first quarter of 2020. Advertising plunged in April and May of 2020 as pandemic restrictions took effect but then recovered quite quickly to historically-high levels.

According to the latest ANZ-Indeed figures, total advertisements slipped 0.1% in September on a seasonally adjusted basis. The result followed gains of 1.7% and 0.7% in August and July respectively. On a 12-month basis, total job advertisements were 8.3% lower than in September 2022, down from August’s revised figure of -8.0%.

“The series has demonstrated remarkable staying power recently and has lifted 2.2% over the last three months,” said ANZ economist Madeline Dunk.

Long-term Commonwealth Government bond yields rose moderately on the day, somewhat lagging overnight movements of US Treasury yields. By the close of business, the 3-year ACGB yield had crept up 1bp to 4.10% while 10-year and 20-year yields both finished 5bps higher at 4.56% and 4.87% respectively.

In the cash futures market, expectations regarding further rate rises softened slightly. At the end of the day, contracts implied the cash rate would increase from the current rate of 4.07% and average 4.125% through November, 4.195% in December and 4.275% in February. May 2024 contracts implied a 4.31% average cash rate while August 2024 contracts implied 4.30%, 23bps more than the current rate.

“The Australian labour market is loosening,” Dunk  added. “While things are still tight, the underemployment rate has been creeping upwards, the unemployment rate has risen to 3.7% and hours worked fell in August. This continued cooling of the labour market should help temper any future gains in Job Ads.”

The inverse relationship between job advertisements and the unemployment rate has been quite strong (see below chart), although ANZ themselves called the relationship between the two series into question in early 2019.  A higher job advertisement index as a proportion of the labour force is suggestive of lower unemployment rates in the near future while a lower ratio suggests higher unemployment rates will follow. September’s ad index-to-workforce ratio remained steady at 0.99 after revisions.

In 2008/2009, advertisements plummeted and Australia’s unemployment rate jumped from 4% to nearly 6% over a period of 15 months. When a more dramatic fall in advertisements took place in April 2020, the unemployment rate responded much more quickly.

August home approvals up 7.0%; prospects “still look mixed at best”

03 October 2023

Home approval numbers up 7.0% in August, above expectations; 22.9% lower than August 2022; Westpac: underlying picture a gradual up-trend from weak level; Westpac: prospects for dwelling approvals still look mixed at best; house approvals up 6.0%, apartments up 8.8%; non-residential approvals up 1.5% in dollar terms, residential alterations down 2.4%.

Building approvals for dwellings, that is apartments and houses, headed south after mid-2018. As an indicator of investor confidence, falling approvals had presented a worrying signal, not just for the building sector but for the overall economy. However, approval figures from late-2019 and the early months of 2020 painted a picture of a recovery taking place, even as late as April of that year. Subsequent months’ figures then trended sharply upwards before falling back through 2021, 2022 and the first half of 2023.

The Australian Bureau of Statistics has released the latest figures from August which show total residential approvals rose by 7.0% on a seasonally-adjusted basis. The result was a greater one than the 2.5% gain which had been generally expected and in contrast with July’s 7.0% fall after revisions. However, total approvals still fell by 22.9% on an annual basis, down from the previous month’s revised figure of -10.3%. Monthly growth rates are often volatile.

“The result comes off two months of sizeable declines led by units,” said Westpac senior economist Matthew Hassan. “Despite the positive result, the underlying picture still looks to be of a gradual up-trend from a weak level with the unit gains unlikely to be sustained.”

Long-term Commonwealth Government bond yields rose moderately on the day, somewhat lagging overnight movements of US Treasury yields. By the close of business, the 3-year ACGB yield had crept up 1bp to 4.10% while 10-year and 20-year yields both finished 5bps higher at 4.56% and 4.87% respectively.

In the cash futures market, expectations regarding further rate rises softened slightly. At the end of the day, contracts implied the cash rate would increase from the current rate of 4.07% and average 4.125% through November, 4.195% in December and 4.275% in February. May 2024 contracts implied a 4.31% average cash rate while August 2024 contracts implied 4.30%, 23bps more than the current rate.

“Stepping back from the latest monthly data, prospects for dwelling approvals still look mixed at best,” Hassan added. “On the positive side, population-driven demand is clearly strong and wider housing markets are seeing a recovery. However, there still look to be significant legacy problems from the surge in construction costs, which has still to run its course, and capacity issues with a major wave of building sector insolvencies and labour shortages.”

Approvals for new houses rose by 6.0% over the month, up from July’s 0.3% gain after revisions. However, on a 12-month basis, house approvals were still 14.5% lower than they were in August 2022, up from July’s comparable figure of -16.7%.                                           

Apartment approval figures are usually a lot more volatile and August’s total rose by 8.8% after a 18.9% drop in July. The 12-month growth rate fell from July’s revised rate of 4.4% to -34.5%.

Non-residential approvals decreased by 1.5% in dollar terms over the month but were 25.5% higher on an annual basis. Figures in this segment also tend to be rather volatile.

Residential alteration approvals declined by 2.4% in dollar terms over the month and were 1.5% lower than in August 2022.

August home loan approvals up 2.2%; “coming from a weak starting point”

03 October 2023

Summary: Value of loan commitments up 2.2% in August, more than expected; 9.4% lower than August 2022; Westpac: a gradual up-trend coming from weak starting point; value of owner-occupier loan approvals up 2.6%; investor approvals up 1.6%; number of owner-occupier home loan approvals up 2.5%.

The number and value of home-loan approvals began to noticeably increase after the RBA reduced its cash rate target in a series of cuts beginning in mid-2019, potentially ending the downtrend which had been in place since mid-2017. Figures from February through to May of 2020 provided an indication the downtrend was still intact but subsequent figures then pushed both back to record highs in 2021. However, there has been a considerable pullback since then, although the total value of new loans is still elevated by historical standards.

August’s housing finance figures have now been released and total loan approvals excluding refinancing increased by 2.2% In dollar terms over the month, more than the flat result which had been generally expected and in contrast with July’s 1.1% fall. On a year-on-year basis, total approvals excluding refinancing fell by 9.4%, up from the previous month’s comparable figure of -14.0%.

“The mix showed gains led by owner occupier loans for the purchase of existing dwellings with other segments a touch softer,” said Westpac senior economist Matthew Hassan. “The picture continues to be one of a gradual up-trend coming from a weak starting point, the total value of finance approvals still 27% below the peak at the start of last year.”

Long-term Commonwealth Government bond yields rose moderately on the day, somewhat lagging overnight movements of US Treasury yields. By the close of business, the 3-year ACGB yield had crept up 1bp to 4.10% while 10-year and 20-year yields both finished 5bps higher at 4.56% and 4.87% respectively.

In the cash futures market, expectations regarding further rate rises softened slightly. At the end of the day, contracts implied the cash rate would increase from the current rate of 4.07% and average 4.125% through November, 4.195% in December and 4.275% in February. May 2024 contracts implied a 4.31% average cash rate while August 2024 contracts implied 4.30%, 23bps more than the current rate.

The total value of owner-occupier loan commitments excluding refinancing increased by 2.6%, in contrast with July’s 1.6% fall. On an annual basis, owner-occupier loan commitments were 12.5% lower than in August 2022, above July’s comparable figure of -17.3%.

The total value of investor commitments excluding refinancing increased by 1.6%. The rise followed a 0.3% decline in July, slowing the contraction rate over the previous 12 months from 7.2% to 3.0%.

The total number of loan commitments to owner-occupiers excluding refinancing increased by 2.5% to 25,504 on a seasonally adjusted basis. The rise contrasted with July’s 2.2% decrease and the annual contraction rate slowed from 15.8% after revisions to 12.3%.

US manufacturing “may be stabilising”: ISM September PMI

02 October 2023

Summary: ISM PMI up in September, above expectations; NAB: US manufacturing may be stabilising; US Treasury yields significantly higher; expectations of Fed rate cuts in next 12 months soften; ANZ: worst of manufacturing headwinds dissipating; ISM: reading corresponds to 0.1% US GDP contraction annualised.

The Institute of Supply Management (ISM) manufacturing Purchasing Managers Index (PMI) reached a cyclical peak in September 2017. It then started a downtrend which ended in March 2020 with a contraction in US manufacturing which lasted until June 2020. Subsequent month’s readings implied growth had resumed, with the index becoming stronger through to March 2021. Readings have since declined fairly steadily.

According to the ISM’s September survey, its PMI recorded a reading of 49.0%,  above the generally expected figure of 47.8% as well as August’s 47.6%. The average reading since 1948 is 53.0% and any reading below 50% implies a contraction in the US manufacturing sector relative to the previous month.

“Overall, the report is consistent with the narrative that manufacturing may be stabilising after the initial hit from higher rates,” said NAB Head of Markets Strategy Skye Masters.

US Treasury yields finished the day significantly higher. By the close of business, the 2-year Treasury bond yield had added 6bps to 5.11%, the 10-year yield had gained 10bps to 4.68% while the 30-year yield finished 8bps higher at 4.79%.

In terms of US Fed policy, expectations of a lower federal funds rate in the next 12 months softened. At the close of business, contracts implied the effective federal funds rate would average 5.40% in November, 7bps more than the current spot rate, 5.435% in December and 5.46% in January. September 2024 contracts implied 5.075%, 25bps less than the current rate.

“This highlighted a degree of resilience in the domestic economy despite the FOMC’s cumulative 525bps rise in policy rates,” said ANZ senior economist Catherine Birch. “The report suggested the worst of the headwinds affecting the manufacturing sector are dissipating.”

Purchasing managers’ indices (PMIs) are economic indicators derived from monthly surveys of executives in private-sector companies. They are diffusion indices, which means a reading of 50% represents no change from the previous period, while a reading under 50% implies respondents reported a deterioration on average. A reading “above 48.7%, over a period of time, generally indicates an expansion of the overall economy”, according to the ISM.    

The ISM’s manufacturing PMI figures appear to lead US GDP by several months despite a considerable error in any given month. The chart below shows US GDP on a “year on year” basis (and not the BEA annualised basis) against US GDP implied by monthly PMI figures. 

According to the ISM and its analysis of past relationships between the PMI and US GDP, September’s PMI corresponds to an annualised expansion rate of 0.1%, or about zero over a quarter. However, regression analysis on a year-on-year basis still suggests a 12-month GDP growth rate of 2.1% five months after this latest report.

The ISM index is one of two monthly US PMIs, the other being an index published by S&P Global. S&P Global produces a “flash” estimate in the last week of each month which comes out about a week before the ISM index is published. The S&P Global flash September manufacturing PMI registered 48.9%, 1.0 percentage points higher than August’s final figure.

Melb. Institute inflation measure slows in September

02 October 2023

Summary: Melbourne Institute Inflation Gauge index up 0.1% in September; up 5.7% on annual basis; ACGB yields barely move; rate-rise expectations unchanged.

The Melbourne Institute’s Inflation Gauge is an attempt to replicate the ABS consumer price index (CPI) on a monthly basis. It has turned out to be a reliable leading indicator of the CPI, although there are periods in which the Inflation Gauge and the CPI have diverged for as long as twelve months. On average, the Inflation Gauge’s annual rate tends to overestimate the ABS rate by around 0.1%, at least until recently.

The Melbourne Institute’s latest reading of its Inflation Gauge index indicates consumer prices increased by just 0.1% in September, following increases of 0.2% and 0.8% in August and July respectively. The index rose by 5.7% on an annual basis, down from August’s comparable figure of 6.1%.

Commonwealth Government bond yields barely moved on the day, largely in line with the overnight movements of US Treasury yields. By the close of business, the 3-year ACGB yield had returned to its starting point at 4.09% the 10-year yield had added 1bp to 4.51% while the 20-year yield finished steady at 4.82%.

In the cash futures market, expectations regarding further rate rises remained unchanged. At the end of the day, contracts implied the cash rate would change little from the current rate of 4.07% in the short term and average 4.09% through October, 4.165% in November and 4.22% in December. February 2024 contracts implied a 4.295% average cash rate while May 2024 contracts implied 4.34%, 27bps more than the current rate.

Given the Inflation Gauge’s tendency to overestimate, the latest figures imply an official CPI reading of 0.8% (seasonally adjusted) for the September quarter or 5.0% in annual terms. However, it is worth noting the annual CPI rate to the end of March was 7.0% while the Inflation Gauge had implied a 5.7% annual rate at the time.

Core PCE index up just 0.1% in August; markets yawn

29 September 2023

Summary: US core PCE price index up 0.1% in August, less than expected; annual rate slows 4.3% to 3.9%; Treasury yields barely move; Fed rate-cut expectations for 2024 firm a little.

One of the US Fed’s favoured measures of inflation is the change in the core personal consumption expenditures (PCE) price index. After hitting the Fed’s target at the time of 2.0% in mid-2018, the annual rate then hovered in a range between 1.8% and 2.0% before it eased back to a range between 1.5% and 1.8% through 2019. It then plummeted below 1.0% in April 2020 before rising back to around 1.5% in the September quarter of that year. It has since increased significantly and still remains above the Fed’s target even after recent declines.

The latest figures have now been published by the Bureau of Economic Analysis as part of the August personal income and expenditures report. Core PCE prices rose by 0.1% over the month, less than the 0.2% increase which had been generally expected as well as July’s 0.2% increase. On a 12-month basis, the core PCE inflation rate slowed from July’s revised rate of 4.3% to 3.9%.

US Treasury bond yields barely moved on the day. By the close of business, the 2-year Treasury bond yield had slipped 1bp to 5.05% while 10-year and 30-year yields both finished unchanged at 4.58% and 4.71% respectively.

In terms of US Fed policy, expectations of a lower federal funds rate in the first half of 2024 firmed a little. At the close of business, contracts implied the effective federal funds rate would average 5.37% in November, slightly more than the current spot rate, 5.405% in December and 5.425% in January. September 2024 contracts implied 5.015%, 31bps less than the current rate.

The core version of PCE strips out energy and food components, which are volatile from month to month, in an attempt to identify the prevailing trend. It is not the only measure of inflation used by the Fed; the Fed also tracks the Consumer Price Index (CPI) and the Producer Price Index (PPI) from the Department of Labor. However, it is the one measure which is most often referred to in FOMC minutes.

Euro bond yields jump despite sentiment index’s slide

28 September 2023

Summary: Euro-zone composite sentiment indicator down a touch in September, above expected figure; readings down in four of five sectors; down in two of four largest euro-zone economies; German, French 10-year yields considerably higher; index implies annual GDP growth rate of -0.2%.

The European Commission’s Economic Sentiment Indicator (ESI) is a composite index comprising five differently weighted sectoral confidence indicators.  It is heavily weighted towards confidence surveys from the business sector, with the consumer confidence sub-index only accounting for 20% of the ESI. However, it has a good relationship with euro-zone GDP growth rates, although not necessarily as a leading indicator.

The ESI posted a reading of 93.3 in September, above the generally-expected figure of 92.4 but down a touch from August’s revised reading of 93.6. The average reading since 1985 is just under 100.

German and French 10-year bond yields finished the day considerably higher despite the less-than-stellar figures. By the close of business, German and French 10-year bond yields had both gained 7bps to 2.93% and 3.49% respectively.

Confidence deteriorated in four of the five sectors of the economy. On a geographical basis, the ESI decreased in two of the euro-zone’s four largest economies, Spain and Italy, but improved in Germany and France.

End-of-quarter ESI readings and annual euro-zone GDP growth rates are highly correlated. This latest reading corresponds to a year-to-September GDP growth rate of -0.2%, unchanged from August’s implied growth rate.

Click for more news