News

Household spending appetite being “sapped”; August retail sales up 0.2%

28 September 2023

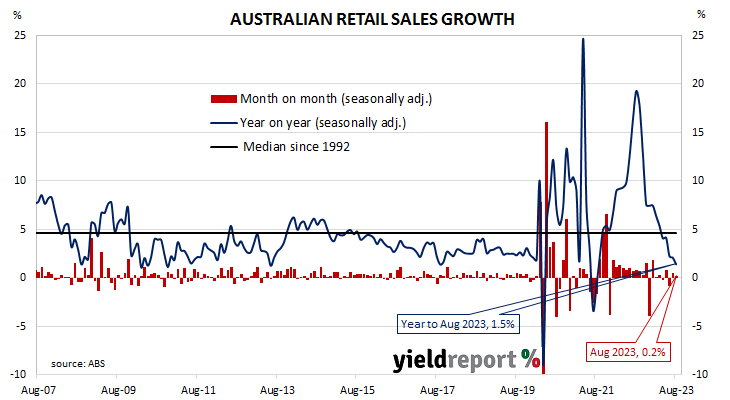
Summary: Retail sales up 0.2% in August, less than expected; up 1.5% on 12-month basis; ANZ: environment sapping households’ appetite to spend; Westpac: sizeable decline in real terms; largest influence on result from clothing sales.

Growth figures of domestic retail sales spent most of the 2010s at levels below the post-1992 average. While economic conditions had been generally favourable, wage growth and inflation rates were low. Expenditures on goods then jumped in the early stages of 2020 as government restrictions severely altered households’ spending habits. Households mostly reverted to their usual patterns as restrictions eased in the latter part of 2020 and throughout 2021.

According to the latest ABS figures, total retail sales increased by 0.2% on a seasonally adjusted basis. The rise was less than the 0.3% increase which had been generally expected as well as July’s 0.5% gain. Sales increased by 1.5% on an annual basis, down from July’s figure of 2.1%.

“Monthly sales have grown less than 3% this year, highlighting that the current economic environment is clearly sapping households’ appetite to spend,” said ANZ economist Madeline Dunk.

Long-term Commonwealth Government bond yields moved considerably higher on the day, following upward movements of US Treasury yields overnight to some degree. By the close of business, the 3-year ACGB yield had gained 7bps to 4.11%, the 10-year yield had added 8bps to 4.47% while the 20-year yield finished 6bps higher at 4.77%.

In the cash futures market, expectations regarding further rate rises firmed. At the end of the day, contracts implied the cash rate would change little from the current rate of 4.07% in the short term and average 4.085% through October, 4.155% in November and 4.215% in December. February 2024 contracts implied a 4.29% average cash rate and May 2024 contracts implied 4.34%, 27bps more than the current rate. 

“Annual growth overall slowed to just 1.5%, representing a sizeable decline in real terms,” said Westpac senior economist Matthew Hassan, “and an even bigger contraction in real per capita terms.”

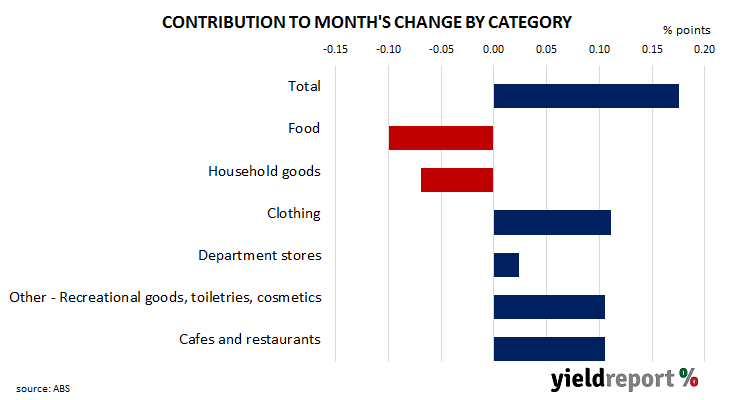
Retail sales are typically segmented into six categories (see below), with the “Food” segment accounting for 40% of total sales. However, the largest influences on the month’s total came from the “Clothing” segment where sales rose by 1.3% over the month. Food sales fell by 0.25%.

Conf. Board confidence index down again in September; decline across all age groups

26 September 2023

Summary: Conference Board Consumer Confidence Index falls in September, reading less than expected; decline across all age groups, notably among household with incomes of $50,000 or more; views of present conditions improve, short-term outlook deteriorates; ANZ: Expectations Index below 80 historically signals recession within year.

US consumer confidence clawed its way back to neutral over the five years after the GFC in 2008/2009 and then went from strength to strength until late 2018. Measures of consumer confidence then oscillated within a relatively narrow band at historically high levels until they plunged in early 2020. Subsequent readings then fluctuated around the long-term average until March 2021 when they returned to elevated levels. However, a noticeable gap has since emerged between the two most-widely followed surveys.

The latest Conference Board survey held during the first half of September indicated US consumer confidence has deteriorated for a second consecutive month. September’s Consumer Confidence Index registered 103.0 on a preliminary basis, below the generally-expected figure of 105.9 as well as August’s final figure of 108.7.

“The decline in consumer confidence was evident across all age groups, and notably among consumers with household incomes of $50,000 or more,” said Dana Peterson, Chief Economist at The Conference Board.

US Treasury yields finished the day a little higher. By the close of business, the 2-year Treasury bond yields had returned to its starting point at 5.13%, the 10-year yield had inched up 1bp to 4.54% while the 30-year yield finished 3bps higher at 4.68%.

In terms of US Fed policy, expectations of a lower federal funds rate in the first half of 2024 firmed a touch. At the close of business, contracts implied the effective federal funds rate would average 5.375% in November, slightly more than the current spot rate, 5.41% in December and 5.435% in January. September 2024 contracts implied 5.05%, 28bps less than the current rate.

Consumers’ views of present conditions improved while their views of the near-future deteriorated. The Present Situation Index increased from August’s revised figure of 146.7 to 147.1 while the Expectations Index decreased from 83.3 to 73.7.

ANZ economist Kishti Sen noted the Expectations index’s fall below 80 and made a sobering observation. “A level below 80 has historically signalled a recession within a year.”

The Consumer Confidence Survey is one of two widely followed monthly US consumer sentiment surveys which produce sentiment indices. The Conference Board’s index is based on perceptions of current business and employment conditions, as well as respondents’ expectations of conditions six months in the future. The other survey, conducted by the University of Michigan, is similar and it is used to produce an Index of Consumer Sentiment. That survey differs in that it does not ask respondents explicitly about their views of the labour market and it also includes some longer-term questions.

German economy treading water; ifo index slips in September

25 September 2023

ifo business climate index falls again in September, above expected figure; sentiment remains bleak, German economy treading water; current conditions index down, expectations index up; expectations index implies euro-zone GDP contraction of 2.6% in year to December.

Following recessions in euro-zone economies in 2009/2010, the ifo Institute’s Business Climate Index largely ignored the European debt-crisis of 2010-2012, mostly posting average-to-elevated readings through to early-2020. However, the index was quick to react in the March 2020 survey, falling precipitously before recovering quickly in subsequent months. Readings through much of 2021 generally fluctuated around the long-term average before dropping away in 2022.

According to the latest report released by ifo, German business sentiment has had a fifth consecutive month of decline after increasing in the six months prior to May. September’s Business Climate Index recorded a reading of 85.7, above the generally expected figure of 85.2 but slightly below August’s final reading of 85.8. The average reading since January 2005 is 96.5.

“Sentiment in the German economy remains bleak. Once again, companies were less satisfied with their current business situation,” said Clemens Fuest, President of the ifo Institute. “However, their pessimism regarding the coming months dissipated slightly. The German economy is treading water.”

German firms’ views of current conditions deteriorated while their collective outlook improved slightly. The current situation index declined from August’s figure of 89.0 to 88.7 while the expectations index crept up from 82.7 after revisions to 82.9.

German and French long-term bond yields finished noticeably higher on the day as sovereign yields kicked higher on both sides of the Atlantic. By the close of business, the German 10-year yield had gained 8bps to 2.81% while the French 10-year OAT yield finished 6bps higher at 3.35%.

The ifo Institute’s business climate index is a composite index which combines German companies’ views of current conditions with their outlook for the next six months. It has similarities to consumer sentiment indices in the US such as the ones produced by The Conference Board and the University of Michigan.

It also displays a solid correlation with euro-zone GDP growth rates. However, the expectations index is a better predictor as it has a higher correlation when lagged by one quarter. September’s expectations index implies a 2.6% year-on-year GDP contraction to the end of December.

“Possible recession”; US leading index down again in August

21 September 2023

Summary: Conference Board leading index down 0.4% in August, in line with expectations; possible recession over next year; regression analysis implies 1.8% contraction in year to November.

The Conference Board Leading Economic Index (LEI) is a composite index composed of ten sub-indices which are thought to be sensitive to changes in the US economy. The Conference Board describes it as an index which attempts to signal growth peaks and troughs; turning points in the index have historically occurred prior to changes in aggregate economic activity. Readings from March and April of 2020 signalled “a deep US recession” while subsequent readings indicated the US economy would recover rapidly. More recent readings have implied US GDP growth rates will turn negative sometime in 2023.

The latest reading of the LEI indicates it decreased by 0.4% in August. The result was in line with expectations but less than July’s -0.3%.

“With August’s decline, the US Leading Economic Index has now fallen for nearly a year and a half straight, indicating the economy is heading into a challenging growth period and possible recession over the next year,” said Justyna Zabinska-La Monica of The Conference Board.

Short-term US Treasury bond yields declined on the day while longer-term yields rose substantially. By the close of business, the 2-year Treasury yield had lost 2bps to 5.15%, the 10-year yield had gained 10bps to 4.50% while the 30-year yield finished 14bps higher at 4.58%.

In terms of US Fed policy, expectations of a lower federal funds rate in the first half of 2024 softened. At the close of business, contracts implied the effective federal funds rate would average 5.33% in September, in line with the current spot rate, 5.40% in November and 5.435% in December. September 2024 contracts implied 5.075%, 25bps less than the current rate.

The Conference Board currently forecasts GDP growth of 2.2% in 2023 but just 0.8% in 2024. Regression analysis suggests the latest reading implies a -1.8% year-on-year growth rate in November, down from the -1.7% implied by the previous month’s LEI.

Euro-zone sentiment down again in September

21 September 2023

Summary: Euro-zone household sentiment more pessimistic in September; consumer confidence index noticeably below long-term average, lower bound of “normal” readings; euro-zone yields increase modestly.

EU consumer confidence plunged during the GFC and again in 2011/12 during the European debt crisis. After bouncing back through 2013 and 2014, it fell back significantly in late 2018 but only to a level which corresponds to significant optimism among households. Following the plunge which took place in April 2020, a recovery began a month later, with household confidence returning to above-average levels from March 2021. However, readings subsequent to early 2022 were extremely low by historical standards until just recently.

Consumer confidence deteriorated for a second consecutive month in September according to the latest survey conducted by the European Commission. Its Consumer Confidence Indicator recorded a reading of -17.8, below the generally expected figure of -16.0 which is also the figure for August. This latest reading is still noticeably below the long-term average of -10.4 and below the lower end of the range in which “normal” readings usually occur.

Sovereign bond yields in major euro-zone bond markets increased modestly on the day. By the close of business, the German 10-year bund yield had added 1bps to 2.73% while the French 10-year OAT yield finished 3bps higher at 3.28%.

Weakness continues; Westpac-MI leading index up slightly in August

20 September 2023

Summary: Leading index growth rate rises in August; extended period of weakness continues; reading implies annual GDP growth of around 2.20%; ACGB yields rise moderately; rate-rise expectations firm; Westpac: less than 1% GDP growth expected for year to June 2024.

Westpac and the Melbourne Institute describe their Leading Index as a composite measure which attempts to estimate the likely pace of Australian economic growth in the short-term. After reaching a peak in early 2018, the index trended lower through 2018 and 2019 before plunging to recessionary levels in the second quarter of 2020. Subsequent readings spiked towards the end of 2020 but then trended lower through 2021, 2022 and the first half of 2023.

The August reading of the six month annualised growth rate of the indicator registered -0.50%, up from July’s revised figure of -0.56%.

“The economy continues to move through an extended period of weakness,” said Westpac Chie Economist Bill Evans. “Despite another slight improvement this month, the Leading Index growth rate continues to track in negative territory, the measure having now been below zero for just over a year.”

Index figures represent rates relative to “trend” GDP growth, which is generally thought to be around 2.75% per annum in Australia. The index is said to lead GDP by “three to nine months into the future” but the highest correlation between the index and actual GDP figures occurs with a three-month lead. The current reading is thus indicative of an annual GDP growth rate of around 2.20% in the next quarter.

Domestic Treasury bond yields rose moderately on the day, broadly in line with the rises of US Treasury bonds yields overnight. By the close of business, the 3-year ACGB yield had gained 6bps to 3.93%, the 10-year yield had added 5bps to 4.23% while the 20-year yield finished 4bps higher at 4.54%.

In the cash futures market, expectations regarding further rate rises firmed. At the end of the day, contracts implied the cash rate would change little from the current rate of 4.07% in the short term and average 4.085% through October, 4.145% in November and 4.20% in December. February 2024 contracts implied a 4.24% average cash rate and May 2024 contracts implied 4.27%, 20bps more than the current rate.  

“Westpac expects this weak performance to continue over the next year or so with growth expected to come in at less than 1% for the year to June 2024,” added Evans. “There may be some upside risks to that downbeat number now that population growth is likely to exceed 2% in 2023.”

Revisions blunt better-than-expected US August output figure

15 September 2023

US industrial output up 0.4% in August, above expectations; up 0.2% over past 12 months; NAB: downward revisions blunt better-than-expected outcome; long-term Treasury yields rise moderately; rate-cut expectations soften; capacity utilisation rate up 0.2ppts to 79.7%, slightly below long-term average.

The Federal Reserve’s industrial production (IP) index measures real output from manufacturing, mining, electricity and gas company facilities located in the United States. These sectors are thought to be sensitive to consumer demand and so some leading indicators of GDP use industrial production figures as a component. US production collapsed through March and April of 2020 before recovering the ground lost over the fifteen months to July 2021.

According to the Federal Reserve, US industrial production increased by 0.4% on a seasonally adjusted basis in August. The result was greater than the 0.1% expansion which had been generally expected but lower than July’s 0.7% increase after it was revised down from 1.0%. On an annual basis the contraction rate accelerated from July’s revised figure of zero to  0.2%.

 “Downward revisions blunted the beat and the better-than-expected outcome was not driven by manufacturing which was as expected at 0.1%,” said NAB Head of Market Economics Tapas Strickland.

Long-term US Treasury bond yields increased moderately on the day. By the close of business, the 2-year Treasury yield had gained 3bps to 5.04% while 10-year and 30-year yields both finished 4bps higher at 4.33% and 4.42% respectively.

In terms of US Fed policy, expectations of a lower federal funds rate in the first half of 2024 softened. At the close of business, contracts implied the effective federal funds rate would average 5.33% in September, in line with the current spot rate, 5.405% in November and 5.425% in December. September 2024 contracts implied 4.945%, 39bps less than the current rate.

The same report includes US capacity utilisation figures which are generally accepted as an indicator of future investment expenditure and/or inflationary pressures. Capacity usage had hit a high for the last business cycle in early 2019 before it began a downtrend which ended with April 2020’s multi-decade low of 64.2%. August’s reading increased from July’s revised figure of 79.5% to 79.7%, slightly below the long-term average of 80.1%.

While the US utilisation rate’s correlation with the US jobless rate is solid, it is not as high as the comparable correlation in Australia.

Revisions take shine off strong US August retail report

14 September 2023

Summary: US retail sales up 0.6% in August, more than expected; annual growth rate slows to 2.5%; NAB: downward revisions take some shine off initially reported strength; Treasury yields up; 2024 rate-cut expectations soften; higher sales in nine of thirteen retail categories; gasoline station sales largest single influence on month’s result.

US retail sales had been trending up since late 2015 but, commencing in late 2018, a series of weak or negative monthly results led to a drop-off in the annual growth rate below 2.0%. Growth rates then increased in trend terms through 2019 and into early 2020 until pandemic restrictions sent it into negative territory. A “v-shaped” recovery then took place which was followed by some short-term spikes as federal stimulus payments hit US households in the first and second quarters of 2021.

According to the latest “advance” numbers released by the US Census Bureau, total retail sales increased by 0.6% in August. The result was considerably greater than the 0.1% increase which had been generally expected and slightly more than July’s 0.5% rise after it was revised down from 0.7%. However, on an annual basis, the growth rate slowed from July’s revised rate of 2.6% to 2.5%.

“Those downward revisions take some of the shine off the initially reported strength in the consumer through Q3,” said NAB economist Taylor Nugent, “but consumption is resilient and is still set to increase in Q3.”

US Treasury bond yields rose moderately on the day. By the close of business, 2-year and 10-year Treasury yields had both gained 4bps to 5.01% and 4.29% respectively while the 30-year yield finished 3bps higher at 4.38%.

In terms of US Fed policy, expectations of a lower federal funds rate in the first half of 2024 softened. At the close of business, contracts implied the effective federal funds rate would average 5.335% in September, slightly above the current spot rate, 5.42% in November and 5.435% in December. September 2024 contracts implied 4.915%, 42bps less than the current rate.

Nine of the thirteen categories recorded higher sales over the month. The “Gasoline stations” segment provided the largest single influence on the overall result, rising by 5.2% over the month and contributing 0.39 percentage points to the total.  

The non-store segment includes vending machine sales, door-to-door sales and mail-order sales but nowadays this segment has become dominated by online sales. It now accounts for nearly 17% of all US retail sales and it is the second-largest segment after vehicles and parts.

US August PPI higher than expected; core measure subdued

14 September 2023

Summary: US producer price index (PPI) up 0.7% in August, more than expected; annual rate increases to 1.6%; “core” PPI up 0.2%; ANZ: PPI ex energy very subdued, implies ongoing improvement; Treasury yields up; 2024 rate-cut expectations soften; goods prices up 2.0%, services prices up 0.2%.

Around the end of 2018, the annual inflation rate of the US producer price index (PPI) began a downtrend which continued through 2019. Months in which producer prices increased suggested the trend may have been coming to an end, only for it to continue, culminating in a plunge in April 2020. Figures returned to “normal” towards the end of that year but were well above the long-term average through 2021, 2022 and the first quarter of 2023.

The latest figures published by the Bureau of Labor Statistics indicate producer prices increased by 0.7% after seasonal adjustments in August. The result was greater than the 0.4% rise which had been generally expected as well as July’s 0.4% increase after it was revised up from 0.3%. On a 12-month basis, the rate of producer price inflation after seasonal adjustments and revisions accelerated from July’s revised figure of 0.9% to 1.6%.

Producer prices excluding foods and energy, or “core” PPI, increased by 0.2% after seasonal adjustments. The result was in line with expectations but half July’s 0.4%. The annual rate slowed from 2.4% to 2.1%.

“Outside of energy, the PPI rise was very subdued, implying ongoing improvement in underlying inflationary pressures,” said ANZ FX analyst Felix Ryan.

US Treasury bond yields rose moderately on the day. By the close of business, 2-year and 10-year Treasury yields had both gained 4bps to 5.01% and 4.29% respectively while the 30-year yield finished 3bps higher at 4.38%.

In terms of US Fed policy, expectations of a lower federal funds rate in the first half of 2024 softened. At the close of business, contracts implied the effective federal funds rate would average 5.335% in September, slightly above the current spot rate, 5.42% in November and 5.435% in December. September 2024 contracts implied 4.915%, 42bps less than the current rate.  

The BLS stated a 2.0% rise in final demand goods accounted for 80% of the overall increase. Prices of final demand services increased by 0.2%.

The producer price index is a measure of prices received by producers for domestically produced goods, services and construction. It is put together in a fashion similar to the consumer price index (CPI) except it measures prices received from the producer’s perspective rather than from the perspective of a retailer or a consumer. It is another one of the various measures of inflation tracked by the US Fed, along with core personal consumption expenditure (PCE) price data. 

US CPI up 0.6% in August; close to end of hiking cycle

13 September 2023

Summary: US CPI up 0.6% in August, slightly above expectations; “core” rate up 0.3%; NAB: trend on core CPI looking better at 2.4%; Treasury yields fall; rate-cut expectations unchanged; NAB: likely close to end of hiking cycle; ANZ: Fed will need to be alert to potential for any re-acceleration; energy prices main driver, adds 0.39 ppts.

The annual rate of US inflation as measured by changes in the consumer price index (CPI) halved from nearly 3% in the period from July 2018 to February 2019. It then fluctuated in a range from 1.5% to 2.0% through 2019 before rising above 2.0% in the final months of that year. Substantially lower rates were reported from March 2020 to May 2020 and they remained below 2% until March 2021. Rates have since risen significantly, although they have been declining since mid-2022.

The latest US CPI figures released by the Bureau of Labor Statistics indicated seasonally-adjusted consumer prices increased by 0.6% on average in August. The result was slightly above expectations of a 0.5% rise and considerably more than July’s 0.2% increase. On a 12-month basis, the inflation rate accelerated from 3.3% to 3.7%.

“Headline” inflation is known to be volatile and so references are often made to “core” inflation for analytical purposes. The core prices index, the index which excludes the more variable food and energy components, increased by 0.3% on a seasonally-adjusted basis over the month, greater than the 0.2% rise which had been generally expected. The annual growth rate slowed from 4.7% to 4.4%.

“In 3-month annualised terms the trend on core CPI is looking better at 2.4% and, when mapping to the Fed’s preferred PCE measure, it is likely running at 1.9%,” said Tapas Strickland, NAB Head of Market Economics.

US Treasury bond yields, with the exception of ultra-long yields, fell on the day. By the close of business, the 2-year Treasury yield had shed 5bps to 4.97%, the 10-year yield had lost 3bps to 4.25% while the 30-year yield finished unchanged at 4.35%.

In terms of US Fed policy, expectations of a lower federal funds rate in the first half of 2024 barely moved. At the close of business, contracts implied the effective federal funds rate would average 5.335% in September, slightly above the current spot rate, 5.435% in November and 5.45% in December. September 2024 contracts implied 4.88%, 45bps less than the current rate.                   

Strickland added there was “[n]othing then to dissuade the Fed that they are likely close to the end of the hiking cycle but [it] will still likely be wary about prematurely declaring inflation has slowed sufficiently given the headfakes in 2021 and 2022 which saw inflation reaccelerate after a couple of soft prints.”

ANZ rates strategist Gregorius Steven added a cautionary note. “However, the data suggest the Fed will need to be alert to the potential for any re-acceleration in inflation through the autumn. Services inflation, ex-shelter (super-core) rose 0.4%.”

The largest influence on headline results is often the change in fuel prices. Prices of “Energy commodities”, the segment which contains vehicle fuels, increased by 10.5% and contributed 0.39 percentage points to the total. Prices of non-energy services, the segment which includes actual and implied rents, also had a large effect on the total, adding 0.23 percentage points after increasing by 0.4% on average.

Click for more news