News

Euro-zone ind. production drops in July

13 September 2023

Summary: Euro-zone industrial production down 1.1% in July, worse than expected; down 2.2% on annual basis; annual growth rate decreases from -1.0% to -2.2%; German, French 10-year yields hardly move; output contracts in two of four largest euro economies.

Following a recession in 2009/2010 and the debt-crisis which flowed from it, euro-zone industrial production recovered and then reached a peak four years later in 2016. Growth rates then fluctuated for two years before beginning a steady and persistent slowdown from the start of 2018. That decline was transformed into a plunge in March and April of 2020 which then took over a year to claw back. Production levels in recent quarters have generally stagnated in trend terms.

According to the latest figures released by Eurostat, euro-zone industrial production contracted by 1.1% in July on a seasonally-adjusted and calendar-adjusted basis. The result was worse than the 0.9% contraction which had been generally expected and in contrast to June’s 0.5% rise. The calendar-adjusted contraction rate on an annual basis accelerated, from June’s revised rate of -1.0% to -2.2%.

German and French sovereign bond yields barely moved on the day. By the close of business, the German 10-year bond yield had returned to its starting point at 2.4% while the French 10-year bond yield finished 1bp higher at 3.19%.

Industrial production contracted in two of the euro-zone’s four largest economies. Germany’s production fell by 1.6% over the month while the comparable figures for France, Spain and Italy were +0.8%, +0.2% and -0.7% respectively.

Consumer sentiment down again in September, contrasts with business conditions

12 September 2023

Summary: Household sentiment declines again; mortgage holders’ confidence up, outright home owners’ and renters’ confidence down; NAB: total consumer spending quite high, many businesses enjoying relatively high levels of activity; three of five sub-indices lower; more respondents expecting higher jobless rate.

After a lengthy divergence between measures of consumer sentiment and business confidence in Australia which began in 2014, confidence readings of the two sectors converged again in mid-July 2018. Both measures then deteriorated gradually in trend terms, with consumer confidence leading the way. Household sentiment fell off a cliff in April 2020 but, after a few months of to-ing and fro-ing, it then staged a full recovery. However, consumer sentiment has deteriorated significantly over the past two years, while business sentiment has been more robust.

According to the latest Westpac-Melbourne Institute survey conducted in the first week of September, household sentiment has declined again.  Their Consumer Sentiment Index fell from August’s reading of 81.0 to 79.7, a reading which is well below the “normal” range and significantly lower than the long-term average reading of just over 101.

“Persistent pessimism has continued despite easing fears of further interest rate rises,” said Westpac Chief Economist Bill Evans. “This has seen a clear lift in the confidence of mortgage holders, up 7.8% in the latest month. However, this gain was more than offset by a 6.1% fall in the confidence of renters and a 5.8% fall in the confidence of consumers that own their home outright.”

Any reading of the Consumer Sentiment Index below 100 indicates the number of consumers who are pessimistic is greater than the number of consumers who are optimistic.

The report was released on the same day as the latest NAB Business Survey and Commonwealth Government bond yields moved slightly higher on the day. By the close of business, 3-year and 10-year ACGB yields had both inched up 1bp to 3.84% and 4.17% respectively while the 20-year yield finished 2bps higher at 4.51%.

In the cash futures market, expectations regarding further rate rises barely moved. At the end of the day, contracts implied the cash rate would change little from the current rate of 4.07% and average 4.08% through October, 4.13% in November and 4.15% in December. February 2024 contracts implied a 4.165% average cash rate and May 2024 contracts implied 4.145%, 7.5bps more than the current rate.     

Ray Attrill, NAB’s Head of FX Strategy (Markets), discussed the difference between weak consumer sentiment and robust business conditions. “In trying to reconcile the contrast, we might note that while consumer spending growth has slowed, in line with the ongoing hits to real incomes, such that there is a per capital recession, the level of consumer spending remains quite high. One way to reconcile this might be to note that inward migration is running very strong, such that many businesses are still enjoying relatively high levels of activity.”

Three of the five sub-indices registered lower readings, with the “Family finances versus a year ago” sub-index posting the largest monthly percentage loss.

The Unemployment Expectations index, formerly a useful guide to RBA rate changes, increased from 127.2 to 130.8. Higher readings result from more respondents expecting a higher unemployment rate in the year ahead.

“Broad-based uptick”; business conditions, confidence improves in August

12 September 2023

Summary: Business conditions improve in August; business less pessimistic, still below average; broad-based uptick in conditions across most industries; deep negatives in the retail sector; ANZ: continued strength in business community, inflation may prove hard to quash; capacity utilisation rate rises, at elevated level.

NAB’s business survey indicated Australian business conditions were robust in the first half of 2018, with a cyclical-peak reached in April of that year. Readings from NAB’s index then began to slip and forecasts of a slowdown in the domestic economy began to emerge in the first half of 2019 as the index trended lower. It hit a nadir in April 2020 as pandemic restrictions were introduced but then conditions improved markedly over the next twelve months.

According to NAB’s latest monthly business survey of around 500 firms conducted in last week-and-a-half of August, business conditions improved modestly, maintaining a level which is above average. NAB’s conditions index registered 13 points, up 2 points from July’s revised reading.

“Trading conditions, profitability and employment all rose, with a broad-based uptick in conditions across most industries,” said NAB senior economist Brody Viney.

Business confidence improved for a third consecutive month.  NAB’s confidence index rose from July’s revised reading of 1 point to 2 points, still below the long-term average.  Typically, NAB’s confidence index leads the conditions index by one month, although some divergences have appeared from time to time.

“The confidence and forward orders measures both edged up though they remain below average, weighed down by deep negatives in the retail sector,” Viney added. “Car retailing and personal & household goods have been driving this result, in part reflecting normalising order books as backlogs are cleared.”

The report was released on the same day as the latest Westpac-Melbourne Institute consumer sentiment survey and Commonwealth Government bond yields moved slightly higher on the day. By the close of business, 3-year and 10-year ACGB yields had both inched up 1bp to 3.84% and 4.17% respectively while the 20-year yield finished 2bps higher at 4.51%.

In the cash futures market, expectations regarding further rate rises barely moved. At the end of the day, contracts implied the cash rate would change little from the current rate of 4.07% and average 4.08% through October, 4.13% in November and 4.15% in December. February 2024 contracts implied a 4.165% average cash rate and May 2024 contracts implied 4.145%, 7.5bps more than the current rate.

ANZ economist Madeline Dunk generally took a positive view of the figures. “NAB’s August Business Survey shows continued strength in the business community, with conditions rising, capacity utilisation increasing and the survey’s inflation indicators still uncomfortably high.”

However, she also pointed to some not-so-positive aspects of the report. “While most of the survey’s price and cost measures declined after the July spike, they are well above June levels. The price indicators are in line with inflation printing just under 5%, suggesting inflation may prove hard to quash.”

NAB’s measure of national capacity utilisation increased from July’s revised reading of 84.7% to 85.1%, a historically-elevated level. Seven of the eight sectors of the economy were reported to be operating above their respective long-run averages, with only the transport & utilities sector operating slightly below average. Capacity utilisation is generally accepted as an indicator of future investment expenditure and it also has a strong inverse relationship with Australia’s unemployment rate.

August job ads index up again; to fade as the economy cools

04 September 2023

Summary: Job ads up 1.9% in August; 7.8% lower than August 2022; ANZ: index showing surprising resilience; ACGB yields up noticeably; rate-rise expectations soften slightly; ANZ: buoyancy of index to fade as the economy cools; ad index-to-workforce ratio rises to 1.00.

From mid-2017 onwards, year-on-year growth rates in the total number of Australian job advertisements consistently exceeded 10%. That was until mid-2018 when the annual growth rate fell back markedly. 2019 was notable for its reduced employment advertising and this trend continued into the first quarter of 2020. Advertising plunged in April and May of 2020 as pandemic restrictions took effect but then recovered quite quickly to historically-high levels.

According to the latest ANZ-Indeed figures, total advertisements rose by 1.9% in August on a seasonally adjusted basis. The result followed a 0.7% gain and a 2.5% loss in July and June respectively. On a 12-month basis, total job advertisements were 7.8% lower than in August 2022, up from July’s revised figure of -8.7%.

“ANZ-Indeed Australian Job Ads are showing surprising resilience, rising 2.6% over the last two months,” said ANZ economist Madeline Dunk.

The figures came out on the same day as the latest Melbourne Institute Inflation Gauge figures and Commonwealth Government bond yields rose noticeably, somewhat outpacing overnight movements of US Treasury yields. By the close of business, the 3-year ACGB yield had gained 7bps to 3.79% while 10-year and 20-year yields both finished 9bps higher at 4.09% and 4.44% respectively.

In the cash futures market, expectations regarding further rate rises softened slightly. At the end of the day, contracts implied the cash rate would remain steady at the current rate of 4.07% through September, move up to 4.09% in October and then average 4.135% in November. February 2024 contracts implied a 4.155% average cash rate and May 2024 contracts implied 4.125%, around 6bps more than the current rate.

“We expect the buoyancy in ANZ-Indeed Australian Job Ads to fade as the economy cools,” Dunk  added. “While the labour market remains very tight, the underemployment rate has risen from its recent low and the July Labour Force Survey showed an increase in the unemployment rate.”

The inverse relationship between job advertisements and the unemployment rate has been quite strong (see below chart), although ANZ themselves called the relationship between the two series into question in early 2019.  A higher job advertisement index as a proportion of the labour force is suggestive of lower unemployment rates in the near future while a lower ratio suggests higher unemployment rates will follow. August’s ad index-to-workforce ratio increased from 0.99 in July to 1.00 after revisions.

In 2008/2009, advertisements plummeted and Australia’s unemployment rate jumped from 4% to nearly 6% over a period of 15 months. When a more dramatic fall in advertisements took place in April 2020, the unemployment rate responded much more quickly.

Melb. Institute annual inflation rate picks up in August

04 September 2023

Summary: Melbourne Institute Inflation Gauge index up 0.2% in August; up 6.1% on annual basis; ACGB yields up noticeably; rate-rise expectations soften slightly.

The Melbourne Institute’s Inflation Gauge is an attempt to replicate the ABS consumer price index (CPI) on a monthly basis. It has turned out to be a reliable leading indicator of the CPI, although there are periods in which the Inflation Gauge and the CPI have diverged for as long as twelve months. On average, the Inflation Gauge’s annual rate tends to overestimate the ABS rate by around 0.1%, at least until recently.

The Melbourne Institute’s latest reading of its Inflation Gauge index indicates consumer prices increased by 0.2% in August, following increases of 0.8% and 0.1% in July and June respectively. The index rose by 6.1% on an annual basis, up from July’s comparable figure of 5.4%.

The figures came out on the same day as the latest ANZ-Indeed Job Ads survey and Commonwealth Government bond yields rose noticeably, somewhat outpacing overnight movements of US Treasury yields. By the close of business, the 3-year ACGB yield had gained 7bps to 3.79% while 10-year and 20-year yields both finished 9bps higher at 4.09% and 4.44% respectively.

In the cash futures market, expectations regarding further rate rises softened slightly. At the end of the day, contracts implied the cash rate would remain steady at the current rate of 4.07% through September, move up to 4.09% in October and then average 4.135% in November. February 2024 contracts implied a 4.155% average cash rate and May 2024 contracts implied 4.125%, around 6bps more than the current rate.

Central bankers desire a certain level of inflation which is “sufficiently low that it does not materially distort economic decisions in the community” but high enough so it does not constrain “a central bank’s ability to combat recessions.”

ISM PMI up again in August; further increases expected

01 September 2023

Summary: ISM PMI up in August, above expectations; NAB: further increases in index, overall growth expected in months ahead; long-term US Treasury yields noticeably higher; expectations of Fed rate cuts in first half of 2024 firm; ISM: reading corresponds to 0.4% US GDP contraction annualised.

The Institute of Supply Management (ISM) manufacturing Purchasing Managers Index (PMI) reached a cyclical peak in September 2017. It then started a downtrend which ended in March 2020 with a contraction in US manufacturing which lasted until June 2020. Subsequent month’s readings implied growth had resumed, with the index becoming stronger through to March 2021. Readings have since declined fairly steadily.

According to the ISM’s August survey, its PMI recorded a reading of 47.6%,  above the generally expected figure of 46.9% as well as July’s 46.4%. The average reading since 1948 is 53.0% and any reading below 50% implies a contraction in the US manufacturing sector relative to the previous month.

“While the ISM report indicates a ninth month of contraction, the index has turned higher over the past two months and, if the historical relationship between the difference between new orders and inventories holds, further increases in the headline ISM index and overall growth are expected in the months ahead,” said NAB economist Skye Masters.

The figures were released on the same day as the latest non-farm payrolls report and long-term US Treasury yields finished the day noticeably higher. By the close of business, the 2-year Treasury bond yields had inched up 1bp to 4.88%, the 10-year yield had gained 7bps to 4.18% while the 30-year yield finished 9bps higher at 4.30%.

In terms of US Fed policy, expectations of a lower federal funds rate in the first half of 2024 firmed. At the close of business, contracts implied the effective federal funds rate would average 5.335% in September, slightly above the current spot rate, and then average 5.345% in October. December futures contracts implied a 5.41% average effective federal funds rate while August 2024 contracts implied 4.77%, 56bps less than the current rate.

Purchasing managers’ indices (PMIs) are economic indicators derived from monthly surveys of executives in private-sector companies. They are diffusion indices, which means a reading of 50% represents no change from the previous period, while a reading under 50% implies respondents reported a deterioration on average. A reading “above 48.7%, over a period of time, generally indicates an expansion of the overall economy”, according to the ISM.

The ISM’s manufacturing PMI figures appear to lead US GDP by several months despite a considerable error in any given month. The chart below shows US GDP on a “year on year” basis (and not the BEA annualised basis) against US GDP implied by monthly PMI figures. 

According to the ISM and its analysis of past relationships between the PMI and US GDP, August’s PMI corresponds to an annualised contraction rate of 0.4%, or about 0.1% over a quarter. However, regression analysis on a year-on-year basis still suggests a 12-month GDP growth rate of 1.8% five months after this latest report.

The ISM index is one of two monthly US PMIs, the other being an index published by S&P Global. S&P Global produces a “flash” estimate in the last week of each month which comes out about a week before the ISM index is published. The S&P Global flash August manufacturing PMI registered 47.0%, 2.0 percentage points lower than July’s final figure.

July home loan approvals: construction-related, owner-occupier weakness

01 September 2023

Summary: Value of loan commitments down 1.2% in July, less than generally expected; 14.1% lower than July 2022; Westpac: weakness centred on construction-related owner-occupier lending; value of owner-occupier loan approvals down 1.9%; investor approvals down 0.1%; number of owner-occupier home loan approvals down 2.3%.

The number and value of home-loan approvals began to noticeably increase after the RBA reduced its cash rate target in a series of cuts beginning in mid-2019, potentially ending the downtrend which had been in place since mid-2017. Figures from February through to May of 2020 provided an indication the downtrend was still intact but subsequent figures then pushed both back to elevated levels in 2021. However, there has been a considerable pullback since then.

July’s housing finance figures have now been released and total loan approvals excluding refinancing declined by 1.2% In dollar terms over the month, a greater fall than the 0.5% decrease which had been generally expected and June’s 1.6% fall. On a year-on-year basis, total approvals excluding refinancing fell by 14.1%, up from the previous month’s comparable figure of -18.5%.

“The detail showed weakness centred on construction-related owner-occupier lending, with much milder declines for other segments,” said Westpac senior economist Matthew Hassan. “As such the picture is still consistent with the wider narrative of a gradual, price-led recovery in established markets but suggests there may be more weakness coming through around new building.”

The figures came out on the same day as the latest private credit figures and Commonwealth Government bond yields declined modestly. By the close of business, the 3-year ACGB yield had slipped 1bp to 3.72% while 10-year and 20-year yields both finished 2bps lower at 4.00% and 4.35% respectively.

In the cash futures market, expectations regarding further rate rises softened a touch. At the end of the day, contracts implied the cash rate would remain steady at the current rate of 4.07% through September, move up to 4.09% in October and then average 4.13% in November. February 2024 contracts implied a 4.145% average cash rate and May 2024 contracts implied 4.125%, around 6bps more than the current rate.

The total value of owner-occupier loan commitments excluding refinancing decreased by 1.9%, up from June’s 3.1% fall. On an annual basis, owner-occupier loan commitments were 17.5% lower than in July 2022, above June’s comparable figure of -20.1%.

The total value of investor commitments excluding refinancing arrangements slipped by 0.1%. The decline followed a 1.3% increase in June, slowing the contraction rate over the previous 12 months from 15.2% after revisions to 7.2%.

The total number of loan commitments to owner-occupiers excluding refinancing decreased by 2.3% to 24,645 on a seasonally adjusted basis. The fall was a smaller one than June’s 3.8% decrease and the annual contraction rate slowed from 16.9% to 15.9%.

Core PCE up 0.2% in July; services inflation “sticky”

31 August 2023

Summary: US core PCE price index up 0.2% in July, in line with expectations; annual rate ticks up from 4.1% to 4.2%; ANZ: services inflation “sticky”; short-term Treasury yields decline a little; Fed rate-cut expectations for 2024 firm.

One of the US Fed’s favoured measures of inflation is the change in the core personal consumption expenditures (PCE) price index. After hitting the Fed’s target at the time of 2.0% in mid-2018, the annual rate then hovered in a range between 1.8% and 2.0% before it eased back to a range between 1.5% and 1.8% through 2019. It then plummeted below 1.0% in April 2020 before rising back to around 1.5% in the September quarter of that year. It has since increased significantly and still remains above the Fed’s target even after recent declines.

The latest figures have now been published by the Bureau of Economic Analysis as part of the July personal income and expenditures report. Core PCE prices rose by 0.2% over the month, in line with expectations as well as June’s increase. On a 12-month basis, the core PCE inflation rate ticked up from June’s rate of 4.1% to 4.2%.

“The breakdown of the data…confirmed sticky services inflation,” said ANZ senior rate strategist Jack Chambers. “Core services inflation is proving slow to fall and argues in favour of the FOMC holding rates at elevated levels for an extended period.”

US Treasury bond yields declined a little on the day. By the close of business, the 2-year Treasury bond yield had slipped 1bp to 4.87%, the 10-year yield had returned to its starting point at 4.11% while the 30-year yield finished 1bp lower at 4.21%.

In terms of US Fed policy, expectations of a lower federal funds rate in 2024 firmed. At the close of business, contracts implied the effective federal funds rate would average 5.34% in September, slightly above the current spot rate, and then average 5.36% in October. December futures contracts implied a 5.43% average effective federal funds rate while August 2024 contracts implied 4.765%, 56bps less than the current rate.

The core version of PCE strips out energy and food components, which are volatile from month to month, in an attempt to identify the prevailing trend. It is not the only measure of inflation used by the Fed; the Fed also tracks the Consumer Price Index (CPI) and the Producer Price Index (PPI) from the Department of Labor. However, it is the one measure which is most often referred to in FOMC minutes.

Private credit up 0.2% in July; annual growth at 5.3%

31 August 2023

Summary: Private sector credit up 0.3% in July, in line with expectations; annual growth rate slows to 5.3%; Westpac: average monthly pace at 0.4%, mirrors housing market developments; UBS: slower trend since December 2022, will weaken further by end 2023; ACGB yields down moderately; rate-rise expectations soften; owner-occupier lending segment accounts for around 50% of net growth.

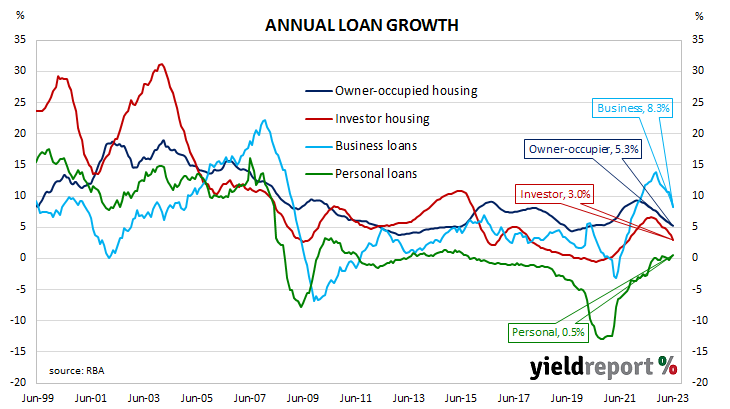
The pace of lending growth in the non-bank private sector by financial institutions in Australia followed a steady-but-gradual downtrend from late 2015 through to early 2020 before hitting what appears to be a nadir in March 2021. That downtrend ended later in that same year and annual growth rates shot up through 2022, peaking in September/October before easing over the first half of 2023.

According to the latest RBA figures, private sector credit increased by 0.3% in July. The result was in line with expectations as well as June’s result after it was revised up from 0.2%. On an annual basis, the growth rate slowed from June’s revised figure of 5.6% to 5.3%.

“In the 2023 year to date, the average monthly pace has held at 0.4%, albeit with some volatility month to month,” said Westpac senior economist Andrew Hanlan. “That stabilisation in the monthly pace mirrors developments in the housing market.”

The figures came out on the same day as June quarter capex figures and Commonwealth Government bond yields fell moderately across the curve. By the close of business, 3-year, 10-year and 20-year ACGB yield had all lost 5bps to 3.73%, 4.02% and 4.37% respectively.

In the cash futures market, expectations regarding further rate rises softened. At the end of the day, contracts implied the cash rate would barely change from the current rate of 4.07% and average 4.07% in September and 4.095% in October. February 2024 contracts implied a 4.175% average cash rate, as did May 2024 contracts, 11bps more than the current rate.

“Overall, credit growth has been on a slower trend since December 2022,” said UBS economist George Tharenou. “This is consistent with our long-held view, that continues to forecast housing, and total, credit growth will weaken further towards around 4% by the end of 2023.” 

Owner-occupier lending accounted for just over half of the net growth over the month, while lending in the business segment accounted for around 40%. Investor lending and personal lending both increased in net terms and accounted for the balance.

The traditional driver of overall loan growth, the owner-occupier segment, grew by 0.3% over the month, down from the 0.4% growth rates registered in the previous three months. The sector’s 12-month growth rate slowed again, this time from 5.3% to 5.1%.

Total lending in the non-financial business sector increased by 0.3%, up from 0.2% in the previous month after revisions. Growth on an annual basis slowed from 8.3% to 7.6%.

Monthly growth in the investor-lending segment slowed to a near-halt in early 2018 and essentially stayed that way until mid-2021. In July, net lending rose by 0.2%, the same rate as in the previous three months, taking the 12-month growth rate from 3.4% after revisions to 3.2%.

Total personal loans rose by 0.5%, up from 0.1% in June, taking the annual growth rate from 0.5% to 0.9%. This category of debt includes fixed-term loans for large personal expenditures, credit cards and other revolving credit facilities.

“Cooling US labour market”; ADP August report undershoots estimates

30 August 2023

Summary: ADP payrolls up 177,000 in August, less than consensus expectations; July revised down by 12,000; NAB: another piece of evidence of a cooling US labour market; positions up in small, medium and large businesses; little over 85% of gains in services sector, led by education/health services sector.

The ADP National Employment Report is a monthly report which provides an estimate of US non-farm workers in the private sector. Publishing of the report began in 2006 and its figures exhibited a high correlation with official non-farm payroll figures even though large differences arose in individual months. A major revamp of the ADP report took place in mid-2022, materially altering the data. However, month-on-month changes in the non-farm payroll data and ADP series are still highly correlated.

The latest ADP report indicated private sector employment increased by 177,000 in August, less than the 200,000 increase which had been generally expected. July’s rise was revised down by 12,000 to 312,000.

“For the record and ahead of the non-farm payrolls release on Friday, overnight the ADP employment data release provided yet another piece of evidence of a cooling US labour market,” said NAB senior FX strategist Rodrigo Catril.

US Treasury yields fell significantly on the day, especially at the short end of the curve. By the close of business, the 2-year had shed 15bps to 4.90%, the 10-year yield had lost 9bps to 4.12% while the 30-year yield finished 5bps lower at 4.23%.

In terms of US Fed policy, expectations of a lower federal funds rate in 2024 firmed. At the close of business, contracts implied the effective federal funds rate would average 5.34% in September, slightly above the current spot rate, and then average 5.355% in October. December futures contracts implied a 5.445% average effective federal funds rate while August 2024 contracts implied 4.795%, 53bps less than the current rate.

Employment numbers in net terms increased in small, medium-sized and large businesses. Firms with less than 50 employees gained a net 18,000 positions, mid-sized firms (50-499 employees) added 79,000 positions while large businesses (500 or more employees) accounted for 83,000 more positions.

Employment at service providers accounted for a little over 85% of the total net increase, or 154,000 positions. The “Education and health services” sector was the largest single source of gains, with 52,000 more positions. Total jobs among goods producers increased by a net 23,000 positions.

Prior to the ADP report, the consensus estimate of the change in August’s official non-farm employment figure was +168,000. The non-farm payroll report will be released by the Bureau of Labor Statistics this coming Friday night (AEST), 1 September.

Click for more news