News

“Weak, below-trend growth” expected into 2024: July Westpac-MI leading index

16 August 2023

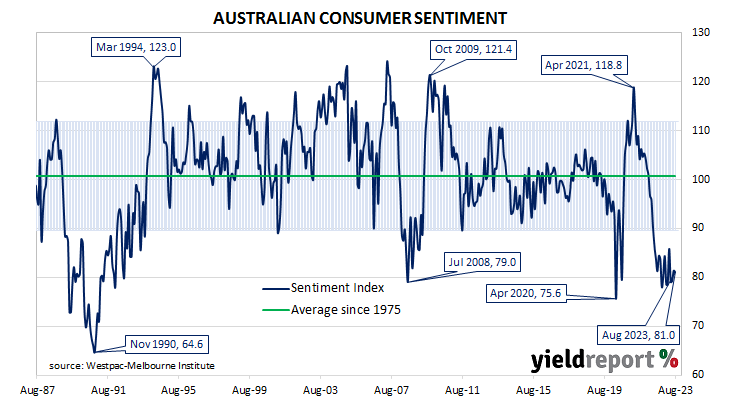
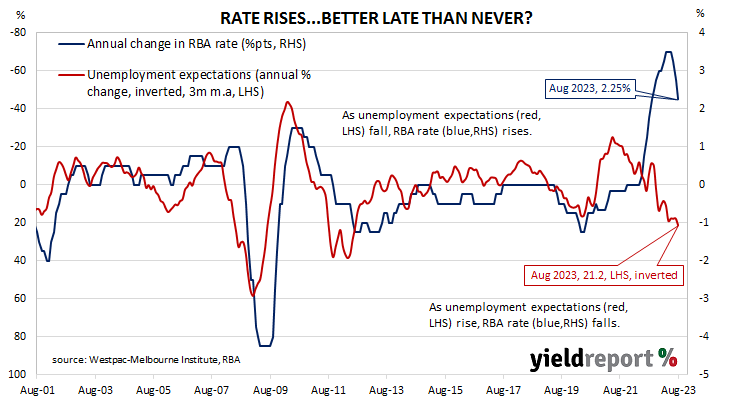
Summary: Leading index growth rate rises in July; weak, below-trend growth momentum will extend into 2024; reading implies annual GDP growth of around 2.15%; ACGB yields fall; rate-rise expectations ease; Westpac currently expects 1% GDP growth in calendar 2023, 1.4% in calendar 2024.

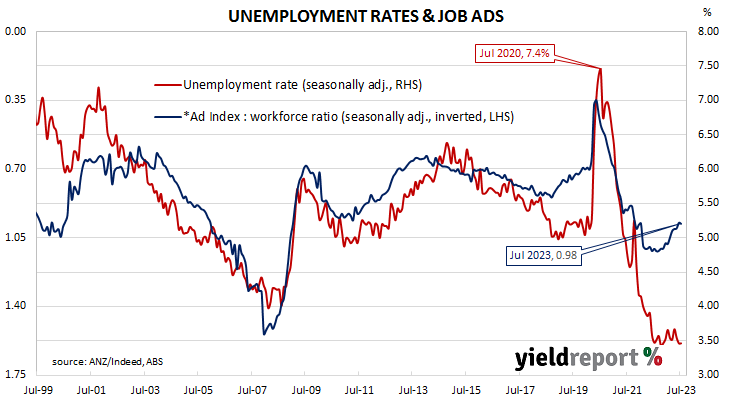
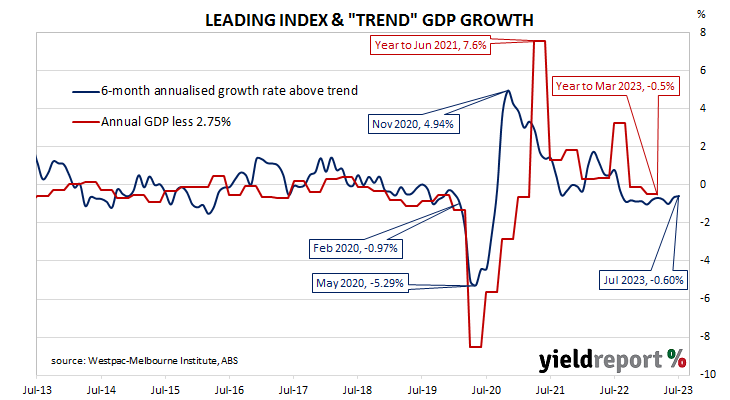
Westpac and the Melbourne Institute describe their Leading Index as a composite measure which attempts to estimate the likely pace of Australian economic growth in the short-term. After reaching a peak in early 2018, the index trended lower through 2018 and 2019 before plunging to recessionary levels in the second quarter of 2020. Subsequent readings spiked towards the end of 2020 but then trended lower through 2021, 2022 and the first half of 2023.

The July reading of the six month annualised growth rate of the indicator registered -0.60%, up from June’s revised figure of -0.67%.

“The July update is a clear indication that the weak, below-trend growth momentum we are seeing in 2023 will extend into 2024,” said Westpac senior economist Matthew Hassan.

Index figures represent rates relative to “trend” GDP growth, which is generally thought to be around 2.75% per annum in Australia. The index is said to lead GDP by “three to nine months into the future” but the highest correlation between the index and actual GDP figures occurs with a three-month lead. The current reading thus represents an annual GDP growth rate of around 2.15% in the next quarter.

Domestic Treasury bond yields fell on the day, ignoring modest rises of US Treasury bonds yields overnight. By the close of business, 3-year and 10-year ACGB yield had both lost 5bps to 3.91% and 4.21% respectively while the 20-year yield finished 3bps lower at 4.52%.

In the cash futures market, expectations regarding further rate rises eased. At the end of the day, contracts implied the cash rate would barely change from the current rate of 4.07% and average 4.08% in September and 4.12% in October. February 2024 contracts implied a 4.23% average cash rate while May 2024 contracts implied 4.22%, 15bps more than the current rate.

Hassan said Westpac expects GDP growth to be 1% in calendar 2023, rising to 1.4% in calendar 2024. The RBA’s August Statement on Monetary Policy forecasts GDP growth for the years ending December 2023 and December 2024 to be 1.0% and 1.75% respectively.

Strong US retail sales in July; 3-month average more than double pre-COVID rate

15 August 2023

Summary: US retail sales up 0.7% in July, more than expected; annual growth rate speeds up to 3.2%; ANZ: sub-category used for calculating GDP rises 1.0%; long-term Treasury yields rise; rate-cut expectations unchanged; NAB: possible shifts in timing of Amazon Prime Day playing havoc with seasonal adjustment process; higher sales in nine of thirteen retail categories; online segment again largest single influence on month’s result

US retail sales had been trending up since late 2015 but, commencing in late 2018, a series of weak or negative monthly results led to a drop-off in the annual growth rate below 2.0%. Growth rates then increased in trend terms through 2019 and into early 2020 until pandemic restrictions sent it into negative territory. A “v-shaped” recovery then took place which was followed by some short-term spikes as federal stimulus payments hit US households in the first and second quarters of 2021.

According to the latest “advance” numbers released by the US Census Bureau, total retail sales increased by 0.7% in July. The result was more than the 0.4% increase which had been generally expected as well as June’s 0.3% rise after it was revised up from 0.2%. On an annual basis, the growth rate sped up from June’s revised rate of 1.6% to 3.2%.

“Control group sales, a sub-category which is used in calculating GDP, rose 1.0% versus 0.5% in June and expectations of [a] 0.5% gain,” said ANZ economist Kishti Sen. “The 3-month average of control group sales is 0.7%, which is more than double the long run pre-COVID average of 0.3%”.

Long-term US Treasury bond yields increased on the day. By the close of business, the 2-year Treasury yield had returned to its starting point at 4.96% while 10-year and 30-year yields both finished 3bps higher at 4.22% and 4.32% respectively.

In terms of US Fed policy, expectations of a lower federal funds rate in the first half of 2024 barely changed. At the close of business, contracts implied the effective federal funds rate would average 5.34% in September, slightly above the current spot rate, and then average 5.355% in October. December futures contracts implied a 5.415% average effective federal funds rate while August 2024 contracts implied 4.78%, 55bps less than the current rate.

“It’s possible, some US data analysts note, that shifts in the timing of Amazon Prime Day is playing havoc with the seasonal adjustment process but that may be clutching at straws in looking for evidence that the US consumer has significantly slowed their spending habits,” observed NAB Head of FX Strategy Ray Attrill.

Nine of the thirteen categories recorded higher sales over the month. The “Non-store retailers” segment again provided the largest single influence on the overall result, rising by 1.9% over the month and contributing 0.31 percentage points to the total.  

The non-store segment includes vending machine sales, door-to-door sales and mail-order sales but nowadays this segment has become dominated by online sales. It now accounts for nearly 17% of all US retail sales and it is the second-largest segment after vehicles and parts.

U of M sentiment index slips in August; still substantial improvement on 3 months ago

11 August 2023

Summary: University of Michigan consumer confidence index deteriorates slightly, in line with expectations; views of present conditions improve, future conditions deteriorate; substantial improvements relative to 3 months ago; Treasury yields rise, especially at short end; 2024 rate-cut expectations soften.

US consumer confidence started 2020 at an elevated level but, after a few months, surveys began to reflect a growing unease with the global spread of COVID-19 and its reach into the US. Household confidence plunged in April 2020 and then recovered in a haphazard fashion, generally fluctuating at below-average levels according to the University of Michigan. The University’s measure of confidence had recovered back to the long-term average by April 2021 but then it plunged again in the September quarter and then remained at historically low levels through 2022 and first half of 2023.

The latest survey conducted by the University indicates confidence among US households has deteriorated slightly on average after improving in the previous two months. The preliminary reading of the Index of Consumer Sentiment registered 71.2 in August, essentially in line with expectations but down a touch from July’s final figure of 71.6. Consumers’ views of current conditions improved while their views of future conditions deteriorated relative to those held at the time of the July survey.

“In general, consumers perceived few material differences in the economic environment from last month but they saw substantial improvements relative to just three months ago,” said the University’s Surveys of Consumers Director Joanne Hsu.

US Treasury bond yields rose on the day, especially at the short end. By the close of business, the 2-year Treasury yield had gained 6bps to 4.89%, the 10-year yield had added 4bps to 4.15% while the 30-year yield finished 1bp higher at 4.26%.

In terms of US Fed policy, expectations of a lower federal funds rate in the first half of 2024 softened. At the close of business, contracts implied the effective federal funds rate would average 5.34% in September, slightly above the current spot rate, and then increase to an average of 5.355% in October. December futures contracts implied a 5.41% average effective federal funds rate while August 2024 contracts implied 4.695%, 64bps less than the current rate.

It was once thought less-confident households are generally inclined to spend less and save more; some decline in household spending could be expected to follow. However, recent research suggests the correlation between household confidence and retail spending is quite weak.

US July PPI result beats expectations, hints at reacceleration risk

11 August 2023

Summary: US producer price index (PPI) up 0.3% in July, more than expected; annual rate increases to 0.8%; “core” PPI up 0.3%; NAB: highlights sensitivity to reacceleration risk; Treasury yields rise, especially at short end; 2024 rate-cut expectations soften; services prices up 0.5%, goods prices up 0.1%.

Around the end of 2018, the annual inflation rate of the US producer price index (PPI) began a downtrend which continued through 2019. Months in which producer prices increased suggested the trend may have been coming to an end, only for it to continue, culminating in a plunge in April 2020. Figures returned to “normal” towards the end of that year but were well above the long-term average through 2021, 2022 and the first quarter of 2023.

The latest figures published by the Bureau of Labor Statistics indicate producer prices increased by 0.3% after seasonal adjustments in July. The result was more than the 0.2% rise which had been generally expected as well as June’s flat result after it was revised from 0.1%. On a 12-month basis, the rate of producer price inflation after seasonal adjustments and revisions accelerated from 0.3% in June to 0.8%.

Producer prices excluding foods and energy, or “core” PPI, also increased by 0.3% after seasonal adjustments. The result was also greater than expected 0.2% increase and in contrast with June’s 0.1% decline. The annual rate remained steady at 2.4%.

“A downward revision to the previous month also didn’t flatter the July outcome,” said NAB economist Taylor Nugent. “Nonetheless, with the market increasingly confident of a soft landing, the upside surprise does highlight sensitivity to the risk of reacceleration so long as labour markets remain tight and demand remains resilient.”

US Treasury bond yields rose on the day, especially at the short end. By the close of business, the 2-year Treasury yield had gained 6bps to 4.89%, the 10-year yield had added 4bps to 4.15% while the 30-year yield finished 1bp higher at 4.26%.

In terms of US Fed policy, expectations of a lower federal funds rate in the first half of 2024 softened. At the close of business, contracts implied the effective federal funds rate would average 5.34% in September, slightly above the current spot rate, and then increase to an average of 5.355% in October. December futures contracts implied a 5.41% average effective federal funds rate while August 2024 contracts implied 4.695%, 64bps less than the current rate.

The BLS stated a 0.5% rise in final demand services led the overall gain. Prices of final demand goods increased by 0.1%.

The producer price index is a measure of prices received by producers for domestically produced goods, services and construction. It is put together in a fashion similar to the consumer price index (CPI) except it measures prices received from the producer’s perspective rather than from the perspective of a retailer or a consumer. It is another one of the various measures of inflation tracked by the US Fed, along with core personal consumption expenditure (PCE) price data. 

US core services inflation “still sticky”; CPI up 0.2% in July

10 August 2023

Summary: US CPI up 0.2% in July, as expected; “core” rate up 0.2%; ANZ: core services inflation still sticky; Treasury yields rise; rate-cut expectations unchanged; NAB: super core” measures show “little tick-up”; non-energy services prices again main driver, adds 0.23 ppts.

The annual rate of US inflation as measured by changes in the consumer price index (CPI) halved from nearly 3% in the period from July 2018 to February 2019. It then fluctuated in a range from 1.5% to 2.0% through 2019 before rising above 2.0% in the final months of that year. Substantially lower rates were reported from March 2020 to May 2020 and they remained below 2% until March 2021. Rates have since risen significantly, although they have been declining since mid-2022.

The latest US CPI figures released by the Bureau of Labor Statistics indicated seasonally-adjusted consumer prices increased by 0.2% on average in July. The result was in line with expectations as well as June’s rise. However, on a 12-month basis, the inflation rate accelerated from 3.1% to 3.3%.

“Headline” inflation is known to be volatile and so references are often made to “core” inflation for analytical purposes. The core prices index, the index which excludes the more variable food and energy components, also increased by 0.2% on a seasonally-adjusted basis over the month, as expected. The annual growth rate slowed from 4.9% to 4.7%.

“All up, the July CPI report will likely be welcomed by the Fed,” said ANZ Head of FX Research Mahjabeen Zaman. “The slower pace of core inflation over the past two months is positive but core services inflation still looks sticky.”

US Treasury bond yields rose on the day, especially at the long end. By the close of business, the 2-year Treasury yield had added 3bps to 4.83%, the 10-year yield had gained 10bps to 4.11% while the 30-year yield finished 8bps higher at 4.25%.

In terms of US Fed policy, expectations of a lower federal funds rate in the first half of 2024 remained pretty stable. At the close of business, contracts implied the effective federal funds rate would average 5.335% in September, slightly above the current spot rate, and then increase to an average of 5.355% in October. December futures contracts implied a 5.39% average effective federal funds rate while August 2024 contracts implied 4.615%, 72bps less than the current rate.

 “Although some of the more tightly defined “super core” measures showed a little tick-up in price growth relative to prior months, the print has been widely received as giving the FOMC leeway to stay on hold at its September meeting,” said NAB senior interest-rate strategist Ken Crompton. The largest influence on headline results is often the change in fuel prices.

Prices of “Energy commodities”, the segment which contains vehicle fuels, increased by 0.3% and contributed 0.01 percentage points to the total. However, prices of non-energy services, the segment which includes actual and implied rents, again had the largest effect on the total, adding 0.23 percentage points after increasing by 0.4% on average.

The Federal Reserve Bank of New York publishes an unofficial estimate of underlying inflation, known as the Underlying Inflation Gauge (UIG) and it was updated shortly after these latest CPI figures. While the Federal Reserve states the UIG does not represent an official estimate, the UIG does appear to lead the core CPI measure. July’s UIG registered an annual rate of 3.0%, down from June’s figure of 3.2%.

Rate hold no panacea for households; sentiment slips in August

08 August 2023

Summary: Household sentiment slips a touch; muted response to RBA decision; sentiment declined further after RBA decision; Citi: result reflects optics of cash rate target above 4%; two of five sub-indices lower; fewer respondents expecting higher jobless rate.

After a lengthy divergence between measures of consumer sentiment and business confidence in Australia which began in 2014, confidence readings of the two sectors converged again in mid-July 2018. Both measures then deteriorated gradually in trend terms, with consumer confidence leading the way. Household sentiment fell off a cliff in April 2020 but, after a few months of to-ing and fro-ing, it then staged a full recovery. However, consumer sentiment has deteriorated significantly over the past two years, while business sentiment has been more robust.

According to the latest Westpac-Melbourne Institute survey conducted in the first week of August, household sentiment has slipped a touch after improving for two consecutive months.  Their Consumer Sentiment Index decreased from July’s reading of 81.3 to 81.0, a reading which is well below the “normal” range and significantly lower than the long-term average reading of just over 101.

“Sentiment continues to show only a muted response to the RBA Board’s decision to leave the cash rate on hold in recent meetings,” said Westpac senior economist Matthew Hassan. 

Any reading of the Consumer Sentiment Index below 100 indicates the number of consumers who are pessimistic is greater than the number of consumers who are optimistic.

The report was released on the same day as the latest NAB business survey and Commonwealth Government bond yields generally fell moderately on the day. By the close of business, the 3-year ACGB yield had lost 5bps to 3.72%, the 10-year yield had shed 6bps to 4.01% while the 20-year yield finished 1bp lower at 4.37%.

In the cash futures market, expectations regarding further rate rises softened. At the end of the day, contracts implied the cash rate would barely change from the current rate of 4.07% to average 4.08% in September and 4.11% in October. February 2024 contracts implied a 4.185% average cash rate while May 2024 contracts implied 4.15%, 8bps more than the current rate.        

“Responses showed no improvement over the course of survey week, sentiment instead declining 4.9% between those surveyed prior to the RBA decision and those surveyed after,” Hassan added. He also noted mortgage-holder sentiment continued to worsen.

Citi economist Josh Williamson expanded on this point. “Our interpretation of household sentiment failing to bounce this time around reflects the optics of have the cash rate target above 4%. In other words, the level of official interest rates appears adequate to contain consumer expectations and associated metrics on finances and major purchases.”

Two of the five sub-indices registered lower readings, with the “Economic conditions – next 12 months” sub-index posting the largest monthly percentage loss.

The Unemployment Expectations index, formerly a useful guide to RBA rate changes, declined from 131.2 to 127.2. Lower readings result from more respondents expecting a lower unemployment rate in the year ahead.

July business conditions “resilient”, price pressures rise

08 August 2023

Summary: Business conditions slip in July; business less pessimistic, still below average; conditions resilient, challenges expectations economy would continue to cool; Westpac: provides further confirmation of trend cooling, price pressures lifting; capacity utilisation rate rises, at elevated level.

NAB’s business survey indicated Australian business conditions were robust in the first half of 2018, with a cyclical-peak reached in April of that year. Readings from NAB’s index then began to slip and forecasts of a slowdown in the domestic economy began to emerge in the first half of 2019 as the index trended lower. It hit a nadir in April 2020 as pandemic restrictions were introduced but then conditions improved markedly over the next twelve months.

According to NAB’s latest monthly business survey of around 400 firms conducted in last week-and-a-half of July, business conditions slipped slightly to a level which is still slightly above average. NAB’s conditions index registered 10 points, down from June’s revised reading of 11 points.

Business confidence improved for a second consecutive month.  NAB’s confidence index rose from June’s revised reading of 1 point to 2 points, still below the long-term average.  Typically, NAB’s confidence index leads the conditions index by one month, although some divergences have appeared from time to time.

“Business conditions stayed resilient in July and inflation-related measures rose, challenging expectations that the economy would continue to cool as 2023 wears on,” said NAB Chief Economist Alan Oster.

The report was released on the same day as the latest Westpac-Melbourne Institute consumer sentiment survey and Commonwealth Government bond yields generally fell moderately on the day. By the close of business, the 3-year ACGB yield had lost 5bps to 3.72%, the 10-year yield had shed 6bps to 4.01% while the 20-year yield finished 1bp lower at 4.37%.

In the cash futures market, expectations regarding further rate rises softened. At the end of the day, contracts implied the cash rate would barely change from the current rate of 4.07% to average 4.08% in September and 4.11% in October. February 2024 contracts implied a 4.185% average cash rate while May 2024 contracts implied 4.15%, 8bps more than the current rate.                                                                        

Westpac senior economist Andrew Hanlan’s view was not quite as positive as NAB’s Oster. “The latest private business survey provided further confirmation of a trend cooling of business conditions, that business confidence is soft and fragile and that forward orders are contracting.” However, as with Oster, he also noted the report’s inflation-related aspects. “On the price front, July readings lifted across labour costs, purchase costs and prices, both final product and retail.”

NAB’s measure of national capacity utilisation increased from June’s revised reading of 83.6% to 84.5%, a historically-elevated level. All eight sectors of the economy were reported to be operating above their respective long-run averages.

Capacity utilisation is generally accepted as an indicator of future investment expenditure and it also has a strong inverse relationship with Australia’s unemployment rate.

July job ads index lift likely “a blip”

06 August 2023

Summary: Job ads up 0.5% in July; 8.8% lower than July 2022; July lift likely a blip; ACGB yields down considerably following large US falls; rate-change expectations barely move; other signs labour market momentum starting to slow; ad index-to-workforce ratio rises to 0.98.

From mid-2017 onwards, year-on-year growth rates in the total number of Australian job advertisements consistently exceeded 10%. That was until mid-2018 when the annual growth rate fell back markedly. 2019 was notable for its reduced employment advertising and this trend continued into the first quarter of 2020. Advertising plunged in April and May of 2020 as pandemic restrictions took effect but then recovered quite quickly to historically-high levels.

According to the latest ANZ-Indeed figures, total advertisements rose by 0.5% in July on a seasonally adjusted basis. The result followed a 2.7% loss and a 0.1% gain in June and May respectively. On a 12-month basis, total job advertisements were 8.8% lower than in July 2022, up from June’s revised figure of -10.3%.

“ANZ-Indeed Australian Job Ads rose a touch in July,” said ANZ economist Madeline Dunk. “But the series has fallen 2.1% over the past three months, suggesting the July lift is likely to be a blip.”

Commonwealth Government bond yields fell considerably on the day, largely following movements of US Treasury yields overnight. By the close of business, the 3-year ACGB yields had shed 10bps to 3.77% while 10-year and 20-year yields both finished 12bps lower at 4.07% and 4.38% respectively.

In the cash futures market, expectations regarding further rate changes hardly changed. At the end of the day, contracts implied the cash rate would rise from the current rate of 4.07% to average 4.085% in September and then to 4.115% in October. February 2024 contracts implied a 4.20% average cash rate while May 2024 contracts implied 4.175%, around 10bps more than the current rate.

Dunk also noted “other signs labour market momentum is starting to slow as the RBA’s 400bps of hikes flow through to economic activity”. She pointed to NAB’s June quarter Business Survey and the smaller proportion of firms which had had reported labour as a constraint on output.

The inverse relationship between job advertisements and the unemployment rate has been quite strong (see below chart), although ANZ themselves called the relationship between the two series into question in early 2019.  A lower job advertisement index as a proportion of the labour force is suggestive of higher unemployment rates in the near future while a rising ratio suggests lower unemployment rates will follow. July’s ad index-to-workforce ratio increased from 0.97 in June to 0.98 after revisions.

In 2008/2009, advertisements plummeted and Australia’s unemployment rate jumped from 4% to nearly 6% over a period of 15 months. When a more dramatic fall in advertisements took place in April 2020, the unemployment rate responded much more quickly.

July non-farm payrolls as expected; “a clear downward trend”

04 August 2023

Summary: Non-farm payrolls up 187,000 in July, in line with expectations; previous two months’ figures revised down by 49,000; jobless rate ticks down to 3.5%, participation rate steady; ANZ: private payrolls growth has clear downward trend; employed-to-population ratio ticks up to 60.4%; underutilisation rate down; annual hourly pay growth steady at 4.4%.

The US economy ceased producing jobs in net terms as infection controls began to be implemented in March 2020. The unemployment rate had been around 3.5% but that changed as job losses began to surge through March and April of 2020. The May 2020 non-farm employment report represented a turning point and subsequent months provided substantial employment gains which continued through into 2021 and 2022. Changes in recent months have been generally more in line with the average of the last decade.

According to the US Bureau of Labor Statistics, the US economy created an additional 187,000 jobs in the non-farm sector in July. The increase was essentially in line with the 190,000 which had been generally expected and the 185,000 jobs which had been added in June after revisions. Employment figures for May and June were revised down by a total of 49,000.

The total number of unemployed decreased by 116,000 to 5.841 million while the total number of people who were either employed or looking for work increased by 152,000 to 167.103 million. These changes led to the US unemployment rate ticking down from June’s figure of 3.6% to 3.5% as the participation rate remained steady at 62.6%.

“Private payrolls growth has a clear downward trend, particularly in leisure/hospitality, manufacturing and temporary hiring,” said ANZ senior economist Adelaide Timbrell.

Shorter-term US Treasury yields fell noticeably on the day. By the close of business, the 2-year yield had shed 10bps to 4.78%, the 10-year yield had lost 14bps to 4.04% while the 30-year yield finished 10bps lower at 4.20%.

In terms of US Fed policy, expectations of a lower federal funds rate in the first half of 2024 hardened. At the close of business, contracts implied the effective federal funds rate would average 5.34% in September, slightly above the current spot rate, and then increase to an average of 5.36% in October. December futures contracts implied a 5.385% average effective federal funds rate while August 2024 contracts implied 4.585%, 74bps less than the current rate.

One figure which is indicative of the “spare capacity” of the US employment market is the employment-to-population ratio. This ratio is simply the number of people in work divided by the total US population. It hit a cyclical-low of 58.2 in October 2010 before slowly recovering to just above 61% in late-2019. July’s reading ticked up to 60.4%, still some way from the April 2000 peak reading of 64.7%.

Apart from the unemployment rate, another measure of tightness in the labour market is the underutilisation rate and the latest reading of it registered 6.7%, down from 6.9% in June. Wage inflation and the underutilisation rate usually have an inverse relationship and hourly pay growth in the year to July remained steady revisions at 4.4%.

Another bumper ADP job report; non-farm payroll doubts remain

02 August 2023

Summary: ADP payrolls up 324,000 in July, considerably more than consensus expectations; June revised down by 42,000; slowdown in pay growth without broad-based job loss; NAB: report suggests upside risks to July NFP result although a poor indicator; positions up in small and medium businesses, down in large ones;  little under 95% of gains in services sector, led by leisure/hospitality sector.

The ADP National Employment Report is a monthly report which provides an estimate of US non-farm workers in the private sector. Publishing of the report began in 2006 and its figures exhibited a high correlation with official non-farm payroll figures even though large differences arose in individual months. A major revamp of the ADP report took place in mid-2022, materially altering the data. However, month-on-month changes in the non-farm payroll data and ADP series are still highly correlated.

The latest ADP report indicated private sector employment increased by 324,000 in July, considerably more than the 185,000 increase which had been generally expected. June’s rise was revised down by 42,000 to 455,000.

“The economy is doing better than expected and a healthy labour market continues to support household spending,” said ADP Chief Economist Nela Richardson. “We continue to see a slowdown in pay growth without broad-based job loss.”

US Treasury yields generally moved higher on the day, although short-term yields declined. By the close of business, the 2-year had lost 2bps to 4.89%, the 10-year yield had gained 6bps to 4.09% while the 30-year yield finished 9bps higher at 4.18%.

In terms of US Fed policy, expectations of a lower federal funds rate in the first half of 2024 softened a touch. At the close of business, contracts implied the effective federal funds rate would average 5.345% in September, slightly above the current spot rate, and then increase to an average of 5.375% in October. December futures contracts implied a 5.39% average effective federal funds rate while August 2024 contracts implied 4.67%, 66bps less than the current rate.

Tapas Strickland, NAB Head of Market Economics said the report “suggests upside risks to Friday’s Payrolls” while also acknowledging “these figures are a poor indicator of official payrolls…”

Employment numbers in net terms increased at small and medium-sized businesses while contracting large enterprises. Firms with less than 50 employees gained a net 237,000 positions, mid-sized firms (50-499 employees) added 138,000 positions while large businesses (500 or more employees) accounted for 67,000 fewer employees.

Employment at service providers accounted for a little under 95% of the total net increase, or 303,000 positions. The “Leisure and hospitality” sector again was the largest single source of gains, with 201,000 more positions. Total jobs among goods producers increased by a net 21,000 positions.

Prior to the ADP report, the consensus estimate of the change in July’s official non-farm employment figure was +190,000. The non-farm payroll report will be released by the Bureau of Labor Statistics this coming Friday night (AEST), 4 August.

Click for more news