News

US quit rate continues downtrend; slower wage growth expected

01 August 2023

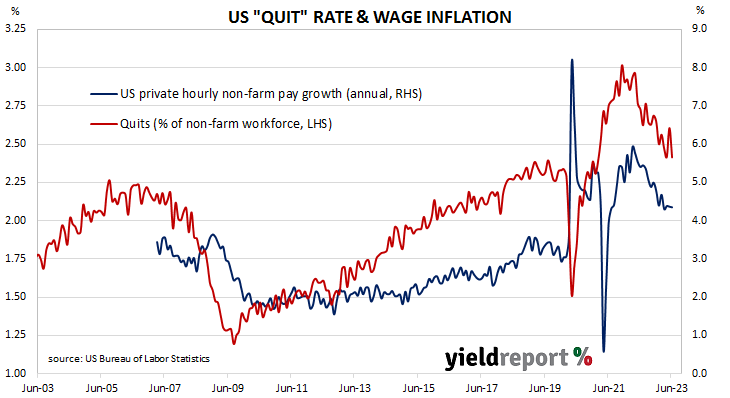
Summary: US quit rate falls to 2.4% in June; NAB: supports thesis wage disinflation achievable without outright job losses; US Treasury yields rise noticeably; expectations of Fed rate cuts in 2024 soften slightly; quits, separations, openings all down.

The number of US employees who quit their jobs as a percentage of total employment increased slowly but steadily after the GFC. It peaked in March 2019 and then tracked sideways until virus containment measures were introduced in March 2020. The quit rate then plummeted as alternative employment opportunities rapidly dried up. Following the easing of US pandemic restrictions, it proceeded to recover back to its pre-pandemic rate in the third quarter of 2020 and trended higher through 2021 before easing through 2022 and early 2023.

Figures released as part of the latest Job Openings and Labor Turnover Survey (JOLTS) report show the quit rate fell in June, maintaining its recent downtrend. 2.4% of the non-farm workforce left their jobs voluntarily, down from 2.6% in May. Quits in the month fell by 295,000 while an additional 209,000 people were employed in non-farm sectors.

“The JOLTS data supports Fed Governor Christopher Waller’s thesis that wage disinflation can be achieved without outright job losses,” said NAB senior FX strategist Rodrigo Catril.

The figures were released on the same day as the latest ISM PMI report and US Treasury yields finished the day noticeably higher. By the close of business, the 2-year Treasury bond yields had added 6bps to 4.91%, the 10-year yield had gained 7bps to 4.03% while the 30-year yield finished 8bps higher at 4.09%.

In terms of US Fed policy, expectations of a lower federal funds rate in the first half of 2024 softened a touch. At the close of business, contracts implied the effective federal funds rate would average 5.33% in August, in line with the current spot rate, and then increase to an average of 5.345% in September. December futures contracts implied a 5.40% average effective federal funds rate while July 2024 contracts implied 4.905%, 42bps less than the current rate.

The fall in total quits was led by 95,000 fewer resignations in the “Retail trade” sector while the “Arts, entertainment, and recreation” sector experienced the largest gain, increasing by 20,000. Overall, the total number of quits for the month fell from May’s revised figure of 4.067 million to 3.772 million.

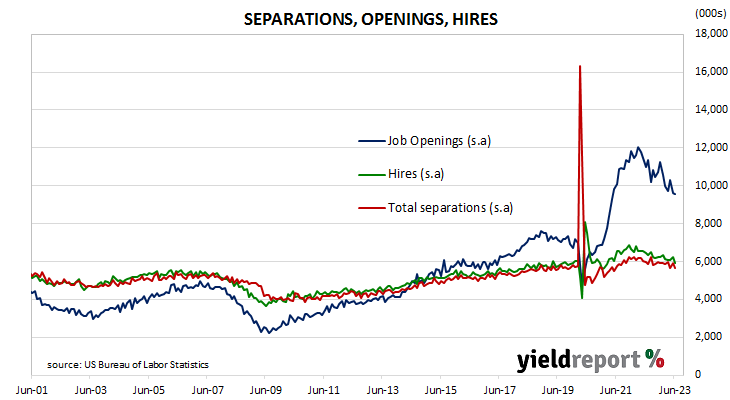
Total vacancies at the end of June declined by 34,000, or 0.4%, from May’s revised figure of 9.616 million to 9.582 million. The fall was driven by a 98,000 loss in the “Accommodation and food services” sector while the “Health care and social assistance” sector experienced the single largest increase, rising by 136,000. Overall, 11 out of 18 sectors experienced fewer job openings than in the previous month.  

Total separations decreased by 288,000, or 4.9%, from May’s revised figure of 5.925 million to 5.637 million. The fall was led by the “Retail trade” sector where there were 134,000 fewer separations than in May. Separations increased in 13 of the 18 sectors.

The “quit” rate time series produced by the JOLTS report is a leading indicator of US hourly pay. As wages account for around 55% of a product’s or service’s price in the US, wage inflation and overall inflation rates tend to be closely related. Former Federal Reserve chief and current Treasury Secretary Janet Yellen was known to pay close attention to it.

“Marginally slower rate of contraction”; ISM PMI up a touch in July

01 August 2023

Summary: ISM PMI up in July, below expectations; marginally slower rate of contraction; US Treasury yields rise noticeably; expectations of Fed rate cuts in 2024 soften slightly; ANZ: manufacturing struggling, upstream goods inflation soft; ISM: reading corresponds to 0.8% US GDP contraction annualised.

The Institute of Supply Management (ISM) manufacturing Purchasing Managers Index (PMI) reached a cyclical peak in September 2017. It then started a downtrend which ended in March 2020 with a contraction in US manufacturing which lasted until June 2020. Subsequent month’s readings implied growth had resumed, with the index becoming stronger through to March 2021. Readings have since declined fairly steadily.

According to the ISM’s July survey, its PMI recorded a reading of 46.0%,  below the generally expected figure of 46.9% but up slightly from June’s 46.0%. The average reading since 1948 is 53.0% and any reading below 50% implies a contraction in the US manufacturing sector relative to the previous month.

“The US manufacturing sector shrank again but the uptick in the PMI indicates a marginally slower rate of contraction,” said Timothy Fiore, Chair of the ISM’s Manufacturing Business Survey Committee.

The figures were released on the same day as the latest JOLTS report and US Treasury yields finished the day noticeably higher. By the close of business, the 2-year Treasury bond yields had added 6bps to 4.91%, the 10-year yield had gained 7bps to 4.03% while the 30-year yield finished 8bps higher at 4.09%.

In terms of US Fed policy, expectations of a lower federal funds rate in the first half of 2024 softened a touch. At the close of business, contracts implied the effective federal funds rate would average 5.33% in August, in line with the current spot rate, and then increase to an average of 5.345% in September. December futures contracts implied a 5.40% average effective federal funds rate while July 2024 contracts implied 4.905%, 42bps less than the current rate.

“All in all, these data suggest manufacturing continues to struggle and that upstream goods inflation remains soft,” said ANZ economist Kishti Sen.

Purchasing managers’ indices (PMIs) are economic indicators derived from monthly surveys of executives in private-sector companies. They are diffusion indices, which means a reading of 50% represents no change from the previous period, while a reading under 50% implies respondents reported a deterioration on average. A reading “above 48.7%, over a period of time, generally indicates an expansion of the overall economy”, according to the ISM.    

The ISM’s manufacturing PMI figures appear to lead US GDP by several months despite a considerable error in any given month. The chart below shows US GDP on a “year on year” basis (and not the BEA annualised basis) against US GDP implied by monthly PMI figures. 

According to the ISM and its analysis of past relationships between the PMI and US GDP, July’s PMI corresponds to an annualised contraction rate of 0.8%, or about 0.2% over a quarter. However, regression analysis on a year-on-year basis still suggests a 12-month GDP growth rate of 1.5% five months after this latest report.

The ISM index is one of two monthly US PMIs, the other being an index published by S&P Global. S&P Global produces a “flash” estimate in the last week of each month which comes out about a week before the ISM index is published. The S&P Global flash July manufacturing PMI registered 49.0%, 2.7 percentage points higher than June’s final figure.

June home approvals down; apartments drop after May spike

01 August 2023

Summary: Home approval numbers down 7.7% in June, in line with expectations; 18.0% lower than June 2022; Westpac: dwelling approvals tracking a flattening underlying trend at weak levels; house approvals down 0.8%, apartments down 16.2%; non-residential approvals up 7.6% in dollar terms, residential alterations down 0.3%.

Building approvals for dwellings, that is apartments and houses, headed south after mid-2018. As an indicator of investor confidence, falling approvals had presented a worrying signal, not just for the building sector but for the overall economy. However, approval figures from late-2019 and the early months of 2020 painted a picture of a recovery taking place, even as late as April of that year. Subsequent months’ figures then trended sharply upwards before falling back in 2021 and 2022.

The Australian Bureau of Statistics has released the latest figures from June which show total residential approvals fell by 7.7% on a seasonally-adjusted basis. The result was essentially in line with the 8.0% drop which had been generally expected but it also contrasted with May’s 20.5% rise after revisions. Total approvals fell by 18.0% on an annual basis, down from the previous month’s figure of -9.8%. Monthly growth rates are often volatile.

“The June update provides further confirmation of dwelling approvals tracking a flattening underlying trend at weak levels, albeit complicated by high-rise volatility,” said Westpac economist Ryan Wells.

The figures came out on the same day as the latest home finance approval figures and the August RBA Board meeting. Commonwealth Government bond yields fell noticeably and, by the close of business, the 3-year ACGB yield had shed 12bps to 3.74% while 10-year and 20-year yields both finished 9bps lower at 3.97% and 4.27% respectively.

In the cash futures market, expectations regarding further rate rises softened. At the end of the day, contracts implied the cash rate would rise from the current rate of 4.07% to average 4.105% in September and then to 4.145% in October. February 2024 contracts implied a 4.22% average cash rate and May 2024 contracts implied 4.195%, around 12bps more than the current rate.

Approvals for new houses slipped by 0.8% over the month, a turnaround from May’s 0.2% rise. On a 12-month basis, house approvals were 16.9% lower than they were in June 2022, down from May’s comparable figure of -15.2%.                                

Apartment approval figures are usually a lot more volatile and June’s total fell by 16.2% after a 60.1% jump in May. The 12-month growth rate fell from May’s revised rate of -2.4% to -19.6%.

Non-residential approvals increased by 7.6% in dollar terms over the month and were 46.6% higher on an annual basis. Figures in this segment also tend to be rather volatile.

Residential alteration approvals declined by 0.3% in dollar terms over the month but were 1.7% higher than in June 2022.

Home loan approvals slip in June but “clear up-trend”

01 August 2023

Summary: Value of loan commitments down 1.0% in June, contrasts with expected gain; 18.2% lower than June 2022; Westpac: clear up-trend led by prices, volumes relatively flat; UBS: trend implies housing/total credit growth will ease a bit further; value of owner-occupier loan approvals down 2.8%; investor approvals up 2.6%; number of owner-occupier home loan approvals down 3.0%.

The number and value of home-loan approvals began to noticeably increase after the RBA reduced its cash rate target in a series of cuts beginning in mid-2019, potentially ending the downtrend which had been in place since mid-2017. Figures from February through to May of 2020 provided an indication the downtrend was still intact but subsequent figures then pushed both back to elevated levels in 2021. However, there has been a considerable pullback since then.

June’s housing finance figures have now been released and total loan approvals excluding refinancing declined by 1.0% In dollar terms over the month, as opposed to the 1.8% increase which had been generally expected and May’s 5.4% rise. On a year-on-year basis, total approvals excluding refinancing fell by 18.2%, up from the previous month’s comparable figure of -20.5%.

“Despite the dip, approvals remain on a clear up-trend, having risen 7.6% from their February low,” said Westpac senior economist Matthew Hassan. “However, that gain is being led by prices with volumes still relatively flat to date.”

The figures came out on the same day as the latest dwelling approval figures and the August RBA Board meeting. Commonwealth Government bond yields fell noticeably and, by the close of business, the 3-year ACGB yield had shed 12bps to 3.74% while 10-year and 20-year yields both finished 9bps lower at 3.97% and 4.27% respectively.

In the cash futures market, expectations regarding further rate rises softened. At the end of the day, contracts implied the cash rate would rise from the current rate of 4.07% to average 4.105% in September and then to 4.145% in October. February 2024 contracts implied a 4.22% average cash rate and May 2024 contracts implied 4.195%, around 12bps more than the current rate.

UBS economist George Tharenou generally agreed with his Westpac counterpart. “The trend over recent months is still rising moderately and is consistent with home prices rising but [it] still implies housing (and total) credit growth will ease a bit further over coming months towards around 4% year-on-year.”

The total value of owner-occupier loan commitments excluding refinancing decreased by 2.8%, a turnaround from May’s 5.1% rise. On an annual basis, owner-occupier loan commitments were 19.9% lower than in June 2022, above May’s comparable figure of -20.2%.

The total value of investor commitments excluding refinancing arrangements increased by 2.6%. The rise followed a 5.9% increase in May, slowing the contraction rate over the previous 12 months from 21.1% after revisions to 15.0%.

The total number of loan commitments to owner-occupiers excluding refinancing decreased by 3.0% to 25,412 on a seasonally adjusted basis. The fall contrasted with May’s 5.6% increase and the annual contraction rate ticked up from 16.2% to 16.3%.

Private inflation index jumps in July; annual rate slows to 5.4%

31 July 2023

Summary: Melbourne Institute Inflation Gauge index up 0.8% in July; up 5.4% on annual basis; ACGB yields down modestly; rate-rise expectations firm slightly.

The Melbourne Institute’s Inflation Gauge is an attempt to replicate the ABS consumer price index (CPI) on a monthly basis. It has turned out to be a reliable leading indicator of the CPI, although there are periods in which the Inflation Gauge and the CPI have diverged for as long as twelve months. On average, the Inflation Gauge’s annual rate tends to overestimate the ABS rate by around 0.1%, at least until recently.

The Melbourne Institute’s latest reading of its Inflation Gauge index indicates consumer prices increased by 0.8% in July, following increases of 0.1% and 0.9% in June and May respectively. The index rose by 5.4% on an annual basis, down from June’s comparable figure of 5.7%.

The figures came out on the same day as the latest private credit figures and Commonwealth Government bond yields fell modestly. By the close of business, the 3-year ACGB yield had lost 2bps to 3.86%, the 10-year yield had slipped 1bp to 4.06% while the 20-year yield finished unchanged at 4.36%.

In the cash futures market, expectations regarding further rate rises firmed a touch. At the end of the day, contracts implied the cash rate would rise from the current rate of 4.07% to average 4.135% in August and then to 4.175% in September. February 2024 contracts implied a 4.315% average cash rate and May 2024 contracts implied 4.31%, both around 24bps more than the current rate.

Central bankers desire a certain level of inflation which is “sufficiently low that it does not materially distort economic decisions in the community” but high enough so it does not constrain “a central bank’s ability to combat recessions.”

A “soft” update; private credit up just 0.2% in June

31 July 2023

Summary: Private sector credit up 0.2% in June, less than expected; annual growth rate slows to 5.5%; Westpac: a “soft” update; ACGB yields down modestly; rate-rise expectations firm slightly; owner-occupier lending segment accounts for 80% of net growth.

The pace of lending growth in the non-bank private sector by financial institutions in Australia followed a steady-but-gradual downtrend from late 2015 through to early 2020 before hitting what appears to be a nadir in March 2021. That downtrend ended later in that same year and annual growth rates shot up through 2022, peaking in September/October.

According to the latest RBA figures, private sector credit increased by 0.2% in June. The result was less than the 0.4% which had been generally expected as well as May’s 0.4% rise. On an annual basis, the growth rate slowed from 6.2% to 5.5%.

“The June update for credit was a soft one,” said Westpac senior economist Andrew Hanlan. “The shift was centred on business and investor housing.”

The figures came out on the same day as the latest Westpac-Melbourne Institute Inflation Gauge numbers and Commonwealth Government bond yields fell modestly. By the close of business, the 3-year ACGB yield had lost 2bps to 3.86%, the 10-year yield had slipped 1bp to 4.06% while the 20-year yield finished unchanged at 4.36%.

In the cash futures market, expectations regarding further rate rises firmed a touch. At the end of the day, contracts implied the cash rate would rise from the current rate of 4.07% to average 4.135% in August and then to 4.175% in September. February 2024 contracts implied a 4.315% average cash rate and May 2024 contracts implied 4.31%, both around 24bps more than the current rate.

Owner-occupier lending accounted for about 80% of the net growth over the month, while lending in the business segment accounted for much of the balance. Investor lending declined a little and personal lending increased a touch.

The traditional driver of overall loan growth, the owner-occupier segment, grew by 0.4% over the month, the same rate as in May and April. The sector’s 12-month growth rate slowed again, this time from 5.6% to 5.3%.

Total lending in the non-financial business sector increased by 0.3%, down from 0.5% in the previous month. Growth on an annual basis slowed from 9.7% to 8.3%.

Monthly growth in the investor-lending segment slowed to a near-halt in early 2018 and essentially stayed that way until mid-2021. In June, net lending fell by 0.1%, down from May’s 0.2%, taking the 12-month growth rate from 3.7% after revisions to 3.0%.

Total personal loans rose by 0.1%, in line with May’s revised growth figure, taking the annual growth rate from 0.2% to 0.5%. This category of debt includes fixed-term loans for large personal expenditures, credit cards and other revolving credit facilities.

June core PCE in line with expectations; annual rate slows

28 July 2023

Summary: US core PCE price index up 0.2% in June, in line with expectations; annual rate slows from 4.6% to 4.1%; Barclays: goods’ prices main factor behind reduced price pressures; short-term Treasury yields fall; Fed rate-cut expectations for 2024 firm slightly.

One of the US Fed’s favoured measures of inflation is the change in the core personal consumption expenditures (PCE) price index. After hitting the Fed’s target at the time of 2.0% in mid-2018, the annual rate then hovered in a range between 1.8% and 2.0% before it eased back to a range between 1.5% and 1.8% through 2019. It then plummeted below 1.0% in April 2020 before rising back to around 1.5% in the September quarter of that year. It has since increased significantly and remains above the Fed’s target.

The latest figures have now been published by the Bureau of Economic Analysis as part of the June personal income and expenditures report. Core PCE prices rose by 0.2% over the month, in line with expectations but down from May’s 0.3% increase. On a 12-month basis, the core PCE inflation rate slowed from May’s rate of 4.6% to 4.1%.

“Overall, the June PCE price index data were in line with our expectations, with core goods explaining almost all the moderation in core price pressures” said Barclays economist Pooja Sriram. “While the recent slowing in core inflation is welcome news, we think there is further room for progress, especially on the services side, which tends to be more closely linked to wage pressures.”

US Treasury bond yields fell on the day. By the close of business, the 2-year Treasury bond yield had shed 6bps to 4.87%, the 10-year yield had lost 5bps to 3.95% while the 30-year yield finished 3bps lower at 4.01%.

In terms of US Fed policy, expectations of a lower federal funds rate in the first half of 2024 firmed slightly. At the close of business, contracts implied the effective federal funds rate would average 5.33% in August, in line with the current spot rate, and then increase to an average of 5.35% in September. December futures contracts implied a 5.40% average effective federal funds rate while July 2024 contracts implied 4.915%, 41bps less than the current rate.

The core version of PCE strips out energy and food components, which are volatile from month to month, in an attempt to identify the prevailing trend. It is not the only measure of inflation used by the Fed; the Fed also tracks the Consumer Price Index (CPI) and the Producer Price Index (PPI) from the Department of Labor. However, it is the one measure which is most often referred to in FOMC minutes.

Soft June retail sales point to poor second quarter

28 July 2023

Summary: Retail sales down 0.8% in June, lower than expected; Westpac: flat underlying trend implies declines in inflation-adjusted terms; ANZ: soft print points towards 0.5% fall in Q2 retail volumes; largest influence on result again from “other” (recreational goods, toiletries, cosmetics) sales.

Growth figures of domestic retail sales spent most of the 2010s at levels below the post-1992 average. While economic conditions had been generally favourable, wage growth and inflation rates were low. Expenditures on goods then jumped in the early stages of 2020 as government restrictions severely altered households’ spending habits. Households mostly reverted to their usual patterns as restrictions eased in the latter part of 2020 and throughout 2021.

According to the latest ABS figures, total retail sales decreased by 0.8% on a seasonally adjusted basis. The fall was lower than the generally-expected flat result and in contrast with May’s 0.8% increase after it was revised up from 0.7%. Sales increased by 2.3% on an annual basis, down from May’s revised figure of 4.1%.

“Retail sales unwound all of May’s surprise gain, pointing to a flat underlying trend implying declines in real inflation-adjusted terms,” said Westpac senior economist Matthew Hassan.

Commonwealth Government bond yields moved significantly higher on the day, largely following strong rises in US Treasury yields overnight. By the close of business, the 3-year ACGB yield had gained 8bps to 3.88%, the 10-year yield had jumped 15bps to 4.07% while the 20-year yield finished 12bps higher at 4.36%.

In the cash futures market, expectations regarding further rate rises softened. At the end of the day, contracts implied the cash rate would rise from the current rate of 4.07% to average 4.12% in August and then to 4.16% in September. February 2024 and May 2024 contracts both implied a 4.295% average cash rate, 23bps more than the current rate.

“The soft print points towards a 0.5% fall in Q2 retail volumes,” said ANZ economist Madeline Dunk. “This would mark the third consecutive decline in retail volumes, a result only seen during the GFC and not, for example, in the early 1990s recession…Spending is slowing as household budgets are squeezed by rising mortgage payments and cost of living pressures.”

Retail sales are typically segmented into six categories (see below), with the “Food” segment accounting for 40% of total sales. However, the largest influences on the month’s total again came from the “Other” segment where sales fell by 2.2% on average over the month.

Consumer spending “solid”; US Q2 GDP growth beats forecasts

27 July 2023

Summary: US GDP up 0.6% (2.4% annualised) in June quarter, above expectations; NAB: report details impressive; ANZ: slowing in real personal consumption growth will be welcomed by FOMC; GDP price deflator rate slows from 5.3% to 3.6%.

US GDP growth slowed in the second quarter of 2019 before stabilising at about 0.5% per quarter.  At the same time, US bond yields suggested future growth rates would be below trend. The US Fed agreed and it reduced its federal funds range three times in the second half of 2019. Pandemic restrictions in the June quarter of 2020 sent parts of the US economy into hibernation; the lifting of those same restrictions sparked a rapid recovery which lasted until 2022.

The US Bureau of Economic Analysis has now released the June quarter’s “advance” GDP estimates and they indicate the US economy expanded by 0.6% or at an annualised rate of 2.4%. The result was more than the 0.4% increase (1.8% annualised) which had been generally expected as well as the March quarter’s 0.5% rise after revisions.

“Details in the report were also impressive with consumer spending up a solid 1.6%, considering the outsized 4.2% gain in Q1,” said NAB senior FX strategist Rodrigo Catril. “Business investment was strong and stronger-than-expected durable goods orders bode well for future investment.”

US GDP numbers are published in a manner which is different to most other countries; quarterly figures are compounded to give an annualised figure. In countries such as Australia and the UK, an annual figure is calculated by taking the latest number and comparing it with the figure from the same period in the previous year. The diagram above shows US GDP once it has been expressed in the normal manner, as well as the annualised figure.

US Treasury bond yields rose significantly on the day. By the close of business, the 2-year Treasury bond yield had added 8bps to 4.93%, the 10-year yield had gained 14bps to 4.00% while the 30-year yield finished 10bps higher at 4.04%.

In terms of US Fed policy, expectations of a lower federal funds rate in the first half of 2024 softened. At the close of business, contracts implied the effective federal funds rate would average 5.325% in August, in line with the current spot rate, and then increase to an average of 5.345% in September. December futures contracts implied a 5.405% average effective federal funds rate while July 2024 contracts implied 4.945%, 38bps less than the current rate.

“For the FOMC, the slowing in real personal consumption growth will be welcome,” said ANZ economist Jack Chambers. “It was around potential in Q2 and implies that monetary policy is probably having the desired restraint on real household demand.”

One part of the report which is often overlooked are the figures regarding the GDP price deflator, which is another measure of inflation. The GDP price deflator is restricted to new, domestically-produced goods and services and it is not based on a fixed basket as is the case for the consumer price index (CPI). The annual rate slowed from the March quarter’s figure of 5.3% to 3.6%.

US consumers not derailed by rate rises; confidence index up again in July

25 July 2023

Summary: Conference Board Consumer Confidence Index rises in July, reading more than expected; confidence breaks out of sideways trend; ANZ: rapid rise of interest rates has not derailed US consumer; views of present conditions, short-term outlook both improve.

US consumer confidence clawed its way back to neutral over the five years after the GFC in 2008/2009 and then went from strength to strength until late 2018. Measures of consumer confidence then oscillated within a relatively narrow band at historically high levels until they plunged in early 2020. Subsequent readings then fluctuated around the long-term average until March 2021 when they returned to elevated levels. However, a noticeable gap has since emerged between the two most-widely followed surveys.

The latest Conference Board survey held during the first three weeks of July indicated US consumer confidence has improved for a third consecutive month. July’s Consumer Confidence Index registered 117.0 on a preliminary basis, above the generally-expected figure of 112.0 as well as June’s final figure of 110.1.

“Headline confidence appears to have broken out of the sideways trend that prevailed for much of the last year,” said Dana Peterson, Chief Economist at The Conference Board. “Greater confidence was evident across all age groups, and among both consumers earning incomes less than $50,000 and those making more than $100,000.”

Shorter-term US Treasury yields moved lower on the day while longer-term yields were either steady or a little higher. By the close of business, the 2-year Treasury bond yield had lost 7bps to 4.87%, the 10-year yield had added 2bps to 3.89% while the 30-year yield finished unchanged at 3.93%.

In terms of US Fed policy, expectations of a lower federal funds rate in the first half of 2024 softened. At the close of business, contracts implied the effective federal funds rate would average 5.12% in July, 4bps more than the current spot rate, and then increase to an average of 5.325% in August. December futures contracts implied a 5.42% average effective federal funds rate while June 2024 contracts implied 4.94%, 14bps less than the current rate.

“The most rapid rise in interest rates in over four decades has not derailed the consumer and in contrast to the gloomy PMI data yesterday, suggest the main driver of economic growth is both strong and strengthening,” observed ANZ senior economist Adelaide Timbrell.

Consumers’ views of present conditions and of the near-future both improved. The Present Situation Index increased from June’s figure of 155.3 to 160.0 while the Expectations Index increased from 80.0 to 88.3.

The Consumer Confidence Survey is one of two widely followed monthly US consumer sentiment surveys which produce sentiment indices. The Conference Board’s index is based on perceptions of current business and employment conditions, as well as respondents’ expectations of conditions six months in the future. The other survey, conducted by the University of Michigan, is similar and it is used to produce an Index of Consumer Sentiment. That survey differs in that it does not ask respondents explicitly about their views of the labour market and it also includes some longer-term questions.

Click for more news