News

Euro-zone industrial production slumps in September

14 November 2024

Summary: Euro-zone industrial production down 2.0% in September, worse than expected; down 2.8% on annual basis; German, French 10-year yields fall; contraction in three of four largest economies.

Following a recession in 2009/2010 and the debt-crisis which flowed from it, euro-zone industrial production recovered and then reached a peak four years later in 2016. Growth rates then fluctuated for two years before beginning a steady and persistent slowdown from the start of 2018. That decline was transformed into a plunge in March and April of 2020 which then took over a year to claw back. Production levels since early 2023 have generally declined.

According to the latest figures released by Eurostat, euro-zone industrial production contracted by 2.0% in September on a seasonally-adjusted and calendar-adjusted basis. The fall was a greater one than the 1.4% decrease and it contrasted with August’s 1.5% rise after revisions. On an annual basis, the contraction rate accelerated from August’s revised rate of 0.1% to 2.8%.

Long-term German and French sovereign bond yields finished lower on the day. By the close of business, the German 10-year bond yield had lost 5bps to 2.34% while the French 10-year yield finished 8bps lower at 3.09%.

Industrial production contracted in three of the euro-zone’s four largest economies. Germany’s production contracted by 2.7% over the month while the comparable figures for France, Spain and Italy were -0.9%, 0.9% and -0.4% respectively.

Pressure on family finances easing; consumer confidence jumps in November

12 November 2024

Summary: Westpac-Melbourne Institute consumer sentiment index rises in November; Westpac: consumers seeing some further easing in pressure on family finances, more confident about economic outlook; short-term ACGB yields increase, longer-term yields decline; rate-cut expectations soften; Westpac: sentiment posted sharp fall following US election, tentative recovery later in week; all five sub-indices rise; fewer respondents expecting higher jobless rate.

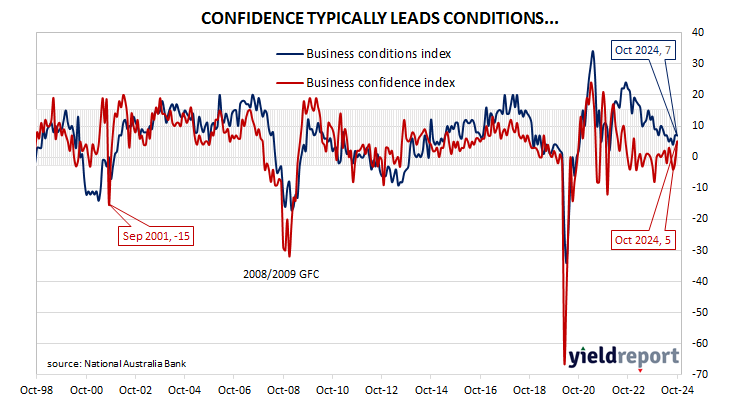
After a lengthy divergence between measures of consumer sentiment and business confidence in Australia which began in 2014, confidence readings of the two sectors converged again in mid-July 2018. Both measures then deteriorated gradually in trend terms, with consumer confidence leading the way. Household sentiment fell off a cliff in April 2020 but, after a few months of to-ing and fro-ing, it then staged a full recovery. However, consumer sentiment then weakened considerably and languished at pessimistic levels from mid-2022 while business sentiment generally remained at more robust levels.

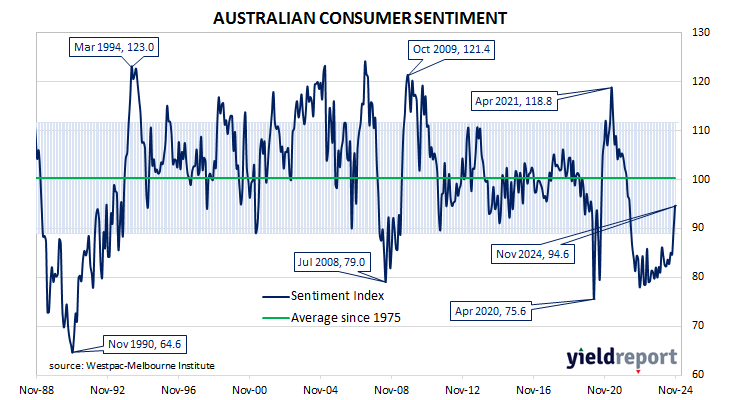
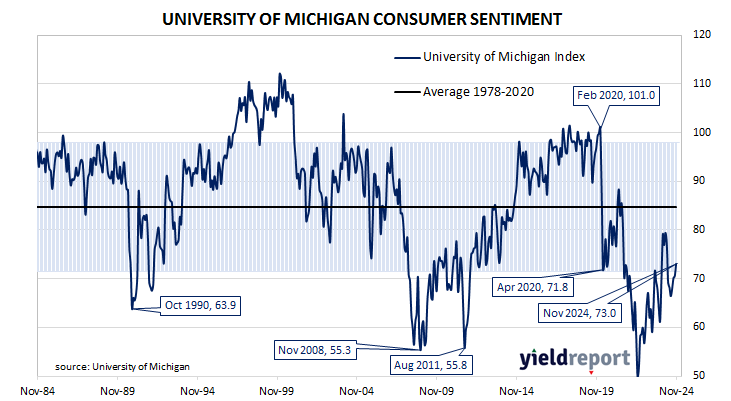
According to the latest Westpac-Melbourne Institute survey conducted over the first week of November, household sentiment again improved markedly, albeit to a level which is still somewhat on the pessimistic side. Their Consumer Sentiment Index jumped from October’s reading of 89.8 to 94.6, a reading which is still lower than the long-term average reading of just over 101.

“Consumers are seeing some further easing in the pressure on family finances, are no longer concerned about the risk of further interest rate rises and are becoming more confident about the economic outlook,” said Westpac senior economist Matthew Hassan. “However, some big shifts over the course of the survey week suggest the lift in confidence is shakier than it looks.”

Any reading of the Consumer Sentiment Index below 100 indicates the number of consumers who are pessimistic is greater than the number of consumers who are optimistic.

The figures came out on the same day as the latest NAB Business Survey and short-term Commonwealth Government bond yields increased modestly while longer-term declined a little. By the close of business, the 3-year ACGB yield had added 1bp to 4.11%, the 10-year yield had slipped 1bp to 4.58% while the 20-year yield finished 2bps higher at 4.88%.

Expectations regarding rate cuts in the next twelve months softened, with a February cut now viewed as not especially likely. Cash futures contracts implied an average of 4.335% in November, 4.315% in December and 4.29% in February 2025. October 2025 contracts implied 3.96%, 38bps less than the current cash rate.

“Three things stand out,” Hassan added. “Firstly, consumer sentiment was markedly higher at the start of the week with an index read of 99.7 amongst those surveyed prior to the RBA announcement.  Secondly, sentiment was unaffected by the RBA decision, with the index unchanged on November 5. Thirdly, sentiment posted a sharp fall following the US election result but with a tentative recovery forming towards the end of the week, with an average index read of 91.1 amongst responses gathered between November 6 and November 9.”

All five sub-indices registered higher readings, with the “Economic conditions – next 12 months” sub-index again posting the largest monthly percentage gain. 

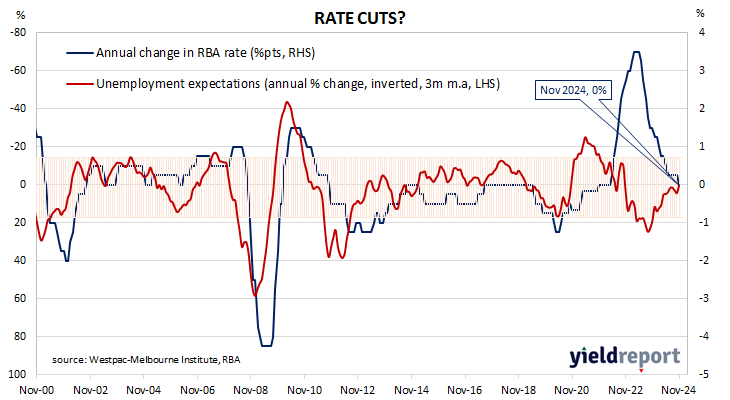
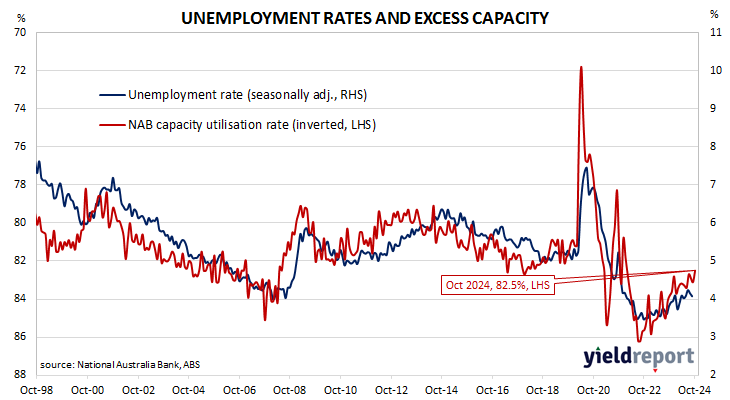
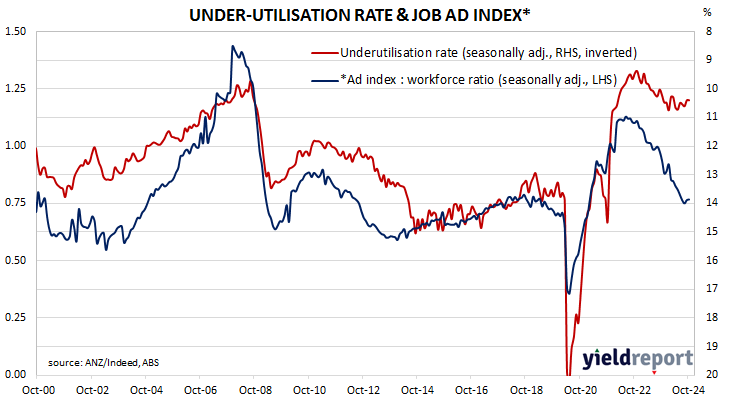
The Unemployment Expectations index, formerly a useful guide to RBA rate changes, fell from 129.8 to 120.5, materially below the long-term average of 129.1. Lower readings result from fewer respondents expecting a higher unemployment rate in the year ahead.

Business confidence spikes in October; inflation pressures ease

12 November 2024

Summary: Business conditions steady in October; business confidence improves markedly, back to average; NAB: confidence spikes, an encouraging sign; short-term ACGB yields increase, longer-term yields decline; rate-cut expectations soften; NAB: survey continues to suggest ongoing gradual easing in inflation pressure; capacity utilisation rate falls.

NAB’s business survey indicated Australian business conditions were robust in the first half of 2018, with a cyclical-peak reached in April of that year. Readings from NAB’s index then began to slip and forecasts of a slowdown in the domestic economy began to emerge in the first half of 2019 as the index trended lower. It hit a nadir in April 2020 as pandemic restrictions were introduced but then improved markedly over the next twelve months and has subsequently remained at robust levels until recently.

According to NAB’s latest monthly business survey of around 350 firms conducted in the last week of October, business conditions have remained steady at a level in line with the long-term average. NAB’s conditions index registered 7 points, unchanged from September’s reading.

At the same time, business confidence improved markedly.  NAB’s confidence index rose 7 points to +5 points, a reading which is also in line with its long-term average.  NAB’s confidence index typically leads the conditions index by one month, although some divergences have appeared from time to time.

“Confidence spiked in the month after an extended period of below-average reads,” said NAB Head of Australian Economics Gareth Spence. “While it’s just one month this is an encouraging sign alongside a tentative improvement in forward orders.”

The figures came out on the same day as the latest Westpac-Melbourne Institute consumer sentiment survey and short-term Commonwealth Government bond yields increased modestly while longer-term declined a little. By the close of business, the 3-year ACGB yield had added 1bp to 4.11%, the 10-year yield had slipped 1bp to 4.58% while the 20-year yield finished 2bps higher at 4.88%.

Expectations regarding rate cuts in the next twelve months softened, with a February cut now viewed as not especially likely. Cash futures contracts implied an average of 4.335% in November, 4.315% in December and 4.29% in February 2025. October 2025 contracts implied 3.96%, 38bps less than the current cash rate.

“We continue to watch the survey closely, not just for the forward looking and activity indicators but also capacity utilisation which will be key in the evolution in price pressures for the economy,” added Spence. “The survey, like other price indicators, continues to suggest an ongoing gradual easing in inflation pressure but also that there is still some way to go in in the inflation moderation when we look at the consumer facing components.”

NAB’s measure of national capacity utilisation fell back from September’s reading of 83.1% to 82.5%, a level which is still quite robust from a historical perspective. Five of the eight sectors of the economy were reported to be operating at or above their respective long-run averages.

Capacity utilisation is generally accepted as an indicator of future investment expenditure and it also has a strong inverse relationship with Australia’s unemployment rate.

US pessimism easing; UoM index rises in November

08 November 2024

Summary: University of Michigan consumer confidence index rises in November, higher than expected; views of present conditions deteriorate, views of future conditions improve; above June 2022 trough but still below pre-pandemic readings; short-term US Treasury yields rise, longer-term yields fall; rate-cut expectations soften; inflation expectations mixed – short-term down, long-term up.

US consumer confidence started 2020 at an elevated level but, after a few months, surveys began to reflect a growing unease with the global spread of COVID-19 and its reach into the US. Household confidence plunged in April 2020 and then recovered in a haphazard fashion, generally fluctuating at below-average levels according to the University of Michigan. The University’s measure of confidence had recovered back to the long-term average by April 2021 but then it plunged again in the September quarter and remained at historically low levels through 2022 and 2023.

The latest survey conducted by the University indicates confidence among US households has improved somewhat in November. The preliminary reading of the Index of Consumer Sentiment registered 73.0, higher than the 70.6 which had been generally expected and up from October’s final figure of 70.5.

Consumers’ views of current conditions deteriorated while their views of future conditions improved relative to those held at the time of the October survey. The Current Economic Conditions Index slipped from 64.9 to 64.4 while the Index of Consumer Expectations Index increased from 74.1 to 78.5.

“Sentiment is now nearly 50% above its June 2022 trough but remains below pre-pandemic readings,” said the University’s Surveys of Consumers Director Joanne Hsu. “Note that interviews for this release concluded on Monday and thus do not capture any reactions to election results.”

Short-term US Treasury bond yields rose moderately on the day while longer-term yields fell.  By the close of business, the 2-year Treasury yield had gained 5bps to 4.16%, the 10-year yield had lost 2bps to 4.31% while the 30-year yield finished 7bps lower at 4.47%.

In terms of US Fed policy, expectations of a lower federal funds rate in the next 12 months softened, although another three 25bp cuts are still priced in. At the close of business, contracts implied the effective federal funds rate would average 4.505% in December, 4.405% in January and 4.315% in February. October 2025 contracts implied 3.84%, 74bps less than the current rate.

US consumer inflation expectations eased in the short-term while longer-term expectations increased slightly. Year-ahead expectations slowed from 2.7% to 2.6% but long-term expectations ticked up from 3.0% to 3.1%.

It was once thought less-confident households are generally inclined to spend less and save more; some decline in household spending could be expected to follow. However, recent research suggests the correlation between household confidence and retail spending is quite weak.

Another monthly rise for job ads; up 0.3% in October

04 November 2024

Summary: Job ads up 0.3% in October; 15.8% lower than October 2023; ANZ: downward trend in Job Ads may be stabilising; short-term ACGB yields steady, longer-terms yields rise; rate-cut expectations largely unchanged, February cut not especially likely; Indeed: advertisements higher in half of all sectors; ad index-to-workforce ratio increases.

From mid-2017 onwards, year-on-year growth rates in the total number of Australian job advertisements consistently exceeded 10%. That was until mid-2018 when the annual growth rate fell back markedly. 2019 was notable for its reduced employment advertising and this trend continued into the first quarter of 2020. Advertising then plunged in April and May of 2020 as pandemic restrictions took effect but recovered quite quickly, reaching historically-high levels in 2022.

According to the latest reading of the ANZ-Indeed Job Ads Index, total job advertisements in October increased by 0.3% on a seasonally adjusted basis. Their index rose from 115.7 in September after revisions to 116.1, with the gain following a rise of 2.3% in September and a fall of 1.5% in August. On a 12-month basis, total job advertisements were 15.8% lower than in October 2023, up from September’s revised figure of -18.9%.

“ANZ-Indeed Australian Job Ads recorded its second consecutive rise, with the series up 2.6% over the last two months,” said ANZ economist Madeline Dunk. “This suggests the downward trend in Job Ads may be stabilising.”

Short-term Australian Commonwealth Government bond yields finished steady on the day while longer-term yields increased modestly, lagging the upward movements of US Treasury yields on Friday night. By the close of business, the 3-year ACGB yield had returned to its starting point at 4.04%, the 10-year yield had added 2bps to 4.57% while the 20-year yield finished 1bp higher at 4.90%.

Expectations regarding rate cuts in the next twelve months remained largely unchanged, with a February 2025 rate cut not viewed as especially likely. Cash futures contracts implied an average of 4.33% in November, 4.305% in December and 4.26% in February 2025. September 2025 contracts implied 3.915%, 42bps less than the current cash rate.

“Growth in Job Ads in October were Christmas-themed, with both retail and food service opportunities rising considerably,” said Indeed Senior Economist Callam Pickering. “Customer service Job Ads also rose. Over the past three months, Job Ads have increased in half of all sectors, a notable improvement on the widespread declines from earlier this year. This is another sign that Job Ads may be stabilising.”

The inverse relationship between job advertisements and the unemployment rate or the underemployment rate has been quite strong (see below chart), although ANZ themselves called the relationship between the series into question in early 2019. 

A higher job advertisement index as a proportion of the labour force is suggestive of lower unemployment rates in the near future while a lower ratio suggests higher unemployment rates will follow. October’s ad index-to-workforce ratio increased from 0.76 to 0.77.

In 2008/2009, advertisements plummeted and Australia’s unemployment rate jumped from 4% to nearly 6% over a period of 15 months. When a more dramatic fall in advertisements took place in April 2020, the unemployment rate responded much more quickly.

Private sector inflation measure speeds up in October; effect of rebates fades

04 November 2024

Summary: Melbourne Institute Inflation Gauge index up 0.3% in October; up 3.0% on annual basis; Westpac: reflects unwinding of first instalment of electricity rebate; short-term ACGB yields steady, longer-terms yields rise; rate-cut expectations largely unchanged, February cut not especially likely.

The Melbourne Institute’s Inflation Gauge is an attempt to replicate the ABS consumer price index (CPI) on a monthly basis. It has turned out to be a reliable leading indicator of the CPI, although there are periods in which the Inflation Gauge and the CPI have diverged for as long as twelve months. On average, the Inflation Gauge’s annual rate tends to overestimate the ABS rate by around 0.1%, or at least until recently.

The Melbourne Institute’s latest reading of its Inflation Gauge index indicates consumer prices increased by 0.3% in October, up from 0.1% in September and in contrast with August’s 0.1%. Inflation on an annual basis accelerated from 2.6% to 3.0%.

“The acceleration in part reflects an unwind of the first instalment of the Federal Government’s electricity rebates,” said Westpac senior economist Pat Bustamante.

Short-term Australian Commonwealth Government bond yields finished steady on the day while longer-term yields increased modestly, lagging the upward movements of US Treasury yields on Friday night. By the close of business, the 3-year ACGB yield had returned to its starting point at 4.04%, the 10-year yield had added 2bps to 4.57% while the 20-year yield finished 1bp higher at 4.90%.

Expectations regarding rate cuts in the next twelve months remained largely unchanged, with a February 2025 rate cut not viewed as especially likely. Cash futures contracts implied an average of 4.33% in November, 4.305% in December and 4.26% in February 2025. September 2025 contracts implied 3.915%, 42bps less than the current cash rate.

Central bankers desire a certain level of inflation which is “sufficiently low that it does not materially distort economic decisions in the community” but high enough so it does not constrain “a central bank’s ability to combat recessions.”

Home loan approvals fall in September; investors retreat

01 November 2024

Summary: Value of loan commitments down 0.3% in September, in contrast with expected rise; 18.9% higher than September 2023; ANZ: first fall in investor lending in five months; ACGB yields rise; rate-cut expectations largely unchanged; Westpac: result centred on decline in value of loans to investors; value of owner-occupier loan approvals up 0.1%; value of investor approvals down 1.0%; number of owner-occupier home loan approvals down 0.1%.

The number and value of home-loan approvals began to noticeably increase after the RBA reduced its cash rate target in a series of cuts beginning in mid-2019, potentially ending the downtrend which had been in place since mid-2017. Figures from February through to May of 2020 provided an indication the downtrend was still intact but subsequent figures then pushed both back to record highs in 2021. After a considerable pullback in 2022 both the value and number of approved loans resumed rising in 2023.

September’s housing finance figures have now been released and total loan approvals excluding refinancing declined by 0.3% In dollar terms over the month, in contrast with the 1.0% rise which had been generally expected and August’s upwardly-revised 2.1% increase. On a year-on-year basis, total approvals excluding refinancing were 18.9% higher than in September 2023, down from August’s comparable figure of 22.9%.

“This was the first fall in investor lending in five months,” said ANZ economist Madeline Dunk. “Victoria, Queensland, Western Australia and the ACT all recorded declines. Average loan sizes for investors increased, suggesting the fall was due to softer sales volumes.”

Commonwealth Government bond yields rose moderately along the curve on the day. By the close of business, 3-year and 10-year ACGB yields had both gained 3bps to 4.04% and 4.55% respectively while the 20-year yield finished 4bps higher at 4.89%.

Expectations regarding rate cuts in the next twelve months remained largely unchanged, with a February 2025 rate cut not viewed as especially likely. Cash futures contracts implied an average of 4.33% in November, 4.31% in December and 4.26% in February 2025. September 2025 contracts implied 3.94%, 40bps less than the current cash rate.

“The soft September result centred on a 1% decline in the value of loans to investors,” said Westpac senior economist Matthew Hassan. “Despite this, growth has been considerably strong across this segment, up 29.5% in value terms and 20.8% in loan numbers, both near historical highs.”

The total value of owner-occupier loan commitments excluding refinancing increased by 0.1%, down from August’s 2.4% rise. On an annual basis, owner-occupier loan commitments were 13.1% higher than in September 2023, down from August’s comparable figure of 16.7%.

The total value of investor commitments excluding refinancing decreased by 1.0%, in contrast with a 1.8% increase in August. The annual growth rate from 34.4% to 29.5%.

The total number of loan commitments to owner-occupiers excluding refinancing slipped by 0.1% to 26841 on a seasonally adjusted basis, a smaller decline with August’s 0.3% fall. The annual growth rate slowed from 6.1% after revisions to 4.1%.

Core PCE price growth steady at 2.7%

31 October 2024

Summary: US core PCE price index up 0.3% in September, in line with expectations; annual rate steady at 2.7%; ANZ: core PCE deflator largely unchanged for past five months; Treasury yields decline; Fed rate-cut expectations firm, four 25bp cuts priced in.

One of the US Fed’s favoured measures of inflation is the change in the core personal consumption expenditures (PCE) price index. After hitting the Fed’s target at the time of 2.0% in mid-2018, the annual rate then hovered in a range between 1.8% and 2.0% before it eased back to a range between 1.5% and 1.8% through 2019. It then plummeted below 1.0% in April 2020 before rising back to around 1.5% in the September quarter of that year. It has since increased significantly and still remains above the Fed’s target even after recent declines.

The latest figures have now been published by the Bureau of Economic Analysis as part of the September personal income and expenditures report. Core PCE prices rose by 0.3% over the month, in line with expectations but greater than August’s 0.1% increase. On a 12-month basis, the core PCE inflation rate remained steady at 2.7%.

“On a headline basis, disinflation is running faster than the FOMC had forecast,” said ANZ economist Jack Chambers. “The core measure is firmer. It rose 0.254% in September, the highest monthly rise since April. That left the annual rate at 2.7%, pretty much where it has been for the past five months.”

US Treasury bond yields declined by modest amounts along the curve on the day. By the close of business, the 2-year Treasury bond yield had lost 2bps to 4.17%, the 10-year yield had slipped 1bp to 4.29% while the 30-year yield finished 2bps lower at 4.48%.

In terms of US Fed policy, expectations of a lower federal funds rate in the next 12 months firmed a little, with another four 25bp cuts currently fully factored in. At the close of business, contracts implied the effective federal funds rate would average 4.65% in November, 4.51% in December and 4.25% in February. September 2025 contracts implied 3.74%, 109bps less than the current rate.

The core version of PCE strips out energy and food components, which are volatile from month to month, in an attempt to identify the prevailing trend. It is not the only measure of inflation used by the Fed; the Fed also tracks the Consumer Price Index (CPI) and the Producer Price Index (PPI) from the Department of Labor. However, it is the one measure which is most often referred to in FOMC minutes.

Spending picking up, slowly; September retail up 0.1%

31 October 2024

Summary: Retail sales up 0.1% in September, less than expected; up 2.3% on 12-month basis; ANZ: cost-of-living relief, moderating inflation, tax cuts flowing through; ACGB yields rise; rate-cut expectations soften, Feb cut uncertain; ANZ: suggests elongated recovery in spending growth; Westpac: typically takes time for retail spending to increase post-tax cuts; largest influence on result from household goods sales.

Growth figures of domestic retail sales spent most of the 2010s at levels below the post-1992 average. While economic conditions had been generally favourable, wage growth and inflation rates were low. Expenditures on goods then jumped in the early stages of 2020 as government restrictions severely altered households’ spending habits. Households mostly reverted to their usual patterns as restrictions eased in the latter part of 2020 and throughout 2021.

According to the latest ABS figures, total retail sales increased by just 0.1% on a seasonally adjusted basis in September. The result was slightly less than the 0.2% increase which had been generally expected and well down on August’s 0.7% rise. Sales increased by 2.3% on an annual basis, down from August’s comparable figure of 3.1%.

“It appears the combined impact of cost-of-living relief, moderating inflation and tax cuts is flowing through to a modest pickup in aggregate spending,” said ANZ economist Madeline Dunk.

The update was released alongside several other monthly economic reports and Commonwealth Government bond yields rose by decreasing amounts along the curve on the day. By the close of business, the 3-year ACGB yield had gained 6bps to 4.01%, the 10-year yield had added 4bps to 4.52% while the 20-year yield finished 2bps higher at 4.85%.

Expectations regarding rate cuts in the next twelve months softened slightly, with a February 2025 rate cut currently viewed as uncertain. Cash futures contracts implied an average of 4.33% in November, 4.31% in December and 4.27% in February 2025. September 2025 contracts implied 3.945%, 40bps less than the current cash rate.

“Our ANZ-Roy Morgan Australian Consumer Confidence measure continues to trend upwards, albeit at a gradual pace,” Dunk added. “That in turn suggests an elongated recovery in spending growth from here. That said, given the increasingly price-sensitive nature of households, we do expect to see strong spending around key retail events like Black Friday and Boxing Day sales.”

“More broadly, the results indicate relatively subdued trends in consumer demand,” said Westpac economist Neha Sharma. “Despite the introduction of tax cuts and other fiscal measures, consumers appear to be selectively spending, especially around sale periods. As noted last month, it typically takes time for retail spending to increase post-tax cuts, and it seems we are still following a similar path to previous periods of tax changes.”

Retail sales are typically segmented into six categories (see below), with the “Food” segment accounting for 40% of total sales. However, the largest influence on the month’s total came from “Household goods” segment where sales rose by 0.5%.

US Sep quarter GDP meets expectations; 2-year Treasury yields jump

30 October 2024

Summary: US GDP up 0.7% (2.8% annualised) in September quarter, in line with expectations; up 2.7% over year; Westpac: stronger goods spending, services spending back to trend; US Treasury yields rise; rate-cut expectations soften; GDP price deflator rate slows from 2.6% to 2.2%.

US GDP growth slowed in the second quarter of 2019 before stabilising at about 0.5% per quarter.  At the same time, US bond yields suggested future growth rates would be below trend. The US Fed agreed and it reduced its federal funds range three times in the second half of 2019. Pandemic restrictions in the June quarter of 2020 sent parts of the US economy into hibernation; the lifting of those same restrictions sparked a rapid recovery which lasted until 2022.

The US Bureau of Economic Analysis has now released the September quarter’s advance GDP estimate and it indicates the US economy expanded by 0.7% or at an annualised rate of 2.8%. The result was largely in line with the 0.7% increase (3.0% annualised) which had been generally expected as well as the June quarter’s 0.7% rise. On a year-on-year basis, GDP expanded by 2.7%, down from 3.0% after revisions to the previous quarter.

“GDP was broadly in line with our and the market’s expectation at 2.8% annualised in the September quarter,” said Westpac economist Jameson Coombs. “However, the consumer was stronger, total consumption growing 3.7% annualised as goods consumption spiked while momentum in services edged lower to an around-trend pace.”

US GDP numbers are published in a manner which is different to most other countries; quarterly figures are compounded to give an annualised figure. In countries such as Australia and the UK, an annual figure is calculated by taking the latest number and comparing it with the figure from the same period in the previous year. The diagram above shows US GDP once it has been expressed in the normal manner, as well as the annualised figure.

US Treasury bond  yields rose by declining amounts out along the curve. By the close of business, the 2-year Treasury bond yields had gained 9bps to 4.19%, the 10-year yield had added 4bps to 4.30% while the 30-year yield finished unchanged at 4.50%.

In terms of US Fed policy, expectations of a lower federal funds rate in the next 12 months softened, although at least another four 25bp cuts are still factored in. At the close of business, contracts implied the effective federal funds rate would average 4.65% in November, 4.51% in December and 4.255% in February. September 2025 contracts implied 3.75%, 108bps less than the current rate.

One part of the report which is often overlooked are the figures regarding the GDP price deflator, which is another measure of inflation. The GDP price deflator is restricted to new, domestically-produced goods and services and it is not based on a fixed basket as is the case for the consumer price index (CPI). These latest figures indicate the annual rate slowed from 2.6% in the June quarter to 2.2%.

Click for more news