News

Germany “on cusp of recession”: July ifo survey

25 July 2022

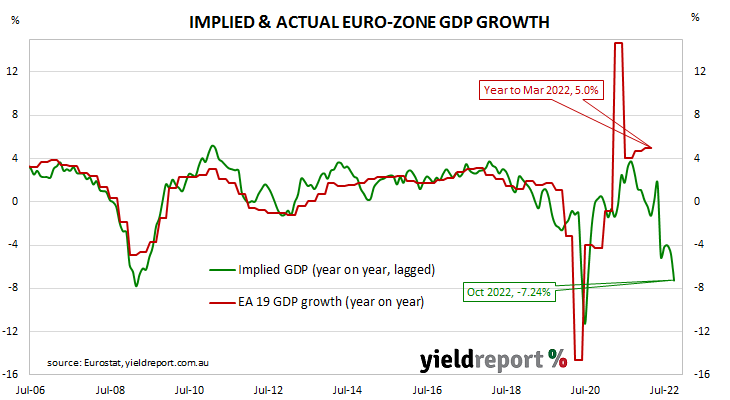
Summary: ifo business climate index down again in July, well below expected figure; current conditions index, expectations index both down; Germany “on cusp of recession”; improvement difficult to see given elevated energy prices, further reductions in energy supply; expectations index implies euro-zone GDP contraction of 7.2% in year to October 2022.

Following a recession in 2009/2010, the ifo Institute’s Business Climate Index largely ignored the European debt-crisis of 2010-2012, mostly posting average-to-elevated readings through to early-2020. However, the index was quick to react in the March 2020 survey, falling precipitously. Readings through much of 2021 generally fluctuated around the long-term average before dropping away in 2022.

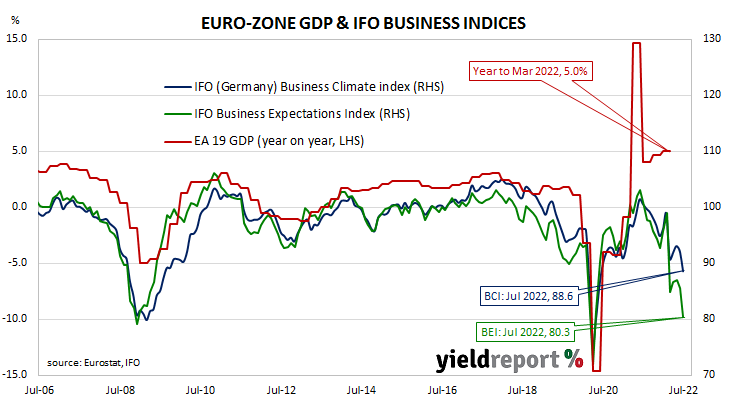
According to the latest report released by ifo, German business sentiment has deteriorated even further. July’s Business Climate Index recorded a reading of 88.6, well below the consensus expectation of 90 as well as June’s final reading of 92.2. The average reading since January 2005 is just above 97.

“Sentiment in German business has cooled significantly,” said Clemens Fuest, President of the ifo Institute. “Higher energy prices and the threat of a gas shortage are weighing on the economy. Germany is on the cusp of a recession.”

German firms’ views of current conditions and their outlook both deteriorated again. The current situation index fell from June’s revised figure of 99.4 to 97.7 while the expectations index decreased from 85.5 to 80.3.

German and French long-term bond yields both decreased modestly on the day. By the close of business, German and French 10-year bond rates had both lost 2bps to 1.02% and 1.61%.

“It’s difficult to see sentiment turning, with elevated energy prices and further reductions in energy supply as Russia announced plans to cut Nord Stream gas flows to 20% of capacity,” said ANZ economist Madeline Dunk.

The ifo Institute’s business climate index is a composite index that combines German companies’ views of current conditions with their outlook for the next six months. It has similarities to consumer sentiment indices in the US such as the ones produced by The Conference Board and the University of Michigan.

It also displays a solid correlation with euro-zone GDP growth rates. However, the expectations index is a better predictor as it has a higher correlation when lagged by one quarter. July’s expectations index implies a 7.2% year-on-year GDP contraction to the end of October.

US leading index down again in June; recession “now likely”

21 July 2022

Summary: Conference Board leading index down 0.8% in June, lower than expected; growth “likely to slow further”, “recession risks grow”; recession around end of this year, early next “now likely”; latest reading implies 2.0% US GDP growth to September.

The Conference Board Leading Economic Index (LEI) is a composite index composed of ten sub-indices which are thought to be sensitive to changes in the US economy. The Conference Board describes it as an index which attempts to signal growth peaks and troughs; turning points in the index have historically occurred prior to changes in aggregate economic activity. Readings from March and April of 2020 signalled “a deep US recession” while subsequent readings indicated the US economy would recover rapidly. More recent readings have generally implied lower US GDP growth rates.

The latest reading of the LEI indicates it decreased by 0.8% in June. The result was lower than the 0.6% fall which had been generally expected as May’s revised figure of -0.6% after it was revised down from -0.4%.

“The US LEI declined for a fourth consecutive month suggesting economic growth is likely to slow further in the near-term as recession risks grow,” said Ataman Ozyildirim, Senior Director of Economic Research at The Conference Board.

US Treasury bond yields moved considerably lower on the day. By the close of business, the 2-year Treasury yield had shed 13bps to 3.10%, the 10-year yield had lost 15bps to 2.88% while the 30-year yield finished 12bps lower at 3.04%.

In terms of US Fed policy, expectations of a higher federal funds range over the next 12 months softened. July contracts implied an effective federal funds rate of 1.6825%, 10bps higher than the current spot rate.  September contracts implied a rate of 2.555% while July 2023 futures contracts implied an effective federal funds rate of 3.195%, 160bps above the spot rate.

Ozyildirim attributed the fall in the index to consumer pessimism, softening labour market conditions, falling share prices and fewer new orders in the manufacturing sector. He also expects US economic conditions to worsen. “Amid high inflation and rapidly tightening monetary policy, The Conference Board expects economic growth will continue to cool throughout 2022. A US recession around the end of this year and early next is now likely.

The Conference Board now expects US GDP growth of 1.7% in 2022, down from 2.3%. Regression analysis suggests the latest reading implies a 2.0% year-on-year growth rate in September, down from August’s revised figure of 2.6%.                

“Very early impact” of rate tightening hits Westpac-MI leading index

20 July 2022

Summary:  Leading index growth rate down in June; index capturing “very early impact” of rate tightening; reading implies annual GDP growth of around 3.15%.

Westpac and the Melbourne Institute describe their Leading Index as a composite measure which attempts to estimate the likely pace of Australian economic growth in the short-term. After reaching a peak in early 2018, the index trended lower through 2018 and 2019 before plunging to recessionary levels in the second quarter of 2020. Subsequent readings were markedly higher but readings through 2021 mostly declined.

The June reading of the six month annualised growth rate of the indicator registered 0.40%, down from May’s revised figure of 0.56%.

“The June Index is capturing the very early impact of central bank tightening cycles,” said Westpac Chief Economist Bill Evans. “As the Reserve Bank extends and accelerates the pace of its tightening cycle, we can expect the growth rate in the Index to continue to ease.”

Index figures represent rates relative to “trend” GDP growth, which is generally thought to be around 2.75% per annum in Australia. The index is said to lead GDP by “three to nine months into the future” but the highest correlation between the index and actual GDP figures occurs with a three-month lead. The current reading thus represents an annual GDP growth rate of around 3.15% at the end of the September quarter.

Domestic Treasury bond yields moved higher on the day. By the close of business, 3-year and 10-year  ACGB yields had both gained 4bps to 3.35% and 3.59% respectively while the 20-year yield finished 2bps higher at 3.80%.

In the cash futures market, expectations for a steeper path of the actual cash rate over time hardened. At the end of the day, contracts implied the cash rate would rise from the current rate of 1.31% to 1.89% in August and then increase to 3.28% by November. February contracts implied a 3.775% cash rate while May 2023 contracts implied 3.76%.

US industrial output contracts in June; prior months’ numbers revised down

15 July 2022

Summary: US industrial output down 0.2% in June, below market expectations; up 4.2% over past 12 months; all major components ex mining miss expectations, prior months’ revised lower; capacity utilisation rate down 0.3ppts to 80.0%, just short of long-term average.

The Federal Reserve’s industrial production (IP) index measures real output from manufacturing, mining, electricity and gas company facilities located in the United States. These sectors are thought to be sensitive to consumer demand and so some leading indicators of GDP use industrial production figures as a component.

US production collapsed through March and April of 2020 before recovering the ground lost over the fifteen months to July 2021.

According to the Federal Reserve, US industrial production contracted by 0.2% on a seasonally adjusted basis in June. The result was less than the flat result which had been generally expected as well as May’s 0.0% after it was revised down from 0.2%. On an annual basis, the growth rate slowed from May’s revised figure of 4.8% to 4.2%.

“Every major component except mining missed expectations, and all major components were revised sharply lower in prior months,” said Westpac Senior Foreign Exchange Strategist Sean Callow.

Long-term US Treasury bond yields moved moderately lower on the day. By the close of business, the 10-year Treasury yield had lost 4bps to 2.92% while the 30-year yield had shed 3bps to 3.08%. The 2-year yield finished unchanged at 3.12%.

The same report includes US capacity utilisation figures which are generally accepted as an indicator of future investment expenditure and/or inflationary pressures. Capacity usage had hit a high for the last business cycle in early 2019 before it began a downtrend which ended with April 2020’s multi-decade low of 64.2%. June’s reading declined from May’s revised figure of 80.3% to 80.0%, just short of the long-term average of 80.1%.

While the US utilisation rate’s correlation with the US jobless rate is solid, it is not as high as the comparable correlation in Australia.

US producer inflation hits 11.2% in June; firms retain strong pricing power

14 July 2022

Summary: US producer price index (PPI) up 1.1% in June, greater than expected; annual rate rises to 11.2%; “core” PPI up 0.4%; fuel prices again a big driver; US Treasury yields, rate-rise expectations, move haphazardly; business margins show firms still retain strong pricing power.

Around the end of 2018, the annual inflation rate of the US producer price index (PPI) began a downtrend which continued through 2019. Months in which producer prices increased suggested the trend may have been coming to an end, only for it to continue, culminating in a plunge in April 2020. Figures returned to “normal” towards the end of that year but annual rates over the past eighteen months have been well above the long-term average.

The latest figures published by the Bureau of Labor Statistics indicate producer prices rose by 1.1% after seasonal adjustments in June. The increase was greater than the 0.8% which had been generally expected as well as May’s revised increase of 0.9%. On a 12-month basis, the rate of producer price inflation after seasonal adjustments accelerated from May’s revised rate of 10.8% to 11.2%.

Producer prices excluding foods and energy, or “core” PPI, rose by 0.4% after seasonal adjustments. The increase was less than the 0.5% rise which had been generally expected as well as May’s 0.6% after it was revised up from 0.5%. The annual rate slowed from May’s revised figure of 8.5% to 8.3%.

“High fuel prices again a big driver in the June number and the numbers paint a too-high inflation picture to be sure, but in contrast to the CPI a day earlier the detail didn’t make for as universally gloomy reading,” said NAB economist Taylor Nugent.

US Treasury bond yields moved haphazardly on the day. By the close of business, the 2-year Treasury yield had slipped 1bp to 3.14%, the 10-year yield had gained 3bps to 2.96% while the 30-year yield finished 1bp lower at 3.11%.

In terms of US Fed policy, expectations of higher federal funds rates through to March 2023 softened somewhat while simultaneously hardening for months further out. At the close of business, July contracts implied an effective federal funds rate of 1.69%, 11bps higher than the current spot rate. September contracts implied 2.625% while July 2023 futures contracts implied an effective federal funds rate of 3.365%, nearly 180bps above the spot rate.

ANZ economist Kishti Sen said recent months’ increases in business margins show “firms still retain strong pricing power”, thus implying “core CPI inflation will remain high in coming months, especially as service prices are generally sticky.”

The producer price index is a measure of prices received by producers for domestically produced goods, services and construction. It is put together in a fashion similar to the consumer price index (CPI) except it measures prices received from the producer’s perspective rather than from the perspective of a retailer or a consumer. It is another one of the various measures of inflation tracked by the US Fed, along with core personal consumption expenditure (PCE) price data.

“Sticker shock”: US inflation hits 9% in June

13 July 2022

Summary: US CPI up 1.3% in June, higher than expected; “core” rate up 0.7%; 9% “sticker shock”; short-term Treasury yields up, longer-term yields decline, rate rise expectations harden; energy prices main driver of headline rise; core service sector inflation “concerning”.

The annual rate of US inflation as measured by changes in the consumer price index (CPI) halved from nearly 3% in the period from July 2018 to February 2019. It then fluctuated in a range from 1.5% to 2.0% through 2019 before rising above 2.0% in the final months of that year. Substantially lower rates were reported from March 2020 to May 2020 and they remained below 2% until March 2021. Rates have since risen significantly.

The latest CPI figures released by the Bureau of Labor Statistics indicated seasonally-adjusted consumer prices rose by 1.3% on average in June. The increase was higher than the generally expected figure of 1.1% as well as May’s 1.0%. On a 12-month basis, the inflation rate accelerated from May’s reading of 8.5% to 9.0%.

“Headline” inflation is known to be volatile and so references are often made to “core” inflation for analytical purposes. The core prices index, the index which excludes the more variable food and energy components, increased by 0.7% on a seasonally-adjusted basis for the month. The rise was larger than the 0.5% expected as well as May’s 0.6% increase. However, the annual growth rate still slowed from 6.0% to 5.9%.

“There was nothing in the entrails of last night’s US CPI report to provide any offset to the sticker shock of headline CPI printing above 9%…” said NAB’s Head of FX Strategy within its FICC division Ray Attrill.

US CPI up , Fed expectations inflation would moderate in Q2; Treasury yields up materially, rate rise expectations firm; non-energy services

US short-term Treasury bond yields jumped on the day, while longer-term yields declined. By the close of business, the 2-year Treasury yield had gained 10bps to 3.15% while 10-year and 30-year yields both finished 3bps lower at 2.94% and 3.12% respectively.

In terms of US Fed policy, expectations of higher federal funds rates over the next 12 months hardened considerably. At the close of business, July contracts implied an effective federal funds rate of 1.70%, 12bps higher than the current spot rate. September contracts implied 2.715% while July 2023 futures contracts implied an effective federal funds rate of 3.19%, 161bps above the spot rate.

The largest influence on headline results is often the change in fuel prices. “Energy commodities”, the segment which contains vehicle fuels, increased by 10.4%, adding 0.54 percentage points. Prices of non-energy services, the segment which includes actual and implied rents, also had a significant effect, adding 0.40 percentage points after they increased by 0.7% on average.

“Most concerning here was the strength in core service sector inflation, in particular a 0.8% rise in primary actual rents and 0.7% rise in ‘owner-occupied’ rent…” added Attrill.

Consumer rate anxiety increasing; sentiment index slides again

12 July 2022

Summary: Household sentiment deteriorates for eighth consecutive month in July; “anxiety” around interest rates increasing; four of five sub-indices lower; respondents more concerned by prospects of unemployment.

After a lengthy divergence between measures of consumer sentiment and business confidence in Australia which began in 2014, confidence readings of the two sectors converged again in mid-July 2018. Both measures then deteriorated gradually in trend terms, with consumer confidence leading the way. Household sentiment fell off a cliff in April 2020 but, after a few months of to-ing and fro-ing, it then staged a full recovery. However, consumer sentiment has deteriorated significantly over the past year, while business sentiment has been somewhat more robust.

According to the latest Westpac-Melbourne Institute survey conducted in the first week of July, household sentiment has deteriorated for an eighth consecutive month. Their Consumer Sentiment Index fell from June’s reading of 86.4 to 83.8, a reading which is below the range of “normal” readings and significantly lower than the long-term average reading of just over 101.

“Without doubt consumers are still very sensitive to the inflation pressures on their budgets but it appears their anxiety around interest rates is increasing,” said Westpac Chief Economist Bill Evans.

Any reading of the Consumer Sentiment Index below 100 indicates the number of consumers who are pessimistic is greater than the number of consumers who are optimistic.

Commonwealth Government bond yields moved higher on the day. By the close of business, the 3-year ACGB yield had gained 5bps to 3.16%, the 10-year yield had added 2bps to 3.53% while the 20-year yield finished 5bps higher at 3.77%.

In the cash futures market, expectations of higher rates eased. At the end of the day, contracts implied the cash rate would rise from the current rate of 1.31% to 1.73% in August and then increase to 2.785% by November. May contracts implied a 3.485% cash rate and August 2023 contracts implied 3.435%.

Four of the five sub-indices registered lower readings, with the “Economic conditions – next 5 years” sub-index posting the largest monthly percentage loss. The reading of the “Family finances – next 12 months” sub-index was the only one to increase and, even then, its rise was negligible.

The Unemployment Expectations index, formerly a useful guide to RBA rate changes, increased from 108.5 to 109.6. Higher readings result from more respondents expecting a higher unemployment rate in the year ahead.

Business conditions weaker but still strong in June

12 July 2022

Summary: Business conditions deteriorate in June, still at elevated level; strong across states, most industries; confidence also deteriorates, below long-term average; due to global uncertainty, looming interest rate hikes, inflation; capacity utilisation rate slips, all 8 sectors of economy above respective long-run averages.

NAB’s business survey indicated Australian business conditions were robust in the first half of 2018, with a cyclical-peak reached in April of that year. Readings from NAB’s index then began to slip and forecasts of a slowdown in the domestic economy began to emerge in the first half of 2019 as the index trended lower. It hit a nadir in April 2020 as pandemic restrictions were introduced but then conditions improved markedly over the next twelve months. Readings have been generally in a historically-normal range since then.

According to NAB’s latest monthly business survey of over 400 firms conducted over the last week and a half of June, business conditions have deteriorated slightly again, albeit to a level which is still elevated. NAB’s conditions index registered 13, down from May’s reading of 15.

“Conditions have remained strong across the states and across most industries, including retail,” said NAB senior economist Brody Viney. However, he noted “soft conditions” in the construction sector “as building costs continue to rise, squeezing profits despite a large ongoing pipeline of work in the sector.”

Business confidence also deteriorated but the change was larger. NAB’s confidence index fell from May’s reading of 6 to 1, a reading which is below the long-term average. Typically, NAB’s confidence index leads the conditions index by one month, although some divergences have appeared from time to time.

Viney put the fall in confidence down to “global uncertainty, looming interest rate hikes and inflation”, especially in the retail sector where confidence took “a significant hit.”

Commonwealth Government bond yields moved higher on the day. By the close of business, the 3-year ACGB yield had gained 5bps to 3.16%, the 10-year yield had added 2bps to 3.53% while the 20-year yield finished 5bps higher at 3.77%.

NAB’s measure of national capacity utilisation paused its recovery from December’s drop and it declined from May’s revised figure of 84.9% to 84.8%. All eight sectors of the economy were reported to be operating above their respective long-run averages.

Capacity utilisation is generally accepted as an indicator of future investment expenditure and it also has a strong inverse relationship with the unemployment rate.

Little evidence of softer US jobs market from June non-farm payroll report

11 July 2022

Summary: Non-farm payrolls up by 372,000 in June, greater than expected; previous two months’ figures revised down by 74,000; jobless rate steady at 3.6%, participation rate slips to 62.2%; little evidence of softer US labour market; jobs-to-population ratio declines; underutilisation rate falls to 6.7%; annual hourly pay growth slows to 5.1%.

The US economy ceased producing jobs in net terms as infection controls began to be implemented in March 2020. The unemployment rate had been around 3.5% but that changed as job losses began to surge through March and April of 2020. The May 2020 non-farm employment report represented a turning point and subsequent months provided substantial employment gains. Changes in recent months have been generally more modest but also well above the long-term monthly average.

According to the US Bureau of Labor Statistics, the US economy created an additional 372,000 jobs in the non-farm sector in June. The increase was in greater than the 250,000 which had been generally expected but slightly lower than the 384,000 jobs which had been added in May after revisions. Employment figures for April and May were revised down by a total of 74,000.

The total number of unemployed decreased by 38,000 to 5.912 million while the total number of people who are either employed or looking for work decreased by 0.353 million to 164.023 million. These changes led to the US unemployment rate remaining stable at April’s rate of 3.6%. The participation rate assisted by slipping from May’s rate of 62.3% to 62.2%.

“If a softer US labour market is part of the solution to the United States’ inflation problem, there was precious little hard evidence of it in Friday’s June payrolls report,” said NAB’s Head of FX Strategy within its FICC division Ray Attrill

US Treasury yields increased on the day, especially at the long end. By the close of business, the 2-year yield had added 2bps to 3.02%, the 10-year yield had gained 7bps to 3.00% while the 30-year yield finished 6bps higher at 3.19%.

In terms of US Fed policy, expectations for a higher federal funds rate over the next 12 months firmed. At the close of business, July contracts implied an effective federal funds rate of 1.68%, 10bps higher than the current spot rate, while September contracts implied 2.495%. July 2023 futures contracts implied an effective federal funds rate of 3.445%, 286bps above the spot rate.

One figure which is indicative of the “spare capacity” of the US employment market is the employment-to-population ratio. This ratio is simply the number of people in work divided by the total US population. It hit a cyclical-low of 58.2 in October 2010 before slowly recovering to just above 61% in late-2019. June’s reading declined from 60.1% to 59.9%, some way from the April 2000 peak reading of 64.7%.

Wage growth spiked in the US during the early stages of pandemic restrictions as lower-paid jobs disappeared at a faster rate relative to higher-paid jobs, disrupting the usual relationship between wage inflation and unemployment rates. Normally, wages tend to grow as the supply of labour tightens.

Apart from the unemployment rate, another measure of tightness in the labour market is the underutilisation rate. The latest reading of it fell from 7.1% in May to 6.7%. Wage inflation and the underutilisation rate usually have an inverse relationship but hourly pay growth in the year to June still slowed from May’s revised rate of 5.3% to 5.1%.

May JOLTS report indicative of “uber-tight” US jobs market

04 July 2022

Summary: US quit rate eases in May; indicative of “still uber-tight labour market”; quits, openings down, separations up; bond yields drop on hawkish FOMC minutes, expectations of higher rates firm.

The number of US employees who quit their jobs as a percentage of total employment increased slowly but steadily after the GFC. It peaked in March 2019 and then tracked sideways until virus containment measures were introduced in March 2020. The quit rate then plummeted as alternative employment opportunities rapidly dried up. Following the easing of US pandemic restrictions, it proceeded to recover back to its pre-pandemic rate in the third quarter of 2020 before trending higher through 2021.

Figures released as part of the most recent Job Openings and Labor Turnover Survey (JOLTS) report show the quit rate eased in May. 2.8% of the non-farm workforce left their jobs voluntarily, down from April’s figure of 2.9%. 57,000 fewer quits and an additional 390,000 people employed in the non-farm sector led to the decline.

Ray Attrill, NAB’s Head of FX Strategy within its FICC division, described the figures as “indicative of a still uber-tight labour market.”

US Treasury yields jumped on the day, especially at the short end of the curve, as markets digested the hawkish message emanating from the minutes of the FOMC’s June meeting. By the close of business, the 2-year Treasury bond yield had gained 18bps to 3.00%, the 10-year yield had added 13bps to 2.93% while the 30-year yield finished 9bps higher at 3.13%.

In terms of US Fed policy, expectations of higher federal funds rates over the next 12 months firmed. At the close of business, July contracts implied an effective federal funds rate of 1.675%, 10bps higher than the current spot rate while September contracts implied a rate of 2.445%. July 2023 futures contracts implied 3.215%, 164bps above the spot rate.

The fall in total quits was led by 33,000 fewer resignations in the “Real estate, rental and leasing” sector while the “Accommodation and food services” sector experienced the single largest rise, increasing by 35,000. Overall, the total number of quits for the month fell from April’s revised figure of 4.327 million to 4.270 million.    

Total vacancies at the end of May decreased by 427,000, or 3.7%, from April’s revised figure of 11.681 million to 11.254 million. The fall was driven by a 325,000 drop in the “Professional and business services” sector as well as a 138,000 decrease in the “Durable Goods” sector. The “Retail trade” sector experienced the single largest increase, rising by 104,000. Overall, 12 out of 18 sectors experienced fewer job openings than in the previous month.

Total separations increased by 18,000, or 0.3%, from April’s revised figure of 5.965 million to 5.983 million. The modest rise was led by the “Real estate, rental and leasing” sector where there were 30,000 more separations than in April. Separations increased in 8 out of 18 sectors.

The “quit” rate time series produced by the JOLTS report is a leading indicator of US hourly pay. As wages account for around 55% of a product’s or service’s price in the US, wage inflation and overall inflation rates tend to be closely related. Former Federal Reserve chief and current Treasury Secretary Janet Yellen was known to pay close attention to it.

Click for more news