News

German output hit hard; euro-zone production contracts in March

13 May 2022

Summary: Euro-zone industrial production down 0.7% in March; slightly worse than expected; annual growth rate reverses, down 0.8%; contracts in all but one of euro-zone’s four largest economies.

Following a recession in 2009/2010 and the debt-crisis which flowed from it, euro-zone industrial production recovered and then reached a peak four years later in 2016. Growth rates then fluctuated for two years before beginning a steady and persistent slowdown from the start of 2018. That decline was transformed into a plunge in March and April of 2020 which then took over a year to claw back. Production in more-recent months has generally stagnated.

According to the latest figures released by Eurostat, euro-zone industrial production contracted by 0.7% in March on a seasonally-adjusted and calendar-adjusted basis. The fall was slightly worse than the 0.5% contraction which had been generally expected and it contrasted with February’s 0.5% rise after revisions. The calendar-adjusted growth rate on an annual basis reversed from February’s revised rate of +1.7% to -0.8%.

German and French sovereign bond yields increased noticeably on the day despite the figures. By the close of business, the German 10-year bund yield had gained 8bps to 0.94% while the French 10-year OAT yield finished 7bps higher at 1.45%.

Industrial production contracted in all but one of the euro-zone’s four largest economies, with Germany’s output hit especially hard. Germany’s production contracted by 5.0% while the growth figures for France, Spain and Italy were -0.5%, 0.0% and -1.8% respectively.

“Some moderation” in US producer price pressures

12 May 2022

Summary: US producer price index (PPI) up 0.5% in April, in line with expectations; annual rate falls from 11.5% to 11.0%; “core” PPI up 0.4%; producer price pressures remain elevated, likely to continue filtering through to consumer prices”; US Treasury yields lower, rate-rise expectations ease.

Around the end of 2018, the annual inflation rate of the US producer price index (PPI) began a downtrend which continued through 2019. Months in which producer prices increased suggested the trend may have been coming to an end, only for it to continue, culminating in a plunge in April 2020. Figures returned to “normal” towards the end of that year but annual rates over the past twelve months have been well above the long-term average.

The latest figures published by the Bureau of Labor Statistics indicate producer prices rose by 0.5% after seasonal adjustments in April. The increase was in line with consensus expectations but considerably less than March’s revised figure of 1.6%. On a 12-month basis, the rate of producer price inflation after seasonal adjustments slowed from March’s revised rate of 11.5% to 11.0%.

Producer prices excluding foods and energy, or “core” PPI, rose by 0.4% after seasonal adjustments. The increase was considerably lower than the 0.7% rise which had been generally expected as well as March’s revised figure of 1.2%. The annual rate decreased from March’s revised rate of 9.5% to 8.8%.

“While the core measures may show some moderation in price pressures, the data shows that producer price pressures remain elevated and this is likely to continue to filter through into consumer prices,” said NAB Head of Markets Strategy Skye Masters.

US Treasury bond yields fell moderately on the day. By the close of business, 2-year and 10-year Treasury yields had both shed 4bps to 2.58% and 2.89% respectively while the 30-year yield finished 3bps lower at 3.02%.

In terms of US Fed policy, expectations of higher federal funds rates over the next 12 months softened. At the close of business, June contracts implied an effective federal funds rate of 1.095%, 26bps higher than the current spot rate. July contracts implied 1.415% while May 2023 futures contracts implied an effective federal funds rate of 2.935%, 210bps above the spot rate.

The producer price index is a measure of prices received by producers for domestically produced goods, services and construction. It is put together in a fashion similar to the consumer price index (CPI) except it measures prices received from the producer’s perspective rather than from the perspective of a retailer or a consumer. It is another one of the various measures of inflation tracked by the US Fed, along with core personal consumption expenditure (PCE) price data.

US CPI exceeds forecasts in April; annual rate slows

11 May 2022

Summary: US CPI up 03% in April, slightly higher than expectations; “core” rate up 0.6%; some measures excluding volatile components beyond food and energy show declines; Treasury yields down but rate rise expectations firm; Fed won’t relax until monthly core inflation measures are closer to 0.2%; non-energy services main driver of headline rise.

The annual rate of US inflation as measured by changes in the consumer price index (CPI) halved from nearly 3% in the period from July 2018 to February 2019. It then fluctuated in a range from 1.5% to 2.0% through 2019 before rising above 2.0% in the final months of that year. Substantially lower rates were reported from March 2020 to May 2020 and they remained below 2% until March 2021. Rates has risen significantly since then.

The latest CPI figures released by the Bureau of Labor Statistics indicated seasonally-adjusted consumer prices rose by 0.3% on average in April. The increase was slightly higher than the generally expected figure of 0.2% but significantly less than March’s 1.2%. On a 12-month basis, the inflation rate slowed from March’s reading of 8.6% to 8.2%.

“Headline” inflation is known to be volatile and so references are often made to “core” inflation for analytical purposes. Core inflation, a measure of inflation which strips out the more variable food and energy components of the index, increased by 0.6% on a seasonally-adjusted basis for the month. The rise was greater than the 0.4% expected, as well as March’s 0.3% increase. However, the annual growth rate still slowed from 6.4% to 6.1%.

“At face value the core CPI measures weren’t overly comforting to policy makers.  However, some measures based on stripping out volatile components beyond food and energy showed declines…,” said NAB senior interest rate strategist Ken Crompton.

Longer-term US Treasury bond yields fell on the day. By the close of business, the 10-year Treasury yield had lost 6bps to 2.93% and the 30-year yield had shed 8bps to 3.05%. The 2-year yield finished 1bp higher at 2.62%.

In terms of US Fed policy, expectations of higher federal funds rates over the next 12 months firmed slightly. At the close of business, June contracts implied an effective federal funds rate of 1.015%, 18bps higher than the current spot rate. July contracts implied 1.435% while May 2023 futures contracts implied an effective federal funds rate of 3.075%, 224bps above the spot rate.

“While it’s likely that the headline inflation number has peaked in the US, the Fed won’t relax until monthly core inflation measures are closer to 0.2%, versus the 0.6% print in April. Service inflation excluding food and energy accelerated in April, suggesting that labour market tightness is still putting upward pressure on prices,” said ANZ senior economist Adelaide Timbrell.

The largest influence on headline results is often the change in fuel prices. “Energy commodities”, the segment which contains vehicle fuels, decreased by 5.4%, subtracting 0.27 percentage points. However, prices of non-energy services, the segment which includes actual and implied rents, had the largest single effect, adding 0.40 percentage points after they increased by 0.7% on average.

Inflation, rising interest rates hit Westpac-MI sentiment index

11 May 2022

Summary: Household sentiment deteriorates for sixth consecutive month in May; rising cost of living pressures, prospect of rising interest rates behind weakness; four of five sub-indices lower; “largest negative reaction” following interest rate rise; respondents more concerned by prospects of unemployment.

After a lengthy divergence between measures of consumer sentiment and business confidence in Australia which began in 2014, confidence readings of the two sectors converged again in mid-July 2018. Both measures then deteriorated gradually in trend terms, with consumer confidence leading the way. Household sentiment fell off a cliff in April 2020 but, after a few months of to-ing and fro-ing, it then staged a full recovery. However, consumer sentiment has deteriorated significantly in recent months, unlike business sentiment.

According to the latest Westpac-Melbourne Institute survey conducted in the first week of May, household sentiment has deteriorated for a sixth consecutive month. Their Consumer Sentiment Index fell from April’s reading of 95.8 to 90.4, a reading which is noticeably lower than the long-term average reading of just over 101.

“The Index is now at its lowest level since August 2020 when households were unnerved by the ‘second wave’ lockdown in Victoria. The weakness in this survey is not related to another pandemic shock but to the combination of rising cost of living pressures and the prospect of rising interest rates,” said Westpac Chief Economist Bill Evans.

Any reading of the Consumer Sentiment Index below 100 indicates the number of consumers who are pessimistic is greater than the number of consumers who are optimistic.

Domestic Treasury bond yields fell on the day. By the close of business, the 3-year ACGB yield had lost 5bps to 3.09%, the 10-year had shed 7bp to 3.54% while the 20-year yield finished 6bps lower at 3.85%.

In the cash futures market, expectations of any material change in the actual cash rate, currently at 0.31%, eased slightly for months from October onwards. At the end of the day, contract prices implied the cash rate would rise to 0.58% in June and then rise to 1.41% by August. May 2023 contracts implied a cash rate of 3.415%, 310bps above the current cash rate.

Four of the five sub-indices registered lower readings, with the “Family finances – next 12 months” sub-index posting the largest monthly percentage loss. The reading of the “Family finances versus a year ago” sub-index was the only one to increase.

“This was the largest negative reaction that has followed an increase in official interest rates,” said Citi economist Josh Williamson. “Rising cost of living pressures likely also added to the negative sentiment but we believe it is also evidence that households could be more sensitive to higher interest rates during the upcoming tightening cycle.” He said rate previous rate rise cycles had begun when the sentiment index had been in positive territory but he also noted current monetary policy was “still highly accommodative.”

The Unemployment Expectations index, formerly a useful guide to RBA rate changes, rose from 99.2 to 109.6. Higher readings result from more respondents expecting a higher unemployment rate in the year ahead.

Confidence, conditions “fairly strong across most industries” in April business survey

10 May 2022

Summary: Business conditions improve in April, at historically-high level; confidence deteriorates, remains above long-term average; confidence, conditions fairly strong across most industries; confidence affected by Federal election, interest rate tightening cycle; capacity utilisation rate up, all 8 sectors of economy at/above respective long-run averages; growth in labour, purchase costs accelerates over past three months, signals “more strong inflation to come”

NAB’s business survey indicated Australian business conditions were robust in the first half of 2018, with a cyclical-peak reached in April of that year. Readings from NAB’s index then began to slip and forecasts of a slowdown in the domestic economy began to emerge in the first half of 2019 as the index trended lower. It hit a nadir in April 2020 as pandemic restrictions were introduced but then conditions improved markedly over the next twelve months. Readings have been generally in a historically-normal range since then.

According to NAB’s latest monthly business survey of over 400 firms conducted over the last week of April, business conditions have improved to a historically-high level. NAB’s conditions index registered 20, up from March’s revised reading of 15.

In contrast, business confidence deteriorated. NAB’s confidence index fell from March’s reading of 16 to 10, thus remaining above the long-term average. Typically, NAB’s confidence index leads the conditions index by approximately one month, although some divergences have appeared in the past from time to time.

“Both confidence and conditions now look fairly strong across most industries, with the exception of transport, utilities and construction where cost pressures have been most acute,” said NAB senior economist Brody Viney.

Short-term Commonwealth Government bond yields fell moderately on the day while longer term yields remained almost steady. By the close of business, the 3-year ACGB yield had shed 5bps to 3.14%, the 10-year yield had returned to its starting point at 3.61% while the 20-year yield finished 1bp higher at 3.91%.

In the cash futures market, expectations of any material change in the actual cash rate, currently at 0.31%, eased slightly. At the end of the day, contract prices implied the cash rate would rise to 0.575% in June and then rise to 1.39% by August. May 2023 contracts implied a cash rate of 3.465%, 315bps above the current cash rate.

“It is understandable that confidence eased somewhat associated with the Federal election which adds to uncertainty around the outlook for public policy. In addition, the beginning of the interest rate tightening cycle is a negative, particularly given the recent aggressive action by the US FOMC,” said Westpac senior economist Andrew Hanlan.

NAB’s measure of national capacity utilisation continued to recover from December’s drop and it rose from March’s revised figure of 83.4% to 83.9%. All eight sectors of the economy were reported to be operating at or above their respective long-run averages.

Capacity utilisation is generally accepted as an indicator of future investment expenditure and it also has a strong inverse relationship with the unemployment rate.

“The growth in both labour costs and purchase costs accelerated in the three months to April, signalling more strong inflation to come, though final product price growth fell a little,” said ANZ senior economist Adelaide Timbrell.

Continued US job creation “inconsistent with Fed inflation view”

06 May 2022

Summary: Non-farm payrolls increase by 428,000 in April; slightly greater than expected figure; previous two months’ figures revised down by 39,000; jobless rate steady at 3.6%, participation rate down; jobs creation inconsistent with Fed’s inflation view if continues; jobs-to-population ratio declines; underutilisation rate ticks up to 7.0%; annual hourly pay growth slows to 5.5%; small fall in participation rate implies no increase in labour supply, will underpin wages growth.

The US economy ceased producing jobs in net terms as infection controls began to be implemented in March 2020. The unemployment rate had been around 3.5% but that changed as job losses began to surge through March and April of 2020. The May 2020 non-farm employment report represented a turning point and subsequent months provided substantial employment gains. Changes in recent months have been generally more modest but usually well above the long-term monthly average.

According to the US Bureau of Labor Statistics, the US economy created an additional 428,000 jobs in the non-farm sector in April. The increase was slightly greater than the 390,000 which had been generally expected earlier in the week but in line with the 428,000 jobs which had been added in March after revisions. Employment figures for February and March were revised down by a total of 39,000.

The total number of unemployed decreased by 11,000 to 5.941 million while the total number of people who are either employed or looking for work decreased by 0.364 million to 163.995 million. These changes led to the US unemployment rate remaining stable at April’s rate of 3.6%. The participation rate declined from March’s revised rate of 62.4% to 62.2%.

“If this strength in jobs creation continues, it will be inconsistent with the Fed’s inflation view and guidance that a 75bps rate rise is not on the table,” said ANZ Head of Australian Economics David Plank.

Longer-term US Treasury yields increased noticeably on the day. By the close of business, the 10-year yield had gained 10bps to 3.14% and the 30-year yield had added 11bps to 3.23%. The 2-year yield finished unchanged at 3.23%.

In terms of US Fed policy, expectations for a higher federal funds rate over the next 12 months softened somewhat. At the close of business, June contracts implied an effective federal funds rate of 1.11%, 28bps higher than the current spot rate. July contracts implied 1.44% while May 2023 futures contracts implied an effective federal funds rate of 2.23%, 140bps above the spot rate.

One figure which is indicative of the “spare capacity” of the US employment market is the employment-to-population ratio. This ratio is simply the number of people in work divided by the total US population. It hit a cyclical-low of 58.2 in October 2010 before slowly recovering to just above 61% in late-2019. April’s reading declined from 60.1% to 60.0%, still some way from the April 2000 peak reading of 64.7%.

Wage growth spiked in the US during the early stages of pandemic restrictions as lower-paid jobs disappeared at a faster rate relative to higher-paid jobs, disrupting the usual relationship between wage inflation and unemployment rates. Normally, wages tend to grow as the supply of labour tightens.

Apart from the unemployment rate, another measure of tightness in the labour market is the underutilisation rate. The latest reading of it ticked up from 6.9% in March to 7.0%. Wage inflation and the underutilisation rate usually have an inverse relationship and hourly pay growth in the year to April slowed from March’s revised rate of 5.6% to 5.5%.

Plank noted “a small fall in the participation rate implies no increase in labour supply from this source. That will underpin wages growth.”

ADP jobs figures underwhelm; small businesses miss out

04 May 2022

Summary: ADP payrolls up 247,000 in April; less than consensus expectations; March rise revised up by 24,000; positions up in medium, large businesses, down in small ones; little over 80% of gains in services sector, again led by leisure/hospitality sector; NAB: should not change expectations for upcoming non-farm payrolls report.

The ADP National Employment Report is a monthly report which provides an estimate of US non-farm employment in the private sector. Since publishing of the report began in 2006, its employment figures have exhibited a high correlation with official non-farm payroll figures, although a large difference can arise in any individual month.

The latest ADP report indicated private sector employment increased by 247,000 in April, less than the 385,000 increase which had been generally expected. March’s rise was revised up by 24,000.

The report came out on the same day the US Fed raised its federal funds target range by 50bps, sending most Treasury bond yields lower in relief the Fed is not considering larger moves. At the close of business, the 2-year Treasury bond yield had shed 11bps to 2.65% and the 10-year yield had lost 3bps to 2.95%. However, the 30-year yield finished 3bps higher at 3.04%.

In terms of US Fed policy, expectations for higher federal funds rates over the next 12 months softened. At the close of business, June contracts implied an effective federal funds rate of 1.105%, 29bps higher than the current spot rate. July contracts implied 1.43% and May 2023 futures contracts implied an effective federal funds rate of 3.14%, 232bps above the spot rate.

Employment numbers in net terms increased at medium-sized and large businesses while contracting in small enterprises. Firms with less than 50 employees lost a net 120,000 positions, mid-sized firms (50-499 employees) added 46,000 positions while large businesses (500 or more employees) accounted for 321,000 more employees.

Employment at service providers accounted for a little over 80% of the total net increase, or 202,000 positions. The “Leisure & Hospitality” sector again was the largest single source of gains, with 77,000 more positions. The “Professional & Business” and “Education & Health” sectors were also significant sources, each adding 50,000 positions and 48,000 positions respectively. Total jobs among goods producers increased by a net 46,000 positions.

Prior to the ADP report, the consensus estimate of the change in April’s official non-farm employment figure was +390,000. NAB’s Head of FX Strategy within its FICC division, Ray Attrill, does not view the ADP report as a useful indicator of official non-farm payrolls and he said the result should not “change expectations for non-farm payrolls at the end of the week, given its non-existent track record in predicting that official figure.” The non-farm payroll report will be released by the Bureau of Labor Statistics this coming Friday night (AEST), 6 May.

US quits hits record high in March, “extremely tight” labour market

03 May 2022

Summary: US quit rate up in March; labour market “extremely tight”; record high for quits series; quits, openings, separations all up.

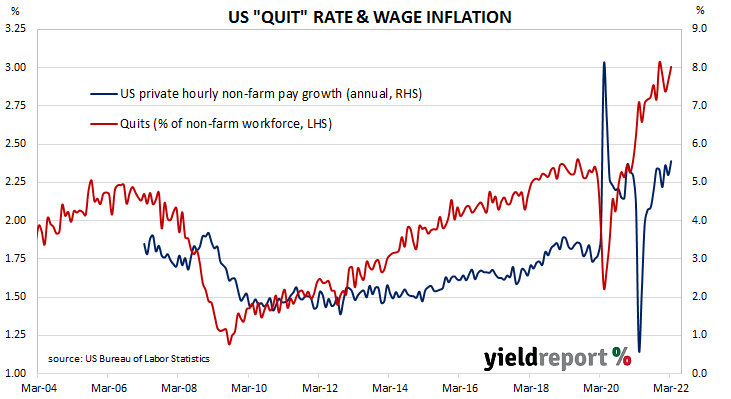
The number of US employees who quit their jobs as a percentage of total employment increased slowly but steadily after the GFC. It peaked in March 2019 and then tracked sideways until virus containment measures were introduced in March 2020. The quit rate then plummeted as alternative employment opportunities rapidly dried up. Following the easing of US pandemic restrictions, it proceeded to recover back to its pre-pandemic rate in the third quarter of 2020 before trending higher through 2021.

Figures released as part of the most recent Job Openings and Labor Turnover Survey (JOLTS) report show the quit rate ticked up again in March. 3.0% of the non-farm workforce left their jobs voluntarily, up from February’s figure of 2.9%. There were 152,000 more quits during the month; this increase outweighed an additional 418,000 people employed in the non-farm sector in percentage terms.

“The [US] labour market is extremely tight and is a major focus for the Fed as it realigns supply and demand in order get inflation sustainably down to target,” said ANZ Head of Australian Economics David Plank. “The strength in demand for jobs was supplemented by a record high in the quits series, often interpreted as a barometer of workers’ willingness to quit and find better opportunities.”

Short-term US Treasury yields moved higher while longer-term yields fell. By the close of business, the 2-year Treasury bond yield had gained 4bps to 2.76%, the 10-year yield had slipped 1bp to 2.97% while the 30-year yield finished 2bps lower at 3.01%.

In terms of US Fed policy, expectations for a higher federal funds rate over the next 12 months firmed. At the close of business, May contracts implied an effective federal funds rate of 0.78%, 45bps higher than the current spot rate. July contracts implied 1.485% and March 2023 futures contracts implied an effective federal funds rate of 3.135%, 280bps above the spot rate.

The rise in total quits was led by 88,000 more resignations in the “Professional and business services” sector while the Construction sector was not far behind with 69,000 more quits. The “Health care and social assistance” sector experienced the single largest fall, declining by 19,000. Overall, the total number of quits for the month rose from February’s revised figure of 4.384 million to 4.536 million.      

Total vacancies at the end of March increased by 205,000, or 1.8%, from February’s revised figure of 11.344 million to 11.549 million. The rise was driven by a 155,000 jump in the “Retail trade” sector and a 103,000 increase in the “Professional and business services” sector. The “Transportation, warehousing, and utilities” sector experienced the single largest decrease, falling by 69,000. Overall, 11 out of 18 sectors experienced more job openings than in the previous month.

Total separations increased by 239,000, or 3.9%, from February’s revised figure of 6.082 million to 6.321 million. The rise was led by the “Professional and business services” sector where there were 76,000 more separations than in February. Separations increased in 12 out of 18 sectors.

The “quit” rate time series produced by the JOLTS report is a leading indicator of US hourly pay. As wages account for around 55% of a product’s or service’s price in the US, wage inflation and overall inflation rates tend to be closely related. Former Federal Reserve chief and current Treasury Secretary Janet Yellen was known to pay close attention to it.


Euro-zone composite index falls again in April

02 May 2022

Summary: Euro-zone composite sentiment index falls from 106.7 to 105.0 in April; below expectations; readings again down all sectors with the exception of services; down in three of four largest euro-zone economies; sovereign bond yields modestly higher; index implies GDP growth of 2.6%.

The European Commission’s Economic Sentiment Indicator (ESI) is a composite index comprising five differently-weighted sectoral confidence indicators.  It is heavily weighted towards confidence surveys from the business sector, with the consumer confidence sub-index only accounting for 20% of the ESI. However, it has a good relationship with euro-zone GDP, although not as a leading indicator.

The ESI posted a reading of 105.0 in April, below the market’s expected figure of 108.0, as well as March’s revised reading of 106.7. The average reading since 1985 has been a touch over 100.

German and French 10-year bond yields finished the day modestly higher. By the close of business, the German bund yield had added 2bps to 0.96% and the French 10-year OAT yield had gained 4bps to 1.49%.

Again, confidence deteriorated in all sectors with the exception of services. On a geographical basis, the ESI fell in three of the euro-zone’s four largest economies, the exception being Italy.

End-of-quarter ESI readings and annual euro-zone GDP growth rates are highly correlated. This latest reading corresponds to a year-to-April GDP growth rate of 2.6%, down from March’s revised growth rate of 3.0%.

ISM PMI lower in April; labour shortages hard to resolve

02 May 2022

Summary: ISM PMI down from 57.1% to 55.4% in April; below expectations; US manufacturing remains constrained, progress on labour shortages slowing; latest reading implies 3.7% 12-month US GDP growth rate in September.

The Institute of Supply Management (ISM) manufacturing Purchasing Managers Index (PMI) reached a cyclical peak in September 2017. It then started a downtrend which ended in March 2020 with a contraction in US manufacturing which lasted until June 2020. Subsequent month’s readings implied growth had resumed, with the index becoming stronger through to March 2021. Since then, readings have remained at elevated levels despite recent declines.

According to the ISM’s April survey, its PMI recorded a reading of 55.4%, below the generally expected figure of 57.7% as well as March’s 57.1%. The average reading since 1948 is 53.0% and any reading above 50% implies an expansion in the US manufacturing sector relative to the previous month.

Timothy Fiore, Chair of the ISM’s Manufacturing Business Survey Committee, said the US manufacturing sector remained constrained by supplier issues. Additionally, progress towards resolving labour shortages had slowed. “Panellists reported higher rates of quits compared to previous months, with fewer panellists reporting improvement in meeting head-count targets.”

Longer-term US Treasury yields increased moderately on the day. By the close of business, the 10-year Treasury bond yield had added 4bps to 2.98% and the 30-year yield had gained 3bps to 3.03%. The 2-year yield finished unchanged at 2.72%.

In terms of US Fed policy, expectations of higher federal funds rates over the next 12 months softened a little. At the close of business, May contracts implied an effective federal funds rate of 0.78%, 45bps higher than the current spot rate. August contracts implied a rate of 1.895% and March 2023 futures contracts implied 3.07%, nearly 275bps above the spot rate.

Purchasing managers’ indices (PMIs) are economic indicators derived from monthly surveys of executives in private-sector companies. They are diffusion indices, which means a reading of 50% represents no change from the previous period, while a reading under 50% implies respondents reported a deterioration on average.

A reading “above 48.7%, over a period of time, generally indicates an expansion of the overall economy”, according to the ISM.

The ISM’s manufacturing PMI figures appear to lead US GDP by several months despite a considerable error in any given month. The chart below shows US GDP on a “year on year” basis (and not the BEA annualised basis) against US GDP implied by monthly PMI figures. 

According to the ISM and its analysis of past relationships between the PMI and US GDP, April’s PMI corresponds to an annualised growth rate of 2.3%, or 0.6% over a quarter. Regression analysis on a year-on-year basis suggests a 12-month GDP growth rate of 3.7% five months after this latest report.

The ISM index is one of two monthly US PMIs, the other being an index published by IHS Markit. IHS Markit also produces a “flash” estimate in the last week of each month which comes out about a week before the ISM index is published. The IHS Markit April flash manufacturing PMI registered 59.7%, 0.9 percentage points higher than March’s final figure.

Click for more news