News

Down but not out; US CPI higher than expected in September

10 October 2024

Summary: US CPI up 0.2% in September, in line with expectations; annual inflation rate slows from 2.6% to 2.4%; “core” rate up 0.3%, up 3.3% over year; Westpac: report a reminder inflation is down but not yet out; US Treasury yields generally fall; rate-cut expectations firm; non-energy services again main driver of overall result.

The annual rate of US inflation as measured by changes in the consumer price index (CPI) halved from nearly 3% in the period from July 2018 to February 2019. It then fluctuated in a range from 1.5% to 2.0% through 2019 before rising above 2.0% in the final months of that year. Substantially lower rates were reported from March 2020 to May 2020 and they remained below 2% until March 2021. They then rose significantly before declining from mid-2022.

The latest US CPI figures released by the Bureau of Labor Statistics indicated seasonally-adjusted consumer prices increased by 0.2% on average in September. The rise was slightly above the 0.2% increase which had been generally expected but it was in line with increases in July and August. On a 12-month basis, the inflation rate slowed from 2.6% to 2.4%.

“Headline” inflation is known to be volatile and so references are often made to “core” inflation for analytical purposes. The core prices index, the index which excludes the more variable food and energy components, increased by 0.3% on a seasonally-adjusted basis over the month, above the 0.2% rise which had been generally expected but in line with August’s rise. The annual growth rate remained steady at 3.3%.

“A marginally hotter-than-expected US inflation report was a reminder that inflation is down but not yet out, supporting a more gradual pace of policy easing,” said Westpac economist Jameson Coombs.

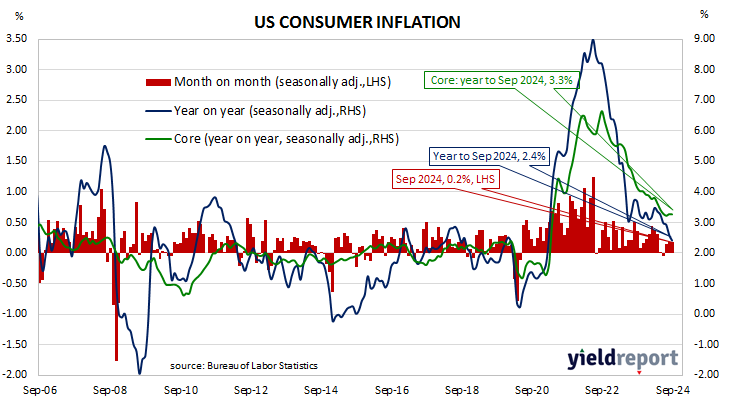
US Treasury bond yields generally fell on the day, the exception being ultra-long yields which rose modestly. By the close of business, the 2-year Treasury yield had shed 6bps to 3.96%, the 10-year yield had slipped 1bp to 4.06% while the 30-year yield 2bps higher at 4.36%.

In terms of US Fed policy, expectations of a lower federal funds rate in the next 12 months firmed, with at least another six 25bp cuts priced in. At the close of business, contracts implied the effective federal funds rate would average 4.665% in November, 17bps less the current rate, 4.515% in December and 4.175% in February. September 2025 contracts implied 3.50%, 133bps less than the current rate.

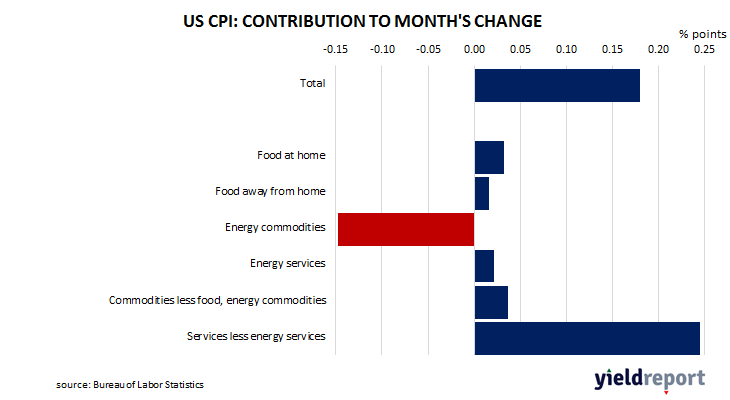
The largest influence on headline results is often the change in fuel prices. Prices of “Energy commodities”, the segment which contains vehicle fuels, decreased by 0.4% and contributed -0.15 percentage points to the total. However, prices of non-energy services, the segment which includes actual and implied rents, again had the largest single effect on the total as they contributed 0.25 percentage points following a 0.4% increase on average.

Latest job ads gain relatively broad-based; up 1.6% in September

08 October 2024

Summary: Job ads up 1.6% in September; 19.8% lower than September 2023; ANZ: could signal declining trend is slowing; ACGB yields generally fall; rate-cut expectations firm; Indeed: gains relatively broad-based; ad index-to-workforce ratio increases.

From mid-2017 onwards, year-on-year growth rates in the total number of Australian job advertisements consistently exceeded 10%. That was until mid-2018 when the annual growth rate fell back markedly. 2019 was notable for its reduced employment advertising and this trend continued into the first quarter of 2020. Advertising then plunged in April and May of 2020 as pandemic restrictions took effect but recovered quite quickly, reaching historically-high levels in 2022.

According to the latest reading of the ANZ-Indeed Job Ads Index, total job advertisements in September increased by 1.6% on a seasonally adjusted basis. Their index rose from 112.5 in August after revisions to 114.3, with the gain following falls of 1.8% in August and 2.5% in July. On a 12-month basis, total job advertisements were 19.8% lower than in September 2023, up from August’s revised figure of -22.4%.

“While the series is down 15.8% since January, this could signal the trend of decline since 2022 is slowing,” said ANZ economist Madeline Dunk.

The figures came out on the same day as several other private sector surveys and Commonwealth Government bond yields generally fell, although ultra-long yields rose in what was probably a catch up from the previous day’s lack of movement. By the close of business, the 3-year ACGB yield had shed 7bps to 3.69%, the 10-year yield had lost 5bps to 4.17% while the 20-year yield finished 7bps higher at 4.56%.

Expectations regarding rate cuts in the next twelve months firmed, with a February 2025 rate cut priced in as an 80% probability. Cash futures contracts implied an average of 4.315% in November, 4.245% in December and 4.175% in February 2025. September 2025 contracts implied 3.675%, 66bps less than the current cash rate.

“Overall, Job Ads in September rose in three-quarters of occupations, compared to half in August, indicating that gains were relatively broad-based,” said Indeed Senior Economist Callam Pickering.

The inverse relationship between job advertisements and the unemployment rate or the underemployment rate has been quite strong (see below chart), although ANZ themselves called the relationship between the series into question in early 2019. 

A higher job advertisement index as a proportion of the labour force is suggestive of lower unemployment rates in the near future while a lower ratio suggests higher unemployment rates will follow. September’s ad index-to-workforce ratio increased from 0.75 after revisions to 0.76.

In 2008/2009, advertisements plummeted and Australia’s unemployment rate jumped from 4% to nearly 6% over a period of 15 months. When a more dramatic fall in advertisements took place in April 2020, the unemployment rate responded much more quickly.

“Promising” jump for consumer confidence index in October

08 October 2024

Summary: Westpac-Melbourne Institute consumer sentiment index rises in October; Westpac: best since RBA rate tightening phase began; ACGB generally fall; rate-cut expectations firm; Westpac: consumers no longer fearful RBA could take interest rates higher; all five sub-indices rise; fewer respondents expecting higher jobless rate.

After a lengthy divergence between measures of consumer sentiment and business confidence in Australia which began in 2014, confidence readings of the two sectors converged again in mid-July 2018. Both measures then deteriorated gradually in trend terms, with consumer confidence leading the way. Household sentiment fell off a cliff in April 2020 but, after a few months of to-ing and fro-ing, it then staged a full recovery. However, consumer sentiment then weakened considerably and has languished at pessimistic levels since mid-2022 while business sentiment has been more robust.

According to the latest Westpac-Melbourne Institute survey conducted over the first week of October, household sentiment improved markedly, albeit to a level which is still on the pessimistic side. Their Consumer Sentiment Index jumped from September’s reading of 84.6 to 89.8, a reading which is significantly lower than the long-term average reading of just over 101 and at the lower bound of the “normal” range.

“This is the most promising update we have seen over the cycle to date,” said Westpac senior economist Matthew Hassan. “While pessimism still dominates, the October consumer sentiment read is the best since the RBA interest rate tightening phase began two and a half years ago.”

Any reading of the Consumer Sentiment Index below 100 indicates the number of consumers who are pessimistic is greater than the number of consumers who are optimistic.

The figures came out on the same day as two other private sector surveys and Commonwealth Government bond yields generally fell, although ultra-long yields rose in what was probably a catch up from the previous day’s lack of movement. By the close of business, the 3-year ACGB yield had shed 7bps to 3.69%, the 10-year yield had lost 5bps to 4.17% while the 20-year yield finished 7bps higher at 4.56%.

Expectations regarding rate cuts in the next twelve months firmed, with a February 2025 rate cut priced in as an 80% probability. Cash futures contracts implied an average of 4.315% in November, 4.245% in December and 4.175% in February 2025. September 2025 contracts implied 3.675%, 66bps less than the current cash rate.

“Expectations have been buoyed by interest rate cuts abroad and more promising signs that inflation is moderating locally,” Hassan added. “Consumers are no longer fearful that the RBA could take interest rates higher. However, responses around family finances suggest progress on cost-of-living pressures, the main source of negative sentiment reads overall, is still slow.”

All five sub-indices registered higher readings, with the “Economic conditions – next 12 months” sub-index posting the largest monthly percentage gain. 

The Unemployment Expectations index, formerly a useful guide to RBA rate changes, fell from 138.4 to 129.8, essentially in line with the long-term average of 129.1. Lower readings result from fewer respondents expecting a higher unemployment rate in the year ahead.

NAB business indices up in September; conditions finding a “floor”

08 October 2024

Summary: Business conditions improve in September; business confidence also improves, still well below average; NAB: some encouraging signs for soft landing; ACGB generally fall; rate-cut expectations firm; Westpac: tentative signs business conditions finding a floor; capacity utilisation rate rises, at elevated level.

NAB’s business survey indicated Australian business conditions were robust in the first half of 2018, with a cyclical-peak reached in April of that year. Readings from NAB’s index then began to slip and forecasts of a slowdown in the domestic economy began to emerge in the first half of 2019 as the index trended lower. It hit a nadir in April 2020 as pandemic restrictions were introduced but then improved markedly over the next twelve months and has subsequently remained at robust levels until recently.

According to NAB’s latest monthly business survey of around 350 firms conducted in the last week of September, business conditions have improved back to a level in line with the long-term average. NAB’s conditions index registered 7 points, up 4 points from August’s reading.

Business confidence also improved.  NAB’s confidence index rose 3 points to -2 points, a reading which is still well below the long-term average.  NAB’s confidence index typically leads the conditions index by one month, although some divergences have appeared from time to time.

“Overall, the business survey points to some encouraging signs as the RBA attempts to come in for a soft landing,” said NAB Head of Australian Economics Gareth Spence. “While we would like to see the easing in price growth maintained over coming months, and for conditions to hold up even if just at around average levels, for now the trends remain encouraging.”

The figures came out on the same day as two other private sector surveys and Commonwealth Government bond yields generally fell, although ultra-long yields rose in what was probably a catch up from the previous day’s lack of movement. By the close of business, the 3-year ACGB yield had shed 7bps to 3.69%, the 10-year yield had lost 5bps to 4.17% while the 20-year yield finished 7bps higher at 4.56%.

Expectations regarding rate cuts in the next twelve months firmed, with a February 2025 rate cut priced in as an 80% probability. Cash futures contracts implied an average of 4.315% in November, 4.245% in December and 4.175% in February 2025. September 2025 contracts implied 3.675%, 66bps less than the current cash rate.

“After two years of an unfolding economic slowdown, there are tentative signs that business conditions are finding its floor,” said Westpac economist Ryan Wells. “That said, businesses remain somewhat pessimistic on the outlook, suggesting there is still some time before a meaningful pick-up in confidence takes hold.”

NAB’s measure of national capacity utilisation increased from August’s upwardly-revised reading of 83.0% to 83.1%, a level which is quite elevated from a historical perspective. Seven of the eight sectors of the economy were reported to be operating at or above their respective long-run averages, the wholesale sector remaining the one exception.

Capacity utilisation is generally accepted as an indicator of future investment expenditure and it also has a strong inverse relationship with Australia’s unemployment rate.

MI Inflation Gauge ticks up in September; annual rate 2.6%

07 October 2024

Summary: Melbourne Institute Inflation Gauge index up 0.1% in September; up 2.6% on annual basis; ACGB yields jump; rate-cut expectations soften, February cut no longer fully priced in.

The Melbourne Institute’s Inflation Gauge is an attempt to replicate the ABS consumer price index (CPI) on a monthly basis. It has turned out to be a reliable leading indicator of the CPI, although there are periods in which the Inflation Gauge and the CPI have diverged for as long as twelve months. On average, the Inflation Gauge’s annual rate tends to overestimate the ABS rate by around 0.1%, or at least until recently.

The Melbourne Institute’s latest reading of its Inflation Gauge index indicates consumer prices increased by 0.1% in September, in contrast with the 0.1% decline in August and less than July’s 0.4% increase. Inflation on an annual basis accelerated from 2.5% to 2.6%.

Commonwealth Government bond yields generally jumped on the day in a manner similar to the movements of US Treasury yields on Friday night. By the close of business, the 3-year ACGB yield had gained 20bps to 3.76%, the 10-year yield had added 14bps to 4.22% while the 20-year yield finished unchanged at 4.49%.

Expectations regarding rate cuts in the next twelve months softened, and a February 2025 rate cut is no longer fully priced in. Cash futures contracts implied an average of 4.315% in November, 4.275% in December and 4.19% in February 2025. However, September 2025 contracts implied 3.72%, 62bps less than the current cash rate.

Given the Inflation Gauge’s tendency to overestimate, the latest figures imply an official CPI reading of -0.1% (seasonally adjusted) for the September quarter or 2.5% in annual terms. However, it is worth noting the annual CPI rate to the end of March 2023 was 7.0% while the Inflation Gauge had implied a 5.7% annual rate at the time.

September US job gains broad-based; jobless rate 4.1%

04 October 2024

Summary: US non-farm payrolls up 254,000 in September, above expectations; previous two months’ figures revised up by 72,000; jobless rate ticks down to 4.1%, participation rate steady at 62.7%; ANZ: gains are broad-based; US Treasury yields rise significantly; expectations of Fed rate cuts softens, five cuts still priced in; employed-to-population ratio steady at 60.0%; underutilisation rate declines to 7.7%; annual hourly pay growth accelerates to 4.0%.

The US economy ceased producing jobs in net terms as infection controls began to be implemented in March 2020. The unemployment rate had been around 3.5% but that changed as job losses began to surge through March and April of 2020. The May 2020 non-farm employment report represented a turning point and subsequent months provided substantial employment gains which have continued to the present.

According to the US Bureau of Labor Statistics, the US economy created an additional 254,000 jobs in the non-farm sector in September. The increase was greater than the 140,000 rise which had been generally expected as well as the 159,000 jobs which had been added in August after revisions. Employment figures for August and July were revised up by a total of 72,000.

The total number of unemployed decreased by 281,000 to 6.834 million while the total number of people who were either employed or looking for work increased by 149,000 to 168.698 million. These changes led to the US unemployment rate ticking down from 4.2% in August to 4.1%. The participation rate remained steady at 62.7%.

“The job gains were broad-based; private sector payrolls rose 223,000 and government payrolls were up 31,000,” said ANZ economist Sophia Angala.

US Treasury bond yields rose significantly across a much-flattened curve on the day. By the close of business, the 2-year yield had jumped 21bps to 3.92%, the 10-year yield had gained 11bps to 3.96% while the 30-year yield finished 7bps higher at 4.25%.

In terms of US Fed policy, expectations of a lower federal funds rate in the next 12 months softened, although at least another five 25bp cuts are still factored in. At the close of business, contracts implied the effective federal funds rate would average 4.63% in November, 20bps less the current rate, 4.445% in December and 4.075% in February. September 2025 contracts implied 3.465%, 136bps less than the current rate.

One figure which is indicative of the “spare capacity” of the US employment market is the employment-to-population ratio. This ratio is simply the number of people in work divided by the total US population. It hit a cyclical-low of 58.2 in October 2010 before slowly recovering to just above 61% in early 2020. September’s reading remained unchanged at 60.0%, some way from the April 2000 peak reading of 64.7%.

Apart from the unemployment rate, another measure of tightness in the labour market is the underutilisation rate. The underutilisation rate registered 7.7% in September, down from August’s figure of 7.7%. Wage inflation and the underutilisation rate usually have an inverse relationship and private hourly pay growth in the year to September accelerated from 3.9% to 4.0%.

Queensland, investors, drive home loan approvals higher in August

04 October 2024

Summary: Value of loan commitments up 1.0% in August, in line with expectations; 23.0% higher than August 2023; ANZ: lending strongest in Queensland; ACGB yields rise; rate-cut expectations soften; Westpac: expansion in housing credit significantly more rapid among investors; value of owner-occupier loan approvals up 0.7%; value of investor approvals up 1.4%; number of owner-occupier home loan approvals down 1.0%.

The number and value of home-loan approvals began to noticeably increase after the RBA reduced its cash rate target in a series of cuts beginning in mid-2019, potentially ending the downtrend which had been in place since mid-2017. Figures from February through to May of 2020 provided an indication the downtrend was still intact but subsequent figures then pushed both back to record highs in 2021. After a considerable pullback in 2022 both the value and number of approved loans resumed rising in 2023.

August’s housing finance figures have now been released and total loan approvals excluding refinancing rose by 1.0% In dollar terms over the month, in line with expectations but down from July’s downwardly-revised 3.5% increase. On a year-on-year basis, total approvals excluding refinancing were 23.0% higher than in August 2023, down from July’s comparable figure of 25.0%.

“Across the country, lending is strongest in Queensland, where it is up 41.0% year on year. Investor lending in Queensland is also the strongest in the country, up 58.5% year on year,” said ANZ economist Madeline Dunk.

Commonwealth Government bond yields rose almost uniformly across the curve on the day, largely in line with movements of US Treasury yields on Thursday night. By the close of business, 3-year and 10-year ACGB yields had both gained 7bps to 3.56% and 4.08% while the 20-year yield finished 6bps higher at 4.49%.

Expectations regarding rate cuts in the next twelve months softened, albeit with a February 2025 rate cut still almost fully priced in. Cash futures contracts implied an average of 4.30% in November, 4.225% in December and 4.12% in February 2025. September 2025 contracts implied 3.495%, 94bps less than the current cash rate.

“The rise in financing activity has been broad-based across both owner-occupiers and investors though the expansion in housing credit has been significantly more rapid amongst investors,” said Westpac economist Jameson Coombs. “There was no change to this dynamic in August, with owner-occupier financing activity up 0.7% in the month compared to a 1.4% monthly gain in new investor credit. In annual terms, growth in investor housing finance commitments is running at about double the pace of that of owner-occupiers.”

The total value of owner-occupier loan commitments excluding refinancing increased by 0.7%, down from July’s 2.5% rise. On an annual basis, owner-occupier loan commitments were 16.8% higher than in August 2023, down from July’s comparable figure of 19.8%.

The total value of investor commitments excluding refinancing increased by 1.4%. The rise follows a 5.1% increase in July, taking the growth rate over the previous 12 months from 34.4% to 34.2%.

The total number of loan commitments to owner-occupiers excluding refinancing declined by 1.0% to 26973 on a seasonally adjusted basis, in contrast with July’s 1.9% rise. The annual growth rate slowed from 11.0% after revisions to 6.8%.

US quit rate continues slide in August; more openings, fewer separations

01 October 2024

Summary: US quit rate ticks down to 1.9% in August; UBS: back to 2015 levels; US Treasury yields fall; expectations of Fed rate cuts soften, seven cuts still priced in; ANZ: US labour market effectively in balance; fewer quits, more openings, fewer separations; ANZ: job vacancies lowest since January 2021.

The number of US employees who quit their jobs as a percentage of total employment increased slowly but steadily after the GFC. It peaked in March 2019 and then tracked sideways until virus containment measures were introduced in March 2020. The quit rate then plummeted as alternative employment opportunities rapidly dried up. Following the easing of US pandemic restrictions, it proceeded to recover back to its pre-pandemic rate in the third quarter of 2020 and trended higher through 2021 before easing through 2022, 2023 and the first half of 2024.

Figures released as part of the latest Job Openings and Labor Turnover Survey (JOLTS) report show the quit rate ticked lower in August after revisions. 1.9% of the non-farm workforce left their jobs voluntarily, down from July’s downwardly-revised rate of 2.0%. Quits in the month decreased by 159,000 while an additional 142,000 people were employed in non-farm sectors.

“Quits continued to trend down and the total quit rate fell another tenth to 1.9%, also a new low for the expansion, and back to 2015 levels,” said UBS economist Amanda Wilcox.

US Treasury bond yields fell almost uniformly across the curve on the day. By the close of business, the 2-year Treasury bond yield had lost 4bps to 3.60% while 10-year and 30-year yields both finished 5bps lower at 3.73% and 4.07% respectively.

In terms of US Fed policy, expectations of a lower federal funds rate in the next 12 months softened, although at least another seven 25bp cuts are still factored in. At the close of business, contracts implied the effective federal funds rate would average 4.525% in November, 4.32% in December and 3.80% in February. September 2025 contracts implied 3.025%, 180bps less than the current rate.

“The JOLTS data point to a labour market effectively in balance,” said ANZ FX analyst Ryan Wells. “The job openings data for the last day of August and the initial claims data for the survey week in September are pointing to a firmer September labour market report than in August.”

The fall in total quits was led by 63,000 fewer resignations in the “Accommodation and food services” sector while the “Professional and business services” sector experienced the largest increase, 73,000. Overall, the total number of quits for the month decreased from July’s revised figure of 3.243 million to 3.084 million.              

Total vacancies at the end of August increased by 329,000, or 4.3%, from July’s revised figure of 7.711 million to 8.040 million. The rise was driven by 138,000 more open positions in the “Construction” sector while the “Other services” sector experienced 93,000 fewer offerings, the single largest decrease. Overall, 9 out of 18 sectors experienced more job openings than in the previous month.  

Total separations decreased by 317,000, or 6.0%, from July’s revised figure of 5.314 million to 4.997 million. The fall was led by the “Accommodation and food services” sector where there were 111,000 fewer separations while the “Professional and business services” sector experienced 149,000 more separations. Separations decreased in 15 of the 18 sectors.

The “quit” rate time series produced by the JOLTS report is a leading indicator of US hourly pay. As wages account for around 55% of a product’s or service’s price in the US, wage inflation and overall inflation rates tend to be closely related. Former Federal Reserve chief and current Treasury Secretary Janet Yellen was known to pay close attention to it.

ISM PMI steady in September; US manufacturing contracts again

01 October 2024

Summary: ISM manufacturing PMI steady in September, below expectations; ISM: demand weak, output declines, inputs accommodative; US Treasury yields fall; expectations of Fed rate cuts soften, seven cuts still priced in; ISM: reading corresponds to 1.3% US GDP growth annualised.

The Institute of Supply Management (ISM) manufacturing Purchasing Managers Index (PMI) reached a cyclical peak in September 2017. It then started a downtrend which ended in March 2020 with a contraction in US manufacturing which lasted until June 2020. Subsequent month’s readings implied growth had resumed, with the index becoming stronger through to March 2021. Readings then declined fairly steadily until mid-2023 and have since generally stagnated.

According to the ISM’s September survey, its manufacturing PMI recorded a reading of 47.2%, below the generally expected figure of 47.6% but in line with August’s reading. The average reading since 1948 is roughly 53.0% and any reading below 50% implies a contraction in the US manufacturing sector relative to the previous month.

“US manufacturing activity contracted again in September, and at the same rate compared to last month,” said Timothy Fiore of the ISM Manufacturing Business Survey Committee. “Demand continues to be weak, output declined and inputs stayed accommodative.”

US Treasury bond yields fell almost uniformly across the curve on the day. By the close of business, the 2-year Treasury bond yield had lost 4bps to 3.60% while 10-year and 30-year yields both finished 5bps lower at 3.73% and 4.07% respectively.

In terms of US Fed policy, expectations of a lower federal funds rate in the next 12 months softened, although at least another seven 25bp cuts are still factored in. At the close of business, contracts implied the effective federal funds rate would average 4.525% in November, 4.32% in December and 3.80% in February. September 2025 contracts implied 3.025%, 180bps less than the current rate.

Purchasing managers’ indices (PMIs) are economic indicators derived from monthly surveys of executives in private-sector companies. They are diffusion indices, which means a reading of 50% represents no change from the previous period, while a reading under 50% implies respondents reported a deterioration on average. A reading “above 42.5%, over a period of time, generally indicates an expansion of the overall economy” according to the ISM’s latest calculations.      

The ISM’s manufacturing PMI figures appear to lead US GDP by several months despite a considerable error in any given month. The chart below shows US GDP on a “year on year” basis (and not the BEA annualised basis) against US GDP implied by monthly PMI figures. 

According to the ISM and its analysis of past relationships between the PMI and US GDP, August’s PMI corresponds to an annualised growth rate of 1.3%, or about 0.3% over a quarter. Regression analysis on a year-on-year basis suggests a 12-month GDP growth rate of 1.7% five months after this latest report.

The ISM index is one of two monthly US PMIs, the other being an index published by S&P Global. S&P Global produces a “flash” estimate in the last week of each month which comes out about a week before the ISM index is published. The S&P Global August flash manufacturing PMI registered 48.0%, down 1.6 percentage points from July’s final figure.

Retail sales up 0.7% in August; tax cuts kick in

01 October 2024

Summary: Retail sales up 0.7% in August, more than expected; up 3.1% on 12-month basis; ANZ: lift broad-based, across all states, territories; ACGB yields rise modestly; rate-cut expectations soften, Feb cut still almost fully priced in; Westpac: sceptical about weather explanation, tax cuts the more likely driver; largest influence on result again from food sales.

Growth figures of domestic retail sales spent most of the 2010s at levels below the post-1992 average. While economic conditions had been generally favourable, wage growth and inflation rates were low. Expenditures on goods then jumped in the early stages of 2020 as government restrictions severely altered households’ spending habits. Households mostly reverted to their usual patterns as restrictions eased in the latter part of 2020 and throughout 2021.

According to the latest ABS figures, total retail sales increased by 0.7% on a seasonally adjusted basis in August. The result was greater than the 0.4% increase which had been generally expected as well as July’s 0.1% rise. Sales increased by 3.1% on an annual basis, up from July’s comparable figure of 2.4%.

“The lift was broad-based, with all states and territories and all categories, apart from household goods, seeing a lift in retail spending,” said ANZ economist Madeline Dunk. “It is likely that the lift to household disposable incomes from the Stage 3 tax cuts and cost-of-living measures supported spending in August.”

The update was released at the same time as August dwelling approvals figures and Commonwealth Government bond yields generally moved modestly higher across a flatter curve on the day. By the close of business, the 3-year ACGB yield had gained 3bps to 3.49%, the 10-year yield had added bp to 4.01% while the 20-year yield finished unchanged at 4.43%.

Expectations regarding rate cuts in the next twelve months softened a little, albeit with a February 2025 rate cut still almost fully priced in. Cash futures contracts implied an average of 4.305% in November, 4.22% in December and 4.11% in February 2025. August 2025 contracts implied 3.415%, 92bps less than the current cash rate.

“We are sceptical about the weather explanation and instead see tax cuts as the more likely driver,” said Westpac economist Neha Sharma. “This time last year, nominal retail sales growth was flat. This was despite August 2023 being the second warmest August since 1910. So while part of today’s results may be due to warm weather, we suspect the rise is more to do with the stage 3 tax cuts and other fiscal measures starting to filter through to spending.”

Retail sales are typically segmented into six categories (see below), with the “Food” segment accounting for 40% of total sales. Accordingly, the largest influence on the month’s total again came from this segment after sales rose by 0.6%.

Click for more news