News

Business conditions improve but confidence falls in NAB November survey

14 December 2021

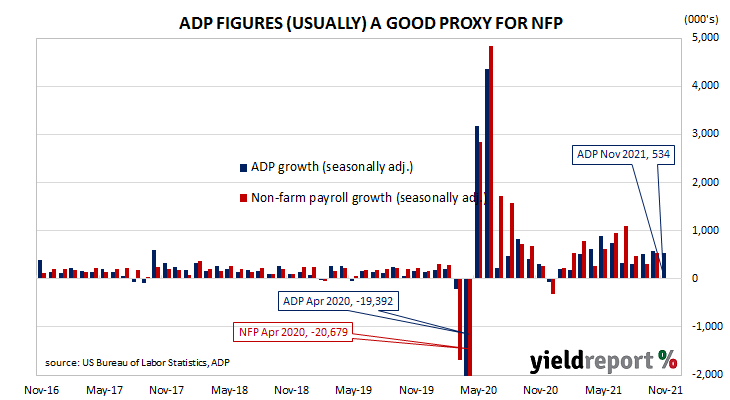
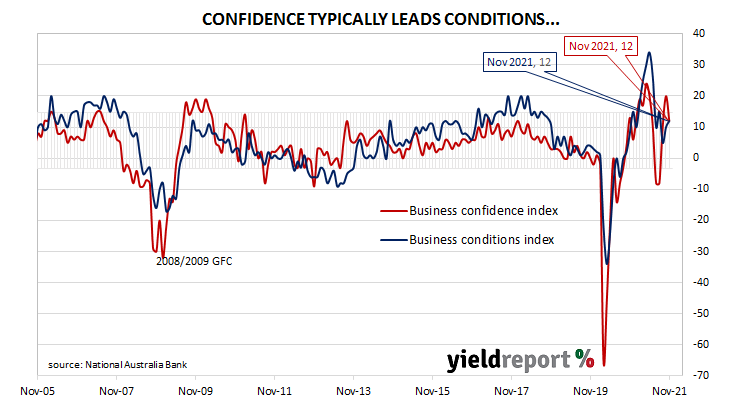
Summary: Business conditions improve in November; confidence deteriorates; conditions “well above” long-run average; strong recovery underway, economy “well placed” to carry momentum forward; capacity utilisation rate rises again; all eight sectors of economy at/above respective long-run averages.

NAB’s business survey indicated Australian business conditions were robust in the first half of 2018, with a cyclical-peak reached in April of that year. Readings from NAB’s index then began to slip, declining to below-average levels by the end of 2018. Forecasts of a slowdown in the domestic economy began to emerge in the first half of 2019 and the index trended lower, hitting a nadir in April 2020 as pandemic restrictions were introduced. Conditions improved markedly over the next twelve months, only to fall back in the middle of this year.

According to NAB’s latest monthly business survey of over 450 firms conducted over the last week and a half of November, business conditions have improved slightly. NAB’s conditions index registered 12, up from October’s revised reading of 10.

In contrast, business confidence deteriorated. NAB’s confidence index fell from October’s revised reading of 20 to 12, a reading still above the long-term average. Typically, NAB’s confidence index leads the conditions index by approximately one month, although some divergences have appeared in the past from time to time.

“While this result was a little underwhelming, given further easing of restrictions, conditions were well above the long-run average of +5.8,” said ANZ senior economist Catherine Birch.

Commonwealth Government bond yields fell noticeably on the day, outgunning modest falls in US Treasury yields overnight. By the close of business, the 3-year ACGB yield had shed 5bps to 1.02%, the 10-year yield had lost 6bps to 1.55% while the 20-year yield finished 7 bps lower at 2.09%.

In the cash futures market, expectations of any material change in the actual cash rate, currently at 0.04%, remained fairly soft. At the end of the day, contract prices implied the cash rate would not exceed the RBA’s 0.10% target rate until May 2022 but then rise to 0.755% by December 2022 and to 1.255% by March 2023.

“Overall, these results indicate a strong recovery is underway…Notwithstanding the possibility of new disruptions related to the Omicron variant, the economy is well placed to carry this momentum forward over coming months and into 2022,” said NAB Chief Economist Alan Oster.

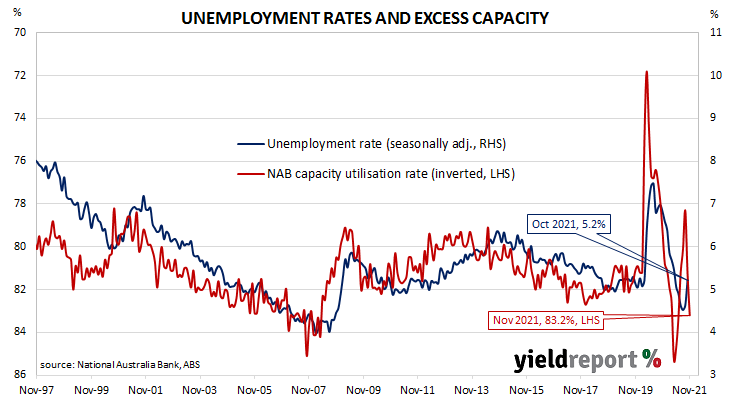
NAB’s measure of national capacity utilisation again increased noticeably, this time from October’s revised figure of 81.2% to 83.2%. All eight sectors of the economy were reported to be operating at or above their respective long-run averages.

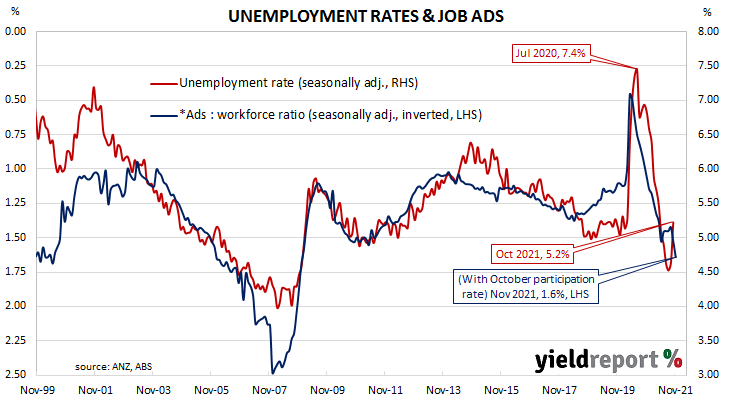
Capacity utilisation is generally accepted as an indicator of future investment expenditure and it also has a strong inverse relationship with the unemployment rate.

US Consumer Sentiment index up in December; signs of “emerging wage-price spiral”

10 December 2021

Summary: US consumer confidence improves slightly in December; University of Michigan index above consensus figure; views of present conditions, future conditions both improve; large disparity between top and bottom income groups reminiscent of 1980; income expectations similar to 1981, emerging wage-price spiral “could propel inflation higher”.

US consumer confidence started 2020 at an elevated level but, after a few months, surveys began to reflect a growing unease with the global spread of COVID-19 and its reach into the US. Household confidence plunged in April 2020 and then recovered in a haphazard fashion, generally fluctuating at below-average levels according to the University of Michigan. The University’s measure of confidence had recovered back to the long-term average by April 2021 but then plunged again in the September quarter.

The latest survey conducted by the University indicates confidence among US households improved slightly on average in December. The preliminary reading of the Index of Consumer Sentiment registered 70.4, above the generally expected figure of 68.0 and November’s final figure of 67.4. Consumers’ views of current conditions and expectations regarding future conditions both improved in comparison to those held at the time of the November survey.

The report was released on the same day as November’s consumer price index and US Treasury bond yields generally declined on the day. By the close of business, the 2-year Treasury yields had shed 3bps to 0.66%, the 10-year yield had lost 2bps to 1.48% while the 30-year yield finished unchanged at 1.88%.

 “The more interesting result was the large disparity between monthly gain among households with incomes in the lowest third of the income distribution compared with the modest losses among households in the middle and top third,” said the University’s Surveys of Consumers chief economist, Richard Curtin. He noted the last time such a large gap had been present was in 1980 when households in the lowest income bracket had signalled the end of the first part of the double-dip recession which occurred through 1980 to 1982.

Curtin also compared current expectations of income gains of 2.9% by people in this lowest income category with similar expectations from 1981, coming to the conclusion “an emerging wage-price spiral that could propel inflation higher in the years ahead.” 76% of all respondents choose inflation over employment as the more serious problem facing the US.

More-confident households are generally inclined to spend more and save less; some increase in household spending could be expected to follow. As private consumption expenditures account for a majority of GDP in advanced economies, a higher rate of household spending growth would flow through to higher GDP growth if other GDP components did not compensate.

US annual CPI up nearly 7% in November; underlying inflation pressures “intensifying”

10 December 2021

Summary: US CPI increases by 0.8% in November, more than 0.7% expected; “core” rate up 0.5%, in line with expectations; core CPI “not yet peaked”; underlying inflation pressures “intensifying”; fuel prices, rents, commodities main drivers of headline rise.

The annual rate of US inflation as measured by changes in the consumer price index (CPI) halved from nearly 3% in the period from July 2018 to February 2019. It then fluctuated in a range from 1.5% to 2.0% through 2019 before rising above 2.0% in the final months of that year. Substantially lower rates were reported from March 2020 to May 2020 and they remained below 2% until March this year. Rates has risen significantly since then.

The latest CPI figures released by the Bureau of Labor Statistics indicated seasonally-adjusted consumer prices increased by 0.8% on average in November. The result was higher than the 0.7% consensus expectation but slightly lower than October’s 0.9% rise. On a 12-month basis, the inflation rate accelerated from October’s seasonally adjusted reading of 6.2% to 6.9%.

“Headline” inflation is known to be volatile and so references are often made to “core” inflation for analytical purposes. Core inflation, a measure of inflation which strips out the more variable food and energy components of the index, increased by 0.5% on a seasonally-adjusted basis for the month. The result was in line with the expected figure but just below October’s 0.6% increase. The annual growth rate increased from 4.6% to 5.0%.

“The bottom line in that core CPI has not yet peaked [and is] almost guaranteed to rise above 6%,” said Ray Attrill, NAB’s Head of FX Strategy within its FICC division.

The report was released on the same day as the University of Michigan’s December reading of its Index of Consumer Sentiment and US Treasury bond yields generally declined on the day. By the close of business, the 2-year Treasury yields had shed 3bps to 0.66%, the 10-year yield had lost 2bps to 1.48% while the 30-year yield finished unchanged at 1.88%.

In terms of US Fed policy, expectations of any change in the federal funds range over the next 12 months softened slightly. December 2022 futures contracts implied an effective federal funds rate of 0.685%, 60bps above the spot rate but 2.5bps lower than at the end of the previous day.

“Whilst the data were in line with expectations, the core numbers show that underlying inflation pressures are intensifying,” said ANZ economist Hayden Dimes. He noted “core services inflation, 58% of the CPI, is running at 4.0% with an upward bias” while “shelter prices, 32.5% of the index, are running at 5.6% and goods prices excluding food and energy are running at 8.4%.”

The largest influence on headline results is often the change in fuel prices. “Energy commodities”, the segment which contains vehicle fuels, increased by 5.9%, adding 0.25 percentage points. Prices of “Services less energy services”, the segment which includes actual and implied rents, increased by 0.4% while “Commodities less food and energy”, the segment which includes clothes and vehicles, increased by 0.9%. These two categories added 0.23 percentage points and 0.19 percentage points respectively.

US October JOLTS consistent with “very tight labour market”

07 December 2021

Summary: US quit rate falls back to 2.8% in October JOLTS report; consistent with “very tight labour market”; points to further strength in wage growth; quits, separations down, job openings up.

The number of US employees who quit their jobs as a percentage of total employment increased slowly but steadily after the GFC. It peaked in March 2019 and then tracked sideways until virus containment measures were introduced in March 2020. The quit rate then plummeted as alternative employment opportunities rapidly dried up. Following the easing of US pandemic restrictions, it proceeded to recover back to its pre-pandemic rate in the third quarter of 2020 before moving higher in the second and third quarters of 2021.

Figures released as part of the most recent Job Openings and Labor Turnover Survey (JOLTS) report show the quit rate fell back in October after it made a new series-high in September. 2.8% of the non-farm workforce left their jobs voluntarily, down from September’s 3.0% (after rounding). There were 205,000 fewer quits during the month and an additional 546,000 people employed in the non-farm sector in percentage terms.

“The data remained consistent with a very tight labour market, even if the ‘quits rate’ fell slightly to 2.8% from the record high of 3% in September,” said NAB currency strategist Rodrigo Catril.

Long-term US Treasury bond yields rose noticeably on the day. By the close of business, the 10-year Treasury yield had gained 5bps to 1.52% and the 30-year yield had jumped by 8bps to 1.89%. The 20-year yield finished 1bp lower at 0.68%.

“All up, the data continues to point to extremely strong labour demand…employers having a hard time finding workers. This bodes well for labour market tightening going into 2022 and points to further strength in wage growth,” said ANZ senior economist Catherine Birch.

The fall in total quits was led by 57,000 fewer resignations in the “Transportation, warehousing, and utilities” sector and 45,000 fewer resignations in the “Finance and insurance” sector. The “Professional and business services” sector experienced the single largest increase, rising by 21,000. Overall, the total number of quits for the month fell from September’s revised figure of 4.362 million to 4.157 million.

In contrast, total vacancies at the end of October increased by 431,000, or 4.1%, from September’s revised figure of 10.602 million to 11.033 million. The rise was driven by a 254,000 increase in the “Accommodation and food services” sector while the “State and local government” sector experienced the single largest decline, falling by 77,000. Overall, 13 out of 18 sectors experienced more job openings than in the previous month.

Total separations decreased by 255,000, or 4.1%, from September’s revised figure of 6.147 million to 5.892 million. The fall was led by the “Finance and insurance” sector, where there were 88,000 fewer separations than in September. Separations decreased in 11 out of 18 sectors.

The “quit” rate time series produced by the JOLTS report is a leading indicator of US hourly pay. As wages account for around 55% of a product’s or service’s price in the US, wage inflation and overall inflation rates tend to be closely related. Former Federal Reserve chief and current Treasury Secretary Janet Yellen was known to pay close attention to it.

November job ads signals “sharp rebound imminent”

06 December 2021

Summary:  Job ads up 7.4% in November; 52.5% higher than same month in 2020; “sharp rebound” in employment “imminent”; 44.2% above pre-pandemic reading; ads-to-workforce ratio slightly higher at 1.6%.

From mid-2017 onwards, year-on-year growth rates in the total number of Australian job advertisements consistently exceeded 10%. That was until mid-2018 when the annual growth rate fell back markedly. 2019 was notable for its reduced employment advertising and this trend continued into the first quarter of 2020. Advertising plunged in April and May of 2020 as pandemic restrictions took effect but then recovered quite quickly.

According to the latest ANZ figures, total advertisements increased by 7.4% in November on a seasonally-adjusted basis. The rise followed a near-identical gain of 7.5% in October and a 2.8% decline in September after revisions. On a 12-month basis, total job advertisements were 52.5% higher than in November 2020, slightly lower than October’s revised figure of 55.9%.

“While employment fell 46,000 in October against market expectations of a 50,000 rise, the latest ANZ Job Ads data signal a sharp rebound is imminent,” said ANZ senior economist Catherine Birch.

The reading was released on the same day as the Melbourne Institute’s November Inflation Gauge reading and Commonwealth Government bond yields fell modestly on the day, despite large falls overnight of their US counterparts. By the close of business, 3-year and 10-year ACGB yields had each shed 3bps to 1.05% and 1.59% respectively while the 20-year yield finished 2bps lower at 2.11%.

Birch noted November’s advertisements were 44.2% above the pre-pandemic reading from January 2020, reflecting “the robust recovery in New South Wales, Victoria and the Australian Capital Territory as restrictions eased…” She expects Australia’s jobless rate to fall below 5% “in the near term” and “to around 4% by the end of 2022.”

The inverse relationship between job advertisements and the unemployment rate has been quite strong (see below chart), although ANZ themselves called the relationship between the two series into question in early 2019.  A rising number of job advertisements as a proportion of the labour force is suggestive of lower unemployment rates in the near-future while a falling ratio suggests higher unemployment rates will follow.

In 2008/2009, advertisements plummeted and Australia’s unemployment rate jumped from 4% to nearly 6% over a period of 15 months. When a more dramatic fall in advertisements took place in April 2020, the unemployment rate responded much more quickly.

Inflation Gauge annual rate exceeds 3% again in November

06 December 2021

Summary: Melbourne Institute Inflation Gauge index up 0.3% in November; index up 3.1% on annual basis; bond yields fall modestly.

The Melbourne Institute’s Inflation Gauge is an attempt to replicate the ABS consumer price index (CPI) on a monthly basis. It has turned out to be a reliable leading indicator of the CPI, although there are periods in which the Inflation Gauge and the CPI have diverged for as long as twelve months. On average, the Inflation Gauge’s annual rate tends to overestimate the ABS rate by around 0.1%.

The Melbourne Institute’s latest reading of its Inflation Gauge index indicates consumer inflation increased by 0.3% in November. The rise follows a 0.2% increase in October and a 0.3% increase in September. On an annual basis, the index rose by 3.1%, the same rate as in October.

The reading was released on the same day as ANZ’s latest Job Ads report and Commonwealth Government bond yields fell modestly on the day, despite large falls overnight of their US counterparts. By the close of business, 3-year and 10-year ACGB yields had each shed 3bps to 1.05% and 1.59% respectively while the 20-year yield finished 2bps lower at 2.11%.

Central bankers desire a certain level of inflation which is “sufficiently low that it does not materially distort economic decisions in the community” but high enough so it does not constrain “a central bank’s ability to combat recessions.” Hence the relatively recent obsession among central banks, including the RBA, to increase inflation.

Non-farm payrolls report “enough” for quicker Fed taper

03 December 2021

Summary: Non-farm payrolls increase by 210K in November; considerably less than 500K expected; previous two months’ figures revised up by 82K; jobless rate down to 4.2%, participation rate rises to 61.8%; points to “rapid tightening” in US jobs market & accelerated Fed taper; jobs-to-population ratio increases to 59.2%; underutilisation rate falls from 8.3% to 7.8%; annual hourly pay growth steady at 4.9%.

The US economy ceased producing jobs in net terms as infection controls began to be implemented in March 2020. The unemployment rate had been around 3.5% but that changed as job losses began to surge through March and April of 2020. The May 2020 non-farm employment report represented a turning point and subsequent months provided substantial employment gains. Changes in recent months have been generally more modest but usually well above the long-term monthly average.

According to the US Bureau of Labor Statistics, the US economy created an additional 210,000 jobs in the non-farm sector in November. The increase was considerably less than the 500,000 which had been generally expected earlier in the week as well as the 546,000 jobs which had been added in October after revisions. However, employment figures for September and October were also revised up by a total of 82,000.

The total number of unemployed decreased by 542,000 to 6.877 million while the total number of people who are either employed or looking for work increased by 594,000 to 162.052 million. These changes led to a fall in the US unemployment rate from October’s 4.6% to 4.2%. The participation rate increased from October’s rate of 61.6% to 61.8%.

ANZ economist Hayden Dimes said, “Despite the downside miss on November non-farm payroll jobs, the large 0.4% fall in the unemployment rate to 4.2% is pointing to a rapid tightening in the US labour market.” NAB senior economist Tapas Strickland said the “drop in the unemployment rate is enough for an accelerated taper.”

Longer-term US Treasury yields fell noticeably on the day as investors sought low-risk assets. By the close of business, the 10-year yield had shed 9bps to 1.36% and the 30-year yield had lost 8bps to 1.68%. The 2-year yield finished 3bps lower at 0.59%.

One figure which is indicative of the “spare capacity” of the US employment market is the employment-to-population ratio. This ratio is simply the number of people in work divided by the total US population. It hit a cyclical-low of 58.2 in October 2010 before slowly recovering to just above 61% in late-2019. November’s reading increased from 58.8% to 59.2%, still some way from its April 2000 peak reading of 64.7%.

Wage growth spiked in the US during the early stages of pandemic restrictions as lower-paid jobs disappeared at a faster rate relative to higher-paid jobs, disrupting the usual relationship between wage inflation and unemployment rates. Normally, wages tend to grow as the supply of labour tightens.

One measure of tightness in the labour market is the underutilisation rate. In November, this measure fell from 8.3% to 7.8%. Hourly pay growth over the previous 12 months remained unchanged from October’s revised rate of 4.9%.

“Lockdown” states still a drag on October home loan approvals

02 December 2021

Summary: Number of home loan approvals decline by 4.0% in October; declines “delayed effects” from  lockdowns, bounce back “likely”; value of loan commitments decrease by 2.5%; value of owner-occupier loan approvals down by 4.1%, investor approvals up by 1.1%; loan approvals down 11.9% over past three months in NSW, Victoria, ACT but up 0.3% in rest of Australia.

A very clear downtrend was evident in the monthly figures of both the number and value of home loan commitments through late-2017 to mid-2019. Then the RBA reduced its cash rate target in a series of cuts and both the number and value of mortgage approvals began to noticeably increase. Figures from February through to May of 2020 provided an indication the trend had finished but subsequent figures pushed the annual rate of increase back to elevated levels before it dropped back in the September quarter.

October’s housing finance figures have now been released and the total number of loan commitments (excluding refinancing loans) to owner-occupiers declined by 4.0%. The fall is a repeat of September’s change after revisions while the rate of growth on an annual basis decreased from September’s figure of 7.2% to 0.6%.

“Overall the October update looks to be a bit of a ‘head fake’. While housing markets are heading into a moderation that should become clearer in 2022, the latest declines in finance look to be delayed effects from the ‘delta’ lockdowns with a strong bounce-back likely in coming months,” said Westpac senior economist Matthew Hassan.

Commonwealth Government bond yields finished the day in a rather messy fashion. By the close of business, the 3-year ACGB yield had added 2bps to 1.13%, the 10-year yield had lost 7bps to 1.67% while the 20-year yield remained unchanged at 2.21%.

“Overall housing finance approvals excluding refinancing are 9.2% below their May 2021 peak but remain elevated, 5 5% higher than pre-pandemic February 2020 levels,” said NAB economist Taylor Nugent.

In dollar terms, total loan approvals excluding refinancing decreased by 2.5% over the month, in contrast to the 1.5% increase which had been generally expected and a greater fall than September’s -1.4%. On a year-on-year basis, total approvals excluding refinancing increased by 32.2%, a little slower than the previous month’s comparable figure of 35.5%.

The total value of owner-occupier loan commitments excluding refinancing decreased by 4.1%, a larger fall than September’s -2.7%. On an annual basis, owner-occupier loan commitments were 15.1% higher than in October 2020, whereas September’s annual growth figure was 20.8%.

The total value of investor commitments excluding refinancing arrangements rose by 1.1%. The increase follows a 1.4% increase in September and it marks a full twelve months of consecutive gain since the last monthly decline in October 2020. On an annual basis, the value of loan commitments in the month was 89.6% higher than in October 2020, up from 83.2% in September. 

“The detail suggests most of this softening relates to ‘delta’ disruptions in New South Wales, Victoria and the Australian Capital Territory,” said Westpac’s Hassan. He noted the value of loan approvals fell by 11.9% over the three months to October in these jurisdictions while they increased by 0.3% in the rest of Australia.

ADP report “bolsters” consensus view on upcoming US non-farm payrolls

01 December 2021

Summary: ADP payrolls up by 534,000 in November, slightly more than consensus expectations; October increase revised down by 1,000; “bolsters” consensus expectations of upcoming US non-farm report; positions up across firms of all sizes, bias again towards large firms; 80% of gain in services sector, led again by leisure/hospitality sector.

The ADP National Employment Report is a monthly report which provides an estimate of US non-farm employment in the private sector. Since publishing of the report began in 2006, its employment figures have exhibited a high correlation with official non-farm payroll figures, although a large difference can arise in any individual month.

The latest ADP report indicated private sector employment increased by 534,000 in November, slightly more than the 515,000 which had been generally expected. October’s increase was revised down by 1,000 to 570,000.

Ray Attrill, NAB’s Head of FX Strategy within its FICC division, said the “outcome nevertheless dampens the hopes of some that we would finally see another blockbuster payrolls number…” He said the report “bolsters the consensus view for payrolls to print near 550,000 tomorrow night.”

The report was released on the same day as the ISM’s latest manufacturing PMI figure and US Treasury yields moved lower on the day. By the close of business, the 2-year Treasury bond yield had slipped 1bp to 0.55%, the 10-year yield had shed 4bps to 1.41% while the 30-year yield finished 5bps lower at 1.74%.

In terms of US Fed policy, expectations of any change in the federal funds rate over the next 12 months firmed a little more in favour of earlier rate rises. Federal funds futures contracts for December 2022 implied an effective federal funds rate of 0.61%, 53bps above the current spot rate.

Employment numbers in net terms increased across businesses of all sizes, again with a strong bias towards large firms. Firms with less than 50 employees filled a net 115,000 positions, mid-sized firms (50-499 employees) gained 142,000 positions while large businesses (500 or more employees) accounted for 277,000 additional employees.

Employment at service providers accounted for just under 80% of the total net increase, or 424,000 positions. The “Leisure & Hospitality” sector was the largest single source of gains for an eighth consecutive month, with 136,000 additional positions. The “Professional & Business” sector was also a significant contributor, adding 110,000 positions. Total jobs among goods producers increased by a net 110,000 positions.

Prior to the ADP report, the consensus estimate of the change in October’s non-farm employment figure was 500,000. The non-farm payroll report will be released by the Bureau of Labor Statistics this coming Friday night (AEST), 3 December.

“Demand-driven, supply chain-constrained environment”: ISM November PMI

01 December 2021

Summary: ISM PMI increases from 60.8% to 61.1% in November, in line with consensus expectation; “demand-driven, supply chain-constrained environment”; manufacturing sector “still expanding very strongly”; latest reading implies 5.1% 12-month US GDP growth rate in April.

The Institute of Supply Management (ISM) manufacturing Purchasing Managers Index (PMI) reached a cyclical peak in September 2017.  It then started a downtrend which ended in March 2020 with a contraction in US manufacturing which lasted until June 2020. Subsequent month’s readings implied growth had resumed, with the index becoming stronger through to March 2021. Since then, readings have remained at elevated levels.

According to the ISM’s November survey, its PMI recorded a reading of 61.1%, basically in line with the generally expected figure of 61.0% but a little higher than October’s 60.8%. The average reading since 1948 is 53.0% and any reading above 50% implies an expansion in the US manufacturing sector relative to the previous month.

“The U.S. manufacturing sector remains in a demand-driven, supply chain-constrained environment, with some indications of slight labour and supplier-delivery improvement,” said Timothy Fiore, Chair of the ISM’s Manufacturing Business Survey Committee.

The report was released on the same day as the latest ADP employment report and US Treasury yields moved lower on the day. By the close of business, the 2-year Treasury bond yield had slipped 1bp to 0.55%, the 10-year yield had shed 4bps to 1.41% while the 30-year yield finished 5bps lower at 1.74%.

In terms of US Fed policy, expectations of any change in the federal funds rate over the next 12 months firmed a little more in favour of earlier rate rises. Federal funds futures contracts for December 2022 implied an effective federal funds rate of 0.61%, 53bps above the current spot rate.

“Though back from the mid-60s in March this year, levels above 60 nevertheless remain very strong in a historical context and suggest the sector is still expanding very strongly,” said Ray Attrill, NAB’s Head of FX Strategy within its FICC division. Purchasing managers’ indices (PMIs) are economic indicators derived from monthly surveys of executives in private-sector companies. They are diffusion indices, which means a reading of 50% represents no change from the previous period, while a reading under 50% implies respondents reported a deterioration on average. According to the ISM, a reading “above 42.8%, over a period of time, generally indicates an expansion of the overall economy.”  

The ISM’s manufacturing PMI figures appear to lead US GDP by several months despite a considerable error in any given month. The chart below shows US GDP on a “year on year” basis (and not the BEA annualised basis) against US GDP implied by monthly PMI figures. 

According to the ISM and its analysis of past relationships between the PMI and US GDP, November’s PMI corresponds to an annualised growth rate of 5.1%, or 1.3% over a quarter. Regression analysis on a year-on-year basis suggests a 12-month GDP growth rate of 5.1% five months after this latest report.

The ISM index is one of two monthly US PMIs, the other being an index published by IHS Markit. IHS Markit also produces a “flash” estimate in the last week of each month which comes out about a week and a half before the ISM index is published. The IHS Markit November flash manufacturing PMI registered 59.1%, 0.7 percentage points higher than October’s final figure.

Click for more news