News

Private sector credit growth “firm and stable” in August

30 September 2024

Summary: Private sector credit up 0.5% in August, in line with expectations; annual growth rate steady at 5.7%; Westpac: credit growth momentum firm and steady, above pre-pandemic levels; ACGB yields rise; rate-cut expectations soften, February cut still priced in; Westpac: still insufficient to generate a stronger GDP impulse; owner-occupier segment accounts for 50% of net growth.

The pace of lending growth in the non-bank private sector by financial institutions in Australia followed a steady-but-gradual downtrend from late 2015 through to early 2020 before hitting what appears to be a nadir in March 2021. That downtrend ended later in that same year and annual growth rates shot up through 2022, peaking in September/October before easing through 2023.

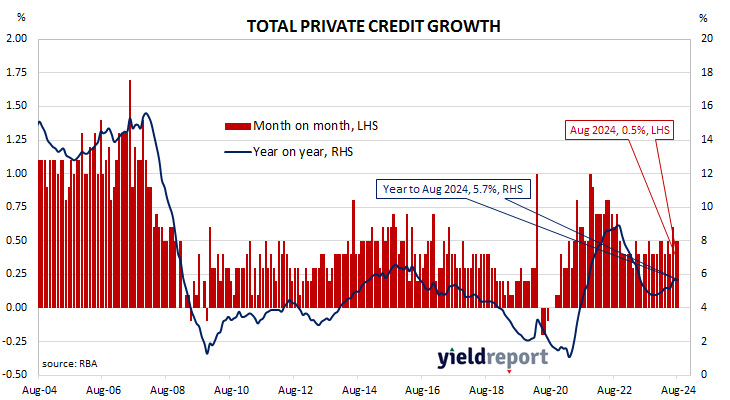
According to the latest RBA figures, private sector credit increased by 0.5% in August. The result was in line with expectations as well as July’s rise. On an annual basis, the growth rate remained unchanged at 5.7%.

“Stepping back, momentum in credit growth appears to be firm and stable,” said Westpac senior economist Mantas Vanagas. “It is comfortably above the pre-pandemic levels when interest rates were significantly lower.”

Commonwealth Government bond yields moved modestly higher across the curve. By the close of business, the 3-year ACGB yield had inched  up 1bp to 3.46% while 10-year and 20-year yields both finished 2bps higher at 4.00% and 4.43% respectively.

Expectations regarding rate cuts in the next twelve months softened a little, albeit with a February 2025 rate cut still fully priced in. Cash futures contracts implied an average of 4.30% in November, 4.205% in December and 4.08% in February 2025. August 2025 contracts implied 3.395%, 94bps less than the current cash rate.

“However, against the backdrop of weak aggregate demand, it is still insufficient to generate a stronger GDP impulse,” Vanagas added. “And with household and business sentiment surveys remaining subdued, a similar dynamic is expected to persist in the near term.”

Owner-occupiers accounted for just over 50% of the net growth over the month while business lending accounted for slightly more than 35%. Investor lending accounted for almost all the balance.


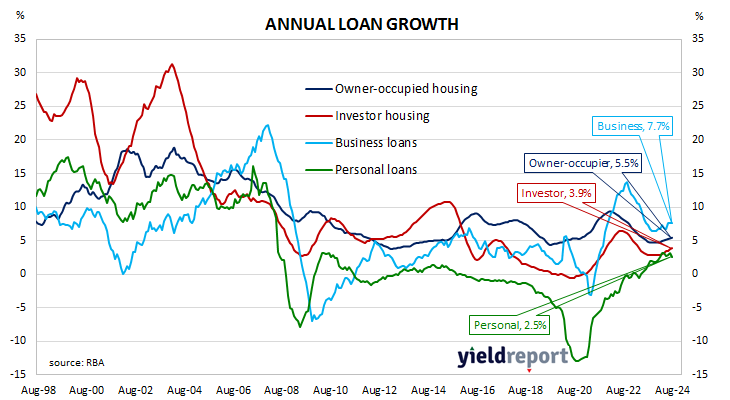
The traditional driver of overall loan growth, the owner-occupier segment, grew by 0.4% over the month, slightly slower than July’s 0.5% rise. The sector’s 12-month growth rate ticked up from 5.4% to 5.5%.

Total lending in the non-financial business sector increased by 0.7%, up from July’s growth rate of 0.5%. Growth on an annual basis remained unchanged at 7.7%.

Monthly growth in the investor-lending segment slowed to a near-halt in early 2018 and essentially stayed that way until mid-2021. In August, net lending rose by 0.4%, as it had in each of the preceding four months. The 12-month growth rate increased from 3.7% to 3.9%.

Total personal loans increased by 0.1%, down from July’s 0.5% increase, while the annual growth rate slowed from 3.1% to 2.5%. This category of debt includes fixed-term loans for large personal expenditures, credit cards and other revolving credit facilities.

US August PCE figures under expectations: “very pleasing” for Fed

27 September 2024

Summary: US core PCE price index up 0.1% in August, below expectations; annual rate ticks up from 2.6% to 2.7%; Westpac: very pleasing results for Fed; Treasury yields fall; Fed rate-cut expectations firm, seven 25bp cuts priced in.

One of the US Fed’s favoured measures of inflation is the change in the core personal consumption expenditures (PCE) price index. After hitting the Fed’s target at the time of 2.0% in mid-2018, the annual rate then hovered in a range between 1.8% and 2.0% before it eased back to a range between 1.5% and 1.8% through 2019. It then plummeted below 1.0% in April 2020 before rising back to around 1.5% in the September quarter of that year. It has since increased significantly and still remains above the Fed’s target even after recent declines.

The latest figures have now been published by the Bureau of Economic Analysis as part of the August personal income and expenditures report. Core PCE prices rose by 0.1% over the month, below the 0.2% increase which had been generally expected well as July’s 0.2% increase. On a 12-month basis, the core PCE inflation rate ticked up from 2.6% to 2.7%.

“Headline and core personal consumption expenditure deflator outcomes were benign in August, as expected,” said Westpac economist Jameson Coombs. “For the Fed, these are very pleasing results, inflation abating to target while the consumer’s appetite for spending remains robust.”

US Treasury bond yields fell across a steeper curve on the day. By the close of business, the 2-year Treasury bond yield had shed 7bps to 3.56%, the 10-year yield had lost 5bps to 3.75% while the 30-year yield finished 5bps lower at 4.10%.

In terms of US Fed policy, expectations of a lower federal funds rate in the next 12 months firmed, with at least another seven 25bp cuts factored in. At the close of business, contracts implied the effective federal funds rate would average 4.525% in November, 4.28% in December and 3.73% in February. August 2025 contracts implied 2.97%, 186bps less than the current rate.

The core version of PCE strips out energy and food components, which are volatile from month to month, in an attempt to identify the prevailing trend. It is not the only measure of inflation used by the Fed; the Fed also tracks the Consumer Price Index (CPI) and the Producer Price Index (PPI) from the Department of Labor. However, it is the one measure which is most often referred to in FOMC minutes.

Euro sentiment index maintains lacklustre levels in September

27 September 2024

Summary: Euro-zone composite sentiment indicator down slightly in September, slightly below expectations; German, French 10-year yields noticeably lower; readings down in two of five sectors; down in two of four largest euro-zone economies; index implies annual GDP growth rate of 0.7%.

The European Commission’s Economic Sentiment Indicator (ESI) is a composite index comprising five differently weighted sectoral confidence indicators.  It is heavily weighted towards confidence surveys from the business sector, with the consumer confidence sub-index only accounting for 20% of the ESI. However, it has a good relationship with euro-zone GDP growth rates, although not necessarily as a leading indicator.

According to the latest survey taken by the European Commission, confidence has deteriorated slightly on average across the various sectors of the euro-zone economy in September. The ESI posted a reading of 96.2, slightly below expectations as well as August’s revised reading of 96.5. The average reading since 1985 is just under 100.

Long-term German and French 10-year bond yields moved noticeably lower on the day. By the close of business, the German 10-year yield had lost 6bps to 2.13% while the French 10-year yield finished 5bps lower at 2.92%.

Confidence lessened in two of the five sectors of the euro-zone economy. On a geographical basis, the ESI decreased in two of four of the euro-zone’s largest economies.

End-of-quarter ESI readings and annual euro-zone GDP growth rates are highly correlated. This latest reading corresponds to a year-to-September GDP growth rate of 0.7%, unchanged from August’s implied growth rate.

Largest drop since Aug 2021; Conf. Board sentiment index falls back in Sep

24 September 2024

Summary: Conference Board Consumer Confidence Index down in September, below expectations; largest decline since August 2021; US Treasury yields fall across steeper curve; expectations of Fed rate cuts firm, nearly 200bps of cuts expected in next 12 months; views of present conditions, short-term outlook both deteriorate; drop in confidence steepest for consumers aged 35 to 54.

US consumer confidence clawed its way back to neutral over the five years after the GFC in 2008/2009 and then went from strength to strength until late 2018. Measures of consumer confidence then oscillated within a relatively narrow band at historically high levels until they plunged in early 2020. Subsequent readings then fluctuated around the long-term average until March 2021 when they returned to elevated levels. However, a noticeable gap has since emerged between the two most-widely followed surveys.

The latest Conference Board survey completed just after the middle of September indicates its measure of US consumer confidence has continued bumping along at slightly-above-average levels. The latest reading of the Consumer Confidence Index registered 98.7 on a preliminary basis, below the generally-expected figure of 102.8 as well as August’s upwardly-revised final figure of 105.6.

“September’s decline was the largest since August 2021 and all five components of the Index deteriorated,” said Dana Peterson, Chief Economist at The Conference Board.

US Treasury bond yields fell across a steeper curve on the day. By the close of business, the 2-year Treasury bond yield had shed 4bps to 3.54%, the 10-year yield had lost 2bps to 2.73% while the 30-year yield finished unchanged at 4.09%.

In terms of US Fed policy, expectations of a lower federal funds rate in the next 12 months firmed, with at least another seven 25bp cuts still factored in. At the close of business, contracts implied the effective federal funds rate would average 4.515% in November, 4.255% in December and 3.68% in February. August 2025 contracts implied 2.905%, 193bps less than the current rate.

Consumers’ views of present conditions and the near-future both deteriorated. The Present Situation Index decreased from August’s revised figure of 134.6 to 124.3 while the Expectations Index declined from 86.3 to 81.7.

“The drop in confidence was steepest for consumers aged 35 to 54,” Peterson added. “As a result, on a six-month moving average basis, the 35–54 age group has become the least confident while consumers under 35 remain the most confident. Confidence declined in September across most income groups, with consumers earning less than $50,000 experiencing the largest decrease.”

The Consumer Confidence Survey is one of two widely followed monthly US consumer sentiment surveys which produce sentiment indices. The Conference Board’s index is based on perceptions of current business and employment conditions, as well as respondents’ expectations of conditions six months in the future. The other survey, conducted by the University of Michigan, is similar and it is used to produce an Index of Consumer Sentiment. That survey differs in that it does not ask respondents explicitly about their views of the labour market and it also includes some longer-term questions.

German companies’ outlook slides: ifo index slips in September

24 September 2024

Summary: ifo business climate index down again in September, slightly below expectations; companies’ outlook for coming months continues to decline; current conditions, expectations indices both down; German, French yields decline; ANZ: highlights sluggish growth outlook for largest economy in euro area; expectations index implies euro-zone GDP contraction of 1.4% in year to December.

Following recessions in euro-zone economies in 2009/2010, the ifo Institute’s Business Climate Index largely ignored the European debt-crisis of 2010-2012, mostly posting average-to-elevated readings through to early-2020. However, the index was quick to react in the March 2020 survey, falling precipitously before recovering quickly in subsequent months. Readings through much of 2021 generally fluctuated around the long-term average before dropping away in 2022 and stagnating through 2023 and the first half of 2024.

According to the latest report released by ifo, German business sentiment has weakened further from its already-depressed level. September’s Business Climate Index posted a reading of 85.4, slightly below the generally expected figure of 86.0 as well as August’s final reading of 86.6. The average reading since January 2005 is just over 96.

“Sentiment has once again deteriorated at companies in Germany,” said Clemens Fuest, President of the ifo Institute. “The companies were particularly less satisfied with the current business situation. The outlook for the coming months continues to decline. The German economy is coming under ever-increasing pressure.”

German firms’ views of current conditions and the outlook both deteriorated. The current situation index declined from 86.6 to 85.4 while the expectations index fell from 86.4 after revisions to 84.4.

German and French long-term bond yields both decreased modestly on the day. By the close of business, the German 10-year bond yield had slipped 1bp to 2.14% while the French 10-year yield finished 2bps lower at 2.91%.

 “The IFO business climate index and the PMI report, released a day before, highlight sluggish growth outlook for the largest economy in the euro area,” said ANZ economist Kishti Sen.  “Slowing inflation and weakness in growth outlook highlights the need for easing of policy.”

The ifo Institute’s business climate index is a composite index which combines German companies’ views of current conditions with their outlook for the next six months. It has similarities to consumer sentiment indices in the US such as the ones produced by The Conference Board and the University of Michigan.                                 

It also displays a solid correlation with euro-zone GDP growth rates. However, the expectations index is a better predictor as it has a higher correlation when lagged by three months. September’s expectations index implies a 1.4% year-on-year GDP contraction to the end of December.    

US leading index continues losing streak in August; losing momentum

19 September 2024

Summary: Conference Board leading index down 0.2% in August, decline smaller than expected fall; CB: expects US real GDP growth to lose momentum in second half; short-term US Treasury yields down, longer-term yields up; rate-cut expectations firm slightly; CB: latest reading driven by new orders.

The Conference Board Leading Economic Index (LEI) is a composite index composed of ten sub-indices which are thought to be sensitive to changes in the US economy. The Conference Board describes it as an index which attempts to signal growth peaks and troughs; turning points in the index have historically occurred prior to changes in aggregate economic activity. Readings from March and April of 2020 signalled “a deep US recession” while subsequent readings indicated the US economy would recover rapidly. Post-2022 readings implied US GDP growth rates would turn negative but that has not been the case so far.

The latest reading of the LEI indicates it decreased by 0.2% in August. The fall was a slightly smaller one than the 0.3% decline which had been generally expected and not as severe as July’s 0.6% decrease.

“Overall, the LEI continued to signal headwinds to economic growth ahead,” said Justyna Zabinska-La Monica of The Conference Board. “The Conference Board expects US real GDP growth to lose momentum in the second half of this year as higher prices, elevated interest rates and mounting debt erode domestic demand.”

Short-term US Treasury bond yields declined on the day while longer-term yields increased. By the close of business, the 2-year Treasury yield had lost 3bps to 3.59%, the 10-year yield had added 1bp to 3.72% while the 30-year yield finished 3bps higher at 4.05%.

In terms of US Fed policy, expectations of a lower federal funds rate in the next 12 months firmed slightly, with at least another seven 25bp cuts still factored in. At the close of business, contracts implied the effective federal funds rate would average 4.555% in November, 4.32% in December and 3.76% in February. August 2025 contracts implied 2.975%, 185bps less than the current rate.

“The erosion continued to be driven by new orders, which recorded its lowest value since May 2023,” added Zabinska-La Monica. “A negative interest rate spread, persistently gloomy consumer expectations of future business conditions and lower stock prices after the early-August financial market tumult also weighed on the Index.”

The Conference Board stated in August it expected annualised growth rates of 0.6% and 1.0% in the respective third and fourth quarters of 2024. Regression analysis suggests the latest reading implies a 0.3% year-on-year contraction rate in November, unchanged from the year-to-October growth rate after revisions.

August Westpac-MI leading index falls, sluggish growth to “last even longer”

18 September 2024

Summary: Leading index growth rate down in August; Westpac: momentum improved relative to 2022, 2023, but still soft; reading implies annual GDP growth of around 2.25%-2.50%; ACGB yields rise; rate-cut expectations soften; Westpac: expects extended period of sluggish performance to last even longer; Westpac: forecasts 1% GDP growth in calendar 2024, 2.4% in calendar 2025.

Westpac and the Melbourne Institute describe their Leading Index as a composite measure which attempts to estimate the likely pace of Australian economic growth in the short-term. After reaching a peak in early 2018, the index trended lower through 2018 and 2019 before plunging to recessionary levels in the second quarter of 2020. Subsequent readings spiked towards the end of 2020 but then trended lower through 2021 and 2022 before flattening out in 2023 and 2024.

August’s reading has now been released and the six month annualised growth rate of the indicator registered -0.27%, down from July’s revised figure of +0.04%. The index reading represents a rate relative to “trend” GDP growth, which is generally thought to be around 2.50% to 2.75% per annum in Australia.

“The fall takes the Index growth rate to an eight-month low, albeit still in the –0.3% to +0.2% range that has prevailed since November last year,” said Westpac senior economist Matthew Hassan. “Momentum has improved relative to 2022 and 2023 but is still soft.”

Westpac states the index leads GDP growth by “three to nine months into the future” but the highest correlation between the index and actual GDP figures occurs with a three-month lead. The current reading may therefore be considered to be indicative of an annual GDP growth rate of around 2.25% to 2.50% in the next quarter.

Domestic Treasury bond yields moved moderately higher across the curve.on the day. By the close of business, 3-year, 10-year and 20-year ACGB yields had all gained 3bps to 3.36%, 3.88% and 4.26% respectively.

Expectations regarding rate cuts in the next twelve months softened a little, albeit with a February 2025 rate cut still fully priced in. Cash futures contracts implied an average of 4.325% in September, 4.325% in October, 4.26% in November and 4.035% in February 2025. August 2025 contracts implied 3.315%, 102bps less than the current cash rate.

“Westpac expects this extended period of sluggish performance to last even longer,” Hassan added. “GDP growth is forecast to lift from 1% currently to 2.4% in 2025, an improvement but consistent with the sub-trend signal from the Leading Index.”

The RBA’s August Statement on Monetary Policy forecasts are somewhat higher than Westpac’s latest numbers. The RBA forecasts GDP growth for the years ending December 2024 and December 2025 to be 1.7% and 2.3% respectively.

US retail sales inch higher in August; points to near-trend Q3 consumption growth

17 September 2024

Summary: US retail sales up 0.1% in August, contrasts with expected decline; annual growth rate slows to 2.1%; Westpac: recent data points to near-trend growth in Q3 goods consumption; US Treasury yields up; rate-cut expectations soften slightly; Westpac: GDP component of sales up 0.3% in August, up 0.4% in July; higher sales in five of thirteen categories; online sales largest single influence on month’s result.

US retail sales had been trending up since late 2015 but, commencing in late 2018, a series of weak or negative monthly results led to a drop-off in the annual growth rate below 2.0%. Growth rates then increased in trend terms through 2019 and into early 2020 until pandemic restrictions sent them into negative territory. A “v-shaped” recovery then took place which was followed by some short-term spikes as federal stimulus payments hit US households in 2021. However, growth rates have slowed significantly since mid-2022.

According to the latest “advance” numbers released by the US Census Bureau, total retail sales increased by just 0.1% in August. The result contrasted with the 0.2% fall which had been generally expected but it was well down from July’s 1.1% rise after revisions. On an annual basis, the growth rate slowed from July’s revised rate of 2.9% to 2.1%.

“Overall, recent retail sales data points to near-trend growth in goods consumption in Q3,” said Westpac economist Illiana Jain.

The figures came out on the same morning as August’s industrial production figures and short-term US Treasury bond yields increased noticeably on the day while longer-term yields rose more moderately. By the close of business, the 2-year Treasury yield had gained 6bps to 3.61% while 10-year and 30-year yield both finished 3bps higher at 3.65% and 3.96% respectively..

In terms of US Fed policy, expectations of a lower federal funds rate in the next 12 months softened slightly, although at least nine 25bp cuts are still factored in. At the close of business, contracts implied the effective federal funds rate would average 5.17% in September, 4.64% in November and 4.40% in December. August 2025 contracts implied 2.965%, 236bps less than the current rate.

“The control group, which feeds into the GDP calculation, was stronger at 0.3%, and the July estimate also edged up to 0.4%,” Jain added. “In 3-month annualised terms, the control group reading rose by 5.7%, the fastest rate since August 2023.”

Only five of the thirteen categories recorded lower sales over the month. The “Non-store retailers” segment had the largest single influence on the overall result as it rose by 1.4% over the month and contributed 0.24 percentage points to the total. 

The non-store segment includes vending machine sales, door-to-door sales and mail-order sales but nowadays this segment has become dominated by online sales. It accounts for around 17% of all US retail sales and it is the second-largest segment after vehicles and parts.

US industrial output reverses July fall; “no evidence of recession”

17 September 2024

Summary: US industrial output up 0.8% in August, greater than expected; zero growth over past 12 months; ANZ: suggests solid growth in Q3, no evidence of a recession; US Treasury yields up; rate-cut expectations soften slightly; capacity utilisation rate rises to 78.0%.

The Federal Reserve’s industrial production (IP) index measures real output from manufacturing, mining, electricity and gas company facilities located in the United States. These sectors are thought to be sensitive to consumer demand and so some leading indicators of GDP use industrial production figures as a component. US production collapsed through March and April of 2020 before recovering the ground lost over the fifteen months to July 2021. However, production levels has largely stagnated since early 2022.

According to the Federal Reserve, US industrial production increased by 0.8% on a seasonally adjusted basis in August. The rise was significantly greater than the 0.1% expansion which had been generally expected and a near-total reversal of July’s downwardly-revised 0.9% contraction. The annual growth rate moved back to zero, up from July’s downwardly revised figure of -0.7%.

“August motor vehicle production jumped nearly 10.0% following a 9.0% decline in July,” said ANZ economist Sophia Angala. “Ex-motor vehicles, manufacturing production rose 0.3%. Both sets of data are suggesting solid growth in Q3 and no evidence of a recession.

The figures came out on the same morning as the latest retail sales numbers and short-term US Treasury bond yields increased noticeably on the day while longer-term yields rose more moderately. By the close of business, the 2-year Treasury yield had gained 6bps to 3.61% while 10-year and 30-year yield both finished 3bps higher at 3.65% and 3.96% respectively..

In terms of US Fed policy, expectations of a lower federal funds rate in the next 12 months softened slightly, although at least nine 25bp cuts are still factored in. At the close of business, contracts implied the effective federal funds rate would average 5.17% in September, 4.64% in November and 4.40% in December. August 2025 contracts implied 2.965%, 236bps less than the current rate.

The same report includes capacity utilisation figures which are generally accepted as an indicator of future investment expenditure and/or inflationary pressures. Capacity usage hit a high for the last business cycle in early 2019 before it began a downtrend which ended with April 2020’s multi-decade low of 64.2%. August’s reading increased by 0.6 percentage points after revisions to 78.0%, 2.1 percentage points below the long-term average.

While the US utilisation rate’s correlation with the US jobless rate is solid, it is not as high as the comparable correlation in Australia.

Europe’s industrial production contracts in July

13 September 2024

Summary: Euro-zone industrial production down 0.3% in July, in line with expectations; down 2.2% on annual basis; German, French 10-year yields unchanged or lower; contraction in all four largest economies.

Following a recession in 2009/2010 and the debt-crisis which flowed from it, euro-zone industrial production recovered and then reached a peak four years later in 2016. Growth rates then fluctuated for two years before beginning a steady and persistent slowdown from the start of 2018. That decline was transformed into a plunge in March and April of 2020 which then took over a year to claw back. Production levels since early 2023 have generally declined.

According to the latest figures released by Eurostat, euro-zone industrial production contracted by 0.3% in July on a seasonally-adjusted and calendar-adjusted basis. The fall was in line with expectations but down from June’s flat result after revisions. On an annual basis, the contraction rate slowed from June’s revised rate of 4.1% to 2.2%.

Long-term German and French sovereign bond yields either finished unchanged or down slightly on the day. By the close of business, the German 10-year bond yield had returned to its starting point at 2.15% while the French 10-year yield finished 2bps lower at 2.84%.

Industrial production contracted in all of the euro-zone’s four largest economies. Germany’s production fell by 3.0% over the month while the comparable figures for France, Spain and Italy were -0.5%, -0.7% and -0.9% respectively.

Click for more news