News

Rising prices, delta “primary drivers” of lower US confidence: Conference Board

30 November 2021

Summary: Conference Board Consumer Confidence Index declines in November; reading slightly below expected figure; views of present conditions, short-term outlook both decline; household confidence, spending to “face headwinds” from rising prices, potential COVID-19 resurgence; economic expansion still likely into early 2022.

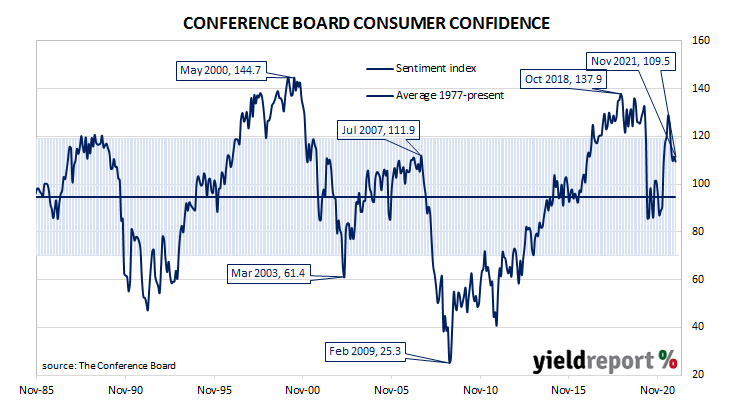
After the GFC in 2008/09, US consumer confidence clawed its way back to neutral over a number of years and then went from strength to strength until late 2018. Measures of consumer confidence then oscillated within a fairly narrow band at historically high levels until they plunged in early 2020. Subsequent readings then fluctuated around the long-term average until March this year when they reached elevated levels.

The latest Conference Board survey held during the first three weeks of November indicated US consumer confidence has deteriorated marginally. October’s Consumer Confidence Index registered 109.5 on a preliminary basis, a reading which was slightly below the median consensus figure of 110.0 as well as October’s final figure of 111.6.

Consumers’ views of present conditions and their outlook for the near-future both deteriorated. The Present Situation Index declined from a revised figure of 145.5 to 142.5 while the Expectations Index declined from a revised figure of 89.0 to 87.6.

“Expectations about short-term growth prospects ticked up but job and income prospects ticked down. Concerns about rising prices and, to a lesser degree, the Delta variant, were the primary drivers of the slight decline in confidence,” said Lynn Franco, a senior director at The Conference Board.

US Treasury bond yields jumped at the short end but fell elsewhere along the curve on the day following Jerome Powell’s comments regarding inflation and the pace of tapering. By the close of business, the 2-year Treasury bond yield had gained 8bps to 0.56%, the 10-year yield had shed 5bps to 1.45% while the 30-year yield finished 6bps lower at 1.79%.

In terms of US Fed policy, expectations of a rise in the federal funds rate over the next 12 months firmed a little. Federal funds futures contracts for November 2022 implied an effective federal funds rate of 0.52%, 45bps above the current spot rate.

Franco expects household confidence and spending “will likely face headwinds from rising prices and a potential resurgence of COVID-19 in the coming months.” However, he also thinks “confidence levels suggest the economic expansion will continue into early 2022.”

The Consumer Confidence Survey is one of two monthly US consumer sentiment surveys which result in the construction of an index. The Conference Board’s index is based on perceptions of current business and employment conditions, as well as respondents’ expectations of conditions six months in the future. The other survey, conducted by the University of Michigan, is similar and it is used to produce an Index of Consumer Sentiment. That survey differs in that it also includes some longer-term questions.

NSW, HomeBuilder unwind drive October approvals drop

30 November 2021

Summary: Home approval numbers drop 12.9% in October, greater than -2.0% expected; down 8.1% on annual basis; driven by fewer approvals in NSW, end of HomeBuilder scheme; ANZ: approvals figures “to drop further, Westpac:  HomeBuilder unwind probably finished; house approvals up 4.5%, apartment down 36.1%; non-residential approvals down 20.9%, residential alterations up 2.6% over month.

Building approvals for dwellings, that is apartments and houses, had been heading south since mid-2018. As an indicator of investor confidence, falling approvals had presented a worrying signal, not just for the building sector but for the overall economy. However, approval figures from late-2019 and the early months of 2020 painted a picture of a recovery taking place, even as late as April of that year. Subsequent months’ figures then trended sharply upwards before easing somewhat in the June and September quarters of 2021.

The Australian Bureau of Statistics has released the latest figures from October and total residential approvals dropped by 12.9% on a seasonally-adjusted basis. The fall over the month was greater than the 2.0% decline which had been generally expected as well as September’s 3.9% decrease. Total approvals decreased by 8.1% on an annual basis, down from the previous month’s revised figure of +14.1%. Monthly growth rates are often volatile.

“The magnitude of the drop was driven by a reversion in approvals in New South Wales, though it also reflects an ongoing moderation of approvals from Homebuilder highs nationally. Only Queensland saw a rise in monthly approvals,” said ANZ senior economist Adelaide Timbrell.

The report was released on the same day as October’s private credit figures and Commonwealth bond yields fell noticeably on the day. By the end of it, the 3-year ACGB yield had shed 4bps to 1.05%, the 10-year rate had lost 6bps to 1.70% while the 20-year yield finished 7bps lower at 2.17%.

Timbrell expects approvals figures “to drop further as borrowing costs continue to rise and the boost from Homebuilder unwinds.” She noted immigration would “provide some offset” when it resumes.

Westpac senior economist Matthew Hassan thinks any reversion to “normal” following the short-term boost is probably over, noting there are now “clearer signs the HomeBuilder unwind has finished.” However, he thinks several more months will be required to confirm his view but, if correct, “approvals have bottomed out at a much higher level than might have been expected…”

Approvals for new houses increased by 4.5% over the month after falling by 15.2% in September after revisions. On a 12-month basis, house approvals were 4.4% lower than they were in September 2020, down from September’s comparable figure of -2.0%.

Apartment approval figures are usually a lot more volatile and October’s total fell by 36.1% after a decrease of 17.1% in September. The 12-month growth figure reversed from September’s revised rate of 45.5% to -15.1%.

Non-residential approvals decreased by 20.9% in dollar terms over the month and by 25.4% on an annual basis. Figures in this segment also tend to be rather volatile.

Residential alteration approvals increased by 2.6% in dollar terms over the month and were 14.7% higher than in October 2020.

October credit growth strongest since August 2016

30 November 2021

Summary: Private sector credit grows by 0.5% in October, slightly below +0.6% expected; annual growth rate rises from 5.3% to 5.7%; annual credit growth at strongest pace since August 2016; growth “likely to remain elevated” given latest business capex plans; owner-occupier loans account for half net growth, business loans another third; investor loans up modestly again, personal loans flat.

The pace of lending to the non-bank private sector by financial institutions in Australia followed a steady-but-gradual downtrend from late-2015 through to early 2020 before hitting what appears to be a nadir in March 2021. Recent months’ figures indicate the downtrend is over and annual growth rates are now not far from the peak rate seen in the middle of the last economic expansion.

According to the latest RBA figures, private sector credit growth increased by 0.5% in October. The result was slightly below the generally expected figure of 0.6% as well as September’s 0.6% increase. On an annual basis, the growth rate increased from September’s rate of 5.3% to 5.7%.

“Lockdowns have two impacts on credit; to boost the business segment but to dent the housing sector. Currently, the former force is proving to be more powerful than the latter, driving annual credit growth up to its strongest pace since August 2016,”said Westpac senior economist Andrew Hanlan.

The report was released on the same day as October’s dwelling approvals figures and Commonwealth bond yields fell noticeably on the day. By the end of it, the 3-year ACGB yield had shed 4bps to 1.05%, the 10-year rate had lost 6bps to 1.70% while the 20-year yield finished 7bps lower at 2.17%.

“Given the latest capex plans from businesses for 2021/2022, business credit growth is likely to remain…elevated,” said ANZ senior economist Adelaide Timbrell.

Owner-occupier loans accounted for just under half of the net growth over the month, while business loans accounted for another third. Investor loans again grew quite modestly while total personal debt remained unchanged.

The traditional driver of loan growth rates, the owner-occupier segment, grew by 0.7% over the month, slightly slower than September’s 0.8% increase. The sector’s 12-month growth rate sped up from September’s rate of 8.7% to 9.0%.

Total lending in the business sector grew by 0.5%, somewhat slower than August’s 0.7% increase. The segment’s annual growth rate increased from September’s revised rate of 4.5% to 5.3%.

Monthly growth in the investor-lending segment slowed to a halt in early 2018. Shortly into the 2019/20 financial year, monthly growth rates slipped into the red before posting a series of flat or near-flat results until late 2020. Growth rates became positive again from December 2020. In October, net lending grew by 0.3%, in line with growth rates in August and September. The 12-month growth rate accelerated modestly from September’s rate of 2.4% to 2.6%.                                    

Total personal loans remained unchanged in October following a 0.7% fall in September while the annual contraction rate slowed from 5.3% to 4.6%. This category of debt includes fixed-term loans for large personal expenditures, credit cards and other revolving credit facilities.

Retails sector a drag on euro-zone ESI, other sectors stable/up

29 November 2021

Summary: Euro-zone composite sentiment index declines from 118.6 to 117.5 in November, slightly below expectations; readings down in retail sector, other sectors stable or up; up in France, Italy, down in Germany, Spain; sovereign bond yields modestly higher on day; index implies still GDP growth in excess of 5%.

The European Commission’s Economic Sentiment Indicator (ESI) is a composite index comprising five differently-weighted sectoral confidence indicators.  It is heavily weighted towards confidence surveys from the business sector, with the consumer confidence sub-index only accounting for 20% of the ESI. However, it has a good relationship with euro-zone GDP, although not as a leading indicator.

The ESI posted a reading of 117.5 in November, slightly below the market’s expected figure of 117.8 and October’s reading of 118.6. The average reading since 1985 has been a touch over 100 and the latest reading is still not far from its series high of 119.

Confidence deteriorated in only the retail sector while it remained stable or slightly improved in the other four sectors. On a geographical basis, the ESI increased in France and Italy but declined in Germany and Spain.

German and French 10-year bond yields finished the day modestly higher. By the close of business, they had both added 2bps to -0.32% and 0.05% respectively.

End-of-quarter ESI readings and annual euro-zone GDP growth rates are highly correlated. This latest reading corresponds to a year-to-November GDP growth rate of 5.3%, down from October’s 5.6%.

NSW reopening boosts October retail spending

26 November 2021

Summary: Retail sales up 4.9% in October, greater than 2.5% expected; up 5.2% on annual basis; increase led by NSW sales, up 13.3%; largest influence on month from clothing.

Growth figures of domestic retail sales have been declining since 2014 and they reached a low-point in September 2017 when they registered an annual growth rate of just 1.5%. They then began increasing for about a year, only to stabilise at around 3.0% to 3.5% through late 2018 before trending lower through 2019 and early 2020. Monthly changes have been exceptionally volatile since then.

According to the latest ABS figures, total retail sales increased by 4.9% in October on a seasonally-adjusted basis. The gain was greater than the 2.5% increase as well as September’s 1.3% rise. On an annual basis, retail sales increased by 5.2%, up from September’s comparable figure of 1.7%.

“Growth was led by a phenomenal 13.3% rebound in New South Wales where sales were just 0.2% below their pre-delta level in May. That is despite many restrictions still in place through the first half of the month; the reopening rebound [has been] both stronger and earlier than expected,” said Westpac senior economist Matthew Hassan.

Commonwealth bond yields dropped significantly on the day as investors moved to lower-risk assets following reports of the spread of a more infectious strain of SARS-COVID 2 in South Africa. By the end of the day, the 3-year ACGB yield had shed 12bps to 1.10%, the 10-year rate had lost 14bps to 1.75% while the 20-year yield finished 13bps lower at 2.25%.

Retail sales are typically segmented into six categories (see below), with the “food” segment accounting for nearly 45% of total sales. However, the largest influence on the total during the month came from the “Clothing” segment which increased by 27.7% over the month and thus contributed 1.6 percentage points of the 4.9% increase. Food sales fell by 0.5% over the month and deducted 0.2 percentage points.

Sep quarter capex declines; 2022 looking better

25 November 2021

Summary: Private capital expenditures down 2.2% in September quarter; largely in line with expected figure but in contrast with June’s + 3.4%; largest falls in NSW, ACT; 2021/22 capex estimate 8.7% higher than previous estimate, 14.2% higher than comparable estimate from 2020/21; higher capex forecast suggests firms shrugging off lockdown impacts.

Australia’s private capital expenditure (capex) spiked early in the 2010s on the back of investment in the mining sector. As projects were completed, capex growth rates fell away and generally remained negative for a good part of a decade. Capex as a percentage of GDP is now back to a level more in line with the long-term average.

According to the latest ABS figures, seasonally-adjusted private sector capex in the September quarter declined by 2.2%. This latest figure was largely in line with the 2.4% contraction which had been expected but in contrast to the June quarter’s revised figure of +3.4%. On a year-on-year basis, total capex increased by 12.9% after recording an annual rate of +11.7% in the previous quarter after revisions.

“The largest drops were in New South Wales and the Australian Capital Territory, confirming that the Delta lockdowns contributed to the weakness,” said ANZ senior economist Adelaide Timbrell.

Commonwealth Government bond yields increased on the day, especially at the short end. By the close of business, the 3-year Treasury bond yield had gained 5bps to 1.22% while 10-year and 20-year yields each inched up 1bp to 1.89% and 2.38%.

In the cash futures market, expectations of any material change in the actual cash rate, currently at 0.04%, remained fairly soft. At the end of the day, contract prices implied the cash rate would not exceed the RBA’s 0.10% target rate until May 2022 but then rise to 0.97% by December 2022.

The report also contains capex estimates for the current financial year. The latest capex estimate for the 2021/22 financial year, Estimate 4, is $138.6 billion, 8.7% higher than August’s Estimate 3 and 14.2% higher than Estimate 4 of the 2020/21 financial year.

Timbrell said the higher forecast “suggests firms have shrugged off the short-term impact of the lockdowns…” She expects “a return to strong capex growth in coming quarters.”

Victorian construction provides surprise, possibly upgrades for Sep quarter GDP

24 November 2021

Summary: Construction spending slips 0.3% in September quarter, fall smaller than expected; September quarter GDP fall could be less than previously expected; residential sector flat, non-residential building lower, engineering up; Victoria source of surprise, up 5.8%.

Construction expenditure increased substantially in Australia in the early part of last decade following a more-steady expansion through the 2000s. A large portion of the increase came from the commissioning of new projects and the expansion of existing ones to exploit a tripling in price of Australia’s mining exports in the previous decade. Growth rates began slowing in 2017 and the return to “normal” investment levels may now have taken place.

According to the latest construction figures published by the ABS, total construction in the September quarter declined by 0.3%. The fall was not as great as the 3.0% contraction which had been expected but it was in contrast to the June quarter’s 2.2% increase after it was revised up from 0.8%. On an annual basis, the growth rate improved from June’s revised figure of 1.4% to 3.5%.

“This adds to the evidence that the Q3 dip in GDP could be smaller than our earlier estimate of -3.3%,” said ANZ senior economist Catherine Birch.

Commonwealth Government bond yields moved lower on the day, ignoring upwards movements in US Treasury yields overnight. By the end of the day, the 3-year yield had shed 3bps to 1.17%, the 10-year yield had slipped 1bp to 1.88% and the 20-year finished 3bps lower at 2.37%.

In the cash futures market, expectations of any material change in the actual cash rate, currently at 0.04%, remained fairly soft. At the end of the day, contract prices implied the cash rate would not exceed the RBA’s 0.10% target rate until May 2022 but then rise to 0.98% by December 2022.

Residential building construction expenditures remained unchanged after rounding, the same result as in the previous quarter after revisions. On an annual basis, expenditure in this segment was 7.0% higher than the September 2020 quarter, slightly lower the June quarter’s revised figure of 7.2%.

Non-residential building spending decreased by 2.2%, in contrast with the previous quarter’s revised increase of +2.0%. On an annual basis, expenditures were 2.4% lower than the September quarter of 2020. The June quarter’s comparable figure was -3.7% after revisions.

Engineering construction increased by 0.4% in the September quarter, down from to the previous quarter’s 4.1% after revisions. On an annual basis, spending in this segment was 4.0% higher than the September 2020 quarter, up from the June quarter’s comparable figure of -0.2% after revisions.

“Victoria is once again the source of surprise,” said Westpac senior economist Andrew Hanlan. He noted construction work in Victoria had increased by 5.8% while in other states jurisdictions construction had increased by 1.1%.

Quarterly construction data compiled and released by the ABS are not considered to be of a “primary” nature in the same way as unemployment (Labour Force) and inflation (CPI) figures. However, the figures are viewed by economists and analysts with interest as they directly feed into quarterly GDP figures.

US core PCE: “inflation pressures appear to be broadening”

24 November 2021

Summary: US Fed’s favoured inflation measure increases by 0.4% in October; in line with expectations; annual rate steady accelerates from 3.7% to 4.1%; “inflation pressures appear to be broadening”; Treasury bond yields up at front of curve, down elsewhere.

One of the US Fed’s favoured measures of inflation is the change in the core personal consumption expenditures (PCE) price index. After hitting the Fed’s target at the time of 2.0% in mid-2018, the annual rate then hovered in a range between 1.8% and 2.0% before it eased back to a range between 1.5% and 1.8% through 2019. It then plummeted below 1.0% in April 2020 before rising back to around 1.5% in the September quarter of that year. It has since ran up well above 3% in this year’s June and September quarters.

The latest figures have now been published by the Bureau of Economic Analysis as part of the October personal income and expenditures report. Core PCE prices rose by 0.4% over the month, in line with expectations but greater than September’s 0.2% increase. On a 12-month basis, the core PCE inflation rate accelerated from September’s revised rate of 3.7% to 4.1%.

“Interestingly, the PCE figures confirmed inflation pressures appear to be broadening with the separately released Dallas Fed Trimmed Mean PCE lifting to 2.6% from 2.3%, its highest rate since 2008,” said NAB senior economist Tapas Strickland.

US Treasury bond yields rose at the front of the curve but fell elsewhere on the day. By the close of business, the 2-year Treasury bond yield had added 2bps to 0.64%, the 10-year yield had shed 3bps to 1.64% while the 30-year yield finished 6bps lower at 1.96%.

The core version of PCE strips out energy and food components, which are volatile from month to month, in an attempt to identify the prevailing trend. It is not the only measure of inflation used by the Fed; the Fed also tracks the Consumer Price Index (CPI) and the Producer Price Index (PPI) from the Department of Labor. However, it is the one measure which is most often referred to in FOMC minutes.

Infections, energy costs chip away at euro-zone household sentiment

22 November 2021

Summary: Euro-zone households less optimistic in November; index falls 2.0 points to -6.8; still well above long-term average; euro-zone sovereign bond yields moderately higher; surge in COVID cases, energy costs dampen consumer spirits.

EU consumer confidence plunged during the GFC and again in 2011/12 during the European debt crisis. After bouncing back through 2013 and 2014, it fell back significantly in late 2018 but only to a level which corresponds to significant optimism among households. Following the plunge which took place in April 2020, a recovery began a month later, with household confidence returning to above-average levels in March 2021.

Consumer confidence deteriorated in November according to the latest survey conducted by the European Commission. Its Consumer Confidence Indicator recorded a reading of -6.8, below the -5.2 which had been generally expected and lower than October’s figure of -6.8. However, the current reading is still well above the long-term average of -11.6.

Sovereign bond yields increased moderately in major euro-zone bond markets on the day. By the end of it, German and French 10-year bond yields had each gained 4bps to -0.30% and +0.05% respectively.

“A surge in COVID cases and high inflation, particularly energy costs, have dampened consumer spirits,” said ANZ senior economist Felicity Emmett. She noted infection rates are higher now than were 12 months ago, albeit with a lower fatality rate.

“Sharp rise” in Conference Board leading index

18 November 2021

Summary: US leading index up 0.9% in October, slightly above expectations; suggests expansion to continue, may accelerate; Higher prices, bottlenecks still “pose challenges to growth”; Conference Board 2021 forecast trimmed from 5.7% to 5.0%.

The Conference Board Leading Economic Index (LEI) is a composite index composed of ten sub-indices which are thought to be sensitive to changes in the US economy. The Conference Board describes it as an index which attempts to signal growth peaks and troughs; turning points in the index have historically occurred prior to changes in aggregate economic activity. Readings from March and April of 2020 signalled “a deep US recession” while subsequent readings indicated the US economy recovered rapidly.

The latest reading of the LEI indicates it rose by 0.9% in October. The result was slightly above the 0.8% increase which had been generally expected and noticeably higher than September’s revised figure of 0.1%. On an annual basis, the LEI growth rate remained unchanged at 9.2% after revisions.

“The US LEI rose sharply in October suggesting the current economic expansion will continue into 2022 and may even gain some momentum in the final months of this year,” said Ataman Ozyildirim, Senior Director of Economic Research at The Conference Board. He noted “widespread” gains among the Index’s components.  

US Treasury bond yields fell on the day. By the close of business, 2-year and 10-year Treasury yields had each slipped 1bp to 0.49% and 1.59% respectively while the 30-year yield finished 3bps lower at 1.97%.

In terms of US Fed policy, expectations of any change in the federal funds range over the next 12 months eased slightly. November 2022 futures contracts implied an effective federal funds rate of 0.535%, 47bps above the spot rate.

Higher prices and bottlenecks have featured prominently in US business surveys in recent months. Ozyildirim said they “pose challenges to growth and are not expected to dissipate until well into 2022.”

Regression analysis suggests the latest reading implies a 4.8% year-on-year growth rate in January, unchanged from December’s comparable figure after revisions. The Conference Board currently forecasts an expansion of around 1.2% in the December quarter, or 5.0% annualised. This implies a 5.0% year-on-year growth rate for calendar 2021, down from their forecast of 5.7% one month ago.

Click for more news