News

NAB business indices up in August; signs outbreak having “less damaging impact”

14 September 2021

Summary: Business conditions improve modestly in August; confidence also up slightly; confidence index reflects sharp deterioration in Victoria and degree of uncertainty in economy as lockdowns persist; tentative signs Delta outbreak and latest round of lockdowns having a less damaging economic impact than initial lockdown; capacity utilisation rate declines again; five of eight sectors of economy still at/above respective long-run averages.

NAB’s business survey indicated Australian business conditions were robust in the first half of 2018, with a cyclical-peak reached in April of that year. Readings from NAB’s index then began to slip, declining to below-average levels by the end of 2018. Forecasts of a slowdown in the domestic economy began to emerge in the first half of 2019 and the index trended lower, hitting a nadir in April 2020 as pandemic restrictions were introduced. Conditions improved markedly over the next twelve months, only to fall markedly in June and July.

According to NAB’s latest monthly business survey of over 500 firms conducted over the last two weeks of August, business conditions improved modestly. NAB’s conditions index registered 14, up from July’s revised reading of 10.

Business confidence also improved slightly after three consecutive months of falls. NAB’s confidence index rose from July’s revised reading of -7 to -5, still well below the long-term average. Typically, NAB’s confidence index leads the conditions index by approximately one month, although some divergences have appeared in the past from time to time.

NAB senior economist Gareth Spence said the confidence index’s negative reading reflects “a sharp deterioration in Victoria and more generally, the degree of uncertainty in the economy as lockdowns persist and the timing of a full re-opening remains unknown.”

Commonwealth Government bond yields fell noticeably on the day. By the end of it, the 3-year ACGB yield had lost 5bps to 0.22% while 10-year and 20-year yields each finished 7bps lower at 1.19% and 1.83% respectively.

In the cash futures market, expectations of a change in the actual cash rate, currently at 0.03%, remained largely unchanged. At the end of the day, contract prices implied the cash rate would rise very gradually to around 0.21% by December 2022.

“There are tentative signs that the Delta outbreak and latest round of lockdowns…are having a less damaging economic impact than the initial lockdown in the first half of 2020,” said Westpac senior economist Andrew Hanlan. “On this occasion the lockdown is not nationwide, albeit it is the two largest states that are in lockdown. Leading into the latest lockdowns, the economy had considerable momentum, in contrast to the already sluggish conditions prior to the initial lockdown [of 2020].”

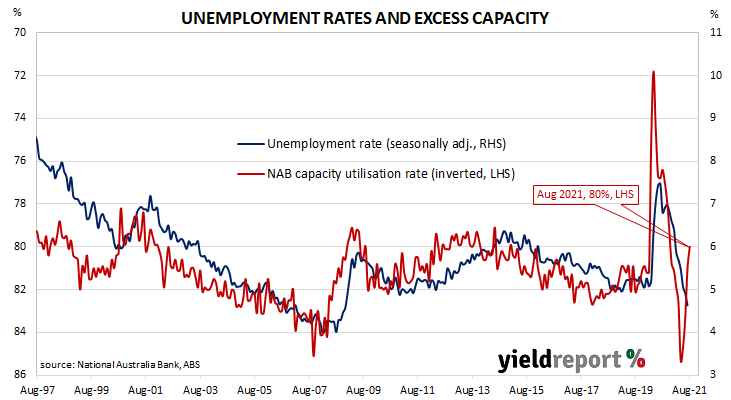
NAB’s measure of national capacity utilisation indicated it had declined again, falling from July’s revised figure of 81.0% to 80.0%. Even so, five of the eight sectors of the economy were reported to be still operating at or above their respective long-run averages, with the transport/utilities, retail and recreation/personal services sectors operating at below average levels.

Capacity utilisation is generally accepted as an indicator of future investment expenditure and it also has a strong inverse relationship with the unemployment rate.

Soft US August CPI report eases concerns over September taper

14 September 2021

Summary: US CPI increases by 0.3% in August, less than 0.4% expected; “core” rate up 0.1%, less than 0.3% expected; “eases concerns” over accelerating prices, September taper “unlikely”; “many factors” suggesting inflation “unlikely to ease significantly”; “Energy commodities” main driver of headline rise.

The annual rate of US inflation as measured by changes in the consumer price index (CPI) halved from nearly 3% in the period from July 2018 to February 2019. It then fluctuated in a range from 1.5% to 2.0% through 2019 before rising above 2.0% in the final months of that year. Substantially lower rates were reported from March 2020 to May 2020 and they remained below 2% until March of this year.

The latest CPI figures released by the Bureau of Labor Statistics indicated seasonally-adjusted consumer prices increased by 0.3% on average in August. The result was less than the 0.4% consensus expectation and July’s 0.5% rise. On a 12-month basis, the inflation rate slipped from July’s seasonally adjusted reading of 5.3% to 5.2%.

“Headline” inflation is known to be volatile and so references are often made to “core” inflation for analytical purposes. Core inflation, a measure of inflation which strips out the more variable food and energy components of the index, increased by a modest 0.1% on a seasonally-adjusted basis for the month. The result was less than the expected figure of 0.3% and July’s 0.3% increase. The annual growth rate slowed from 4.2% to 4.0%.

NAB currency strategist Rodrigo Catril said the report “eases concerns over an imminent acceleration in prices and should nullify any lingering pressure on the Fed to taper in September…” However, he also thinks “a taper this year still looks like a good bet with November or December now looking more likely.”

Long-term US Treasury bond yields fell on the day. By the close of business, the 10-year yield had shed 4bps to 1.28% and the 30-year yield had lost 5bps to 1.86%. The 2-year yield finished unchanged at 0.21%.

In terms of US Fed policy, expectations of any change in the federal funds range over the next 12 months remained fairly soft. September 2022 futures contracts implied an effective federal funds rate of 0.13%, 5bps above the spot rate.

Catril noted used-car prices had been a large influence on higher CPI figures in the March quarter “and expectations for further declines over coming months as fleet demand eases suggest we shouldn’t expect a near term rebound in core inflation.” At the same time, “there are still many factors suggesting inflation is unlikely to ease significantly; inflation remains strong for food, housing and other goods.”

The largest influence on headline results is often the change in fuel prices. In August, “Energy commodities”, the segment which contains vehicle fuels, increased by 2.7%, adding 0.11 percentage points. “Commodities less food and energy commodities” was the second largest influence on the overall rise, adding 0.06 percentage points despite a 1.5% fall in used-vehicle prices.

“Ongoing supply, restocking issues” evident in US August PPI

10 September 2021

Summary: Prices received by US producers rise by 0.7% in August, just above expected figure; annual rate increases to 8.3%; “core” PPI increases by 0.6%; services prices up 0.7%, goods up 1.0%; “ongoing supply, restocking issues in US economy”.

Around the end of 2018, the annual inflation rate of the US producer price index (PPI) began a downtrend which continued through 2019. Months in which producer prices increased suggested the trend may have been coming to an end, only for it to continue, culminating in a plunge in April 2020. Figures returned to “normal” towards the end of that year but recent months’ annual rates have been well above average.

The latest figures published by the Bureau of Labor Statistics indicate producer prices rose by 0.7% after seasonal adjustments in August. The increase was just above the 0.6% rise which had been generally expected but less than July’s 1.0% increase. On a 12-month basis, the rate of producer price inflation after seasonal adjustments increased from 7.7% to 8.3%.

PPI inflation excluding foods and energy, or “core” PPI inflation, rose by 0.6% after seasonal adjustments, less than July’s 1.0% increase. The annual rate accelerated again, this time from 6.2% to 6.7%.

US Treasury bond yields rose moderately on the day. By the end of it, the 2-year Treasury yield had inched up 1bp to 0.22%, the 10-year yield had gained 4bps to 1.34% while the 30-year yield finished 3bps higher at 1.93%.

The BLS stated higher prices for final demand services led the month’s increase after they rose by 0.7% on average. Prices of final demand goods rose by 1.0%.

NAB currency strategist Rodrigo Catril noted changes in wholesaler and retailer margins “accounted for two-thirds of the broad rise” in the services index. He also pointed to higher transportation and warehousing prices as a reflection of “ongoing supply and restocking issues in the US economy.”

The producer price index (PPI) is a measure of prices received by producers for domestically produced goods, services and construction. It is put together in a fashion similar to the consumer price index (CPI) except it measures prices received from the producer’s perspective rather than from the perspective of a retailer or a consumer. It is another one of the various measures of inflation tracked by the US Fed, along with core personal consumption expenditure (PCE) price data.

July JOLTS report a sign of labour market strength; may be “dated”

08 September 2021

Summary: US quit rate remains unchanged in July JOLTS report; quits, job openings, separations all up; labour demand remained “very strong” over mid-2021 but report somewhat “dated”; Delta variant holding back public-facing sectors.

The number of US employees who quit their jobs as a percentage of total employment increased slowly but steadily after the GFC. It peaked in March 2019 and then tracked sideways until virus containment measures were introduced in March 2020. The quit rate then plummeted as alternative employment opportunities rapidly dried up but proceeded to recover back to its pre-pandemic rate in the third quarter of 2020.

Figures released as part of the most recent Job Openings and Labor Turnover Survey (JOLTS) report show the quit rate remained unchanged in July. 2.7% of the non-farm workforce left their jobs voluntarily, the same rate as in June. There were 107,000 more quits during the month, offsetting an additional 1.053 million people employed in the non-farm sector in percentage terms.

“The strength in the job openings data indicates that demand for labour remained very strong over mid-2021 and that should put upward pressure on wages as businesses compete for workers,” said ANZ economist John Bromhead. However, he also noted the report was somewhat “dated”, pointing to August’s disappointing non-farm payrolls report.

Longer-term US Treasury bond yields fell moderately on the day. By the close of business, 10-year and 30-year Treasury yields had each shed 3bps to 1.34% and 1.96% respectively. The 2-year yield finished unchanged at 0.22%.

The rise was led by 41,000 more quits in the “Retail trade” sector while the “Transportation, warehousing and utilities” sector experienced the single largest decline, falling by 25,000. Overall, the total number of quits for the month rose from June’s revised figure of 3.870 million to 3.977 million.

Total vacancies at the end of July increased by 749,000, or 0.7%, from June’s revised figure of 10.185 million to 10.934 million. The increase was driven by a 294,000 rise in the “Health care and social assistance” sector, as well as 100,000+ increases in the “Professional and business services”, “Finance and insurance” and “Accommodation and food services” sectors. Overall, 12 out of 18 sectors experienced more job openings than in the previous month.

Total separations increased by 174,000, or 3.1%, from June’s revised figure of 5.612 million to 5.786 million. The rise was led by the “Professional and business services” sector, where there were 99,000 more separations than in June. Separations increased in 11 out of 18 sectors.

Bromhead noted sectors which rely on in-person sales are likely to be held back. “With the Delta variant continuing to spread through the unvaccinated parts of the US population, that’s weighing on sectors like leisure and hospitality that rely more heavily on face-to-face contact.”

The “quit” rate time series produced by the JOLTS report is a leading indicator of US hourly pay. As wages account for around 55% of a product’s or service’s price in the US, wage inflation and overall inflation rates tend to be closely related. Former Federal Reserve chief and current Treasury Secretary Janet Yellen was known to pay close attention to it.v

Inflation Gauge flat in August; up 2.5% over 12 months

06 September 2021

Summary: Melbourne Institute Inflation Gauge index unchanged in August; index up 2.5% on annual basis; bond yields higher at end of day.

Despite the RBA’s desire for a higher inflation rate, ostensibly to combat recessions, attempts to accelerate inflation through record-low interest rates have failed to date. The RBA’s stated objective is to achieve an inflation rate of between 2% and 3%, “on average, over time.” Australia’s inflation rate had been trending downwards at a modest rate after the GFC but the “coronavirus recession” then crushed it in the June quarter of 2020. Since then, the inflation rate has picked up, aided by what economists call “base effects”.  The Melbourne Institute’s latest reading of its Inflation Gauge index remained unchanged in August. The flat result follows a 0.5% rise in July and a 0.4% increase in June. On an annual basis, the index rose by 2.5%, slowing from July’s comparable figure of 2.6%.

The figures were released on the same day as ANZ’s latest Job Ads report and Commonwealth Government bond yields rose by increasing amounts along the curve on the day. By the close of business, the 3-year ACGB yield had inched up 1bp to 0.30%, the 10-year yield had added 3bps to 1.24% and the 20-year yield had gained 5bps to 1.89%.

The Melbourne Institute’s Inflation Gauge is an attempt to replicate the ABS consumer price index (CPI) on a monthly basis. It has turned out to be a reliable leading indicator of the CPI, although there are periods in which the Inflation Gauge and the CPI have diverged for as long as twelve months. On average, the Inflation Gauge’s annual rate tends to overestimate the ABS headline rate by around 0.1% on average.

Central bankers desire a certain level of inflation which is “sufficiently low that it does not materially distort economic decisions in the community” but high enough so it does not constrain “a central bank’s ability to combat recessions.” Hence the relatively recent obsession among central banks, including the RBA, to increase inflation.

Job ads “more resilient” but “sizeable” job losses still expected

06 September 2021

Summary:  Job ads down 2.5% in August; 78.9% higher than same month in 2020; more resilient this time around; “sizeable employment losses in locked-down areas” expected in coming months.

From mid-2017 onwards, year-on-year growth rates in the total number of Australian job advertisements consistently exceeded 10%. That was until mid-2018 when the annual growth rate fell back markedly. 2019 was notable for its reduced employment advertising and this trend continued into the first quarter of 2020. Advertising plunged in April and May of 2020 as pandemic restrictions took effect but then recovered quite quickly. Total monthly advertising is now at highest level since late 2008.

According to the latest ANZ figures, total advertisements decreased by 2.5% in August on a seasonally-adjusted basis. The fall followed a 1.3% decline in July and a 1.3% gain in June after revisions. On a 12-month basis, total job advertisements were 78.9% higher than in August 2020, down from July’s comparable figure of 97.4%.

ANZ senior economist Catherine Birch said job advertising had been “more resilient this time around”, pointing to a 3.7% fall over July and August compared with last year’s massive drop during the national lockdown. However, she also expects further declines in coming months with “sizeable employment losses in locked-down areas”.  

The figures were released on the same day as the Melbourne Institute’s latest reading of its
Inflation Gauge
and Commonwealth Government bond yields rose by increasing amounts along the curve. By the close of business, the 3-year ACGB yield had inched up 1bp to 0.30%, the 10-year yield had added 3bps to 1.24% and the 20-year yield had gained 5bps to 1.89%.

The inverse relationship between job advertisements and the unemployment rate has been quite strong (see below chart), although ANZ themselves called the relationship between the two series into question in early 2019.  A rising number of job advertisements as a proportion of the labour force is suggestive of lower unemployment rates in the near-future. A falling ratio suggests higher unemployment rates will follow.

In 2008/2009, advertisements plummeted and Australia’s unemployment rate jumped from 4% to nearly 6% over a period of 15 months. When a more dramatic fall in advertisements took place in April 2020, the unemployment rate responded much more quickly.

US payrolls misses in August; earnings up from “lack of low-wage hiring”

03 September 2021

Summary: Non-farm payrolls increase by 235K in August; well below expectations; previous two months’ figures revised up by 134K; jobless rate down to 5.2%, participation rate steady at 61.7%; “whisper number was for weak print”; jobs-to-population ratio ticks up to 58.5%; Delta halts labour gains in some industries; underutilisation rate falls from 9.2% to 8.8%; annual hourly pay growth increases to 4.3%; earnings up from “lack of low-wage hiring”.

The US economy ceased producing jobs in net terms as infection controls began to be implemented in March 2020. The unemployment rate had been around 3.5% but that changed as job losses began to surge through March and April of 2020. The May 2020 non-farm employment report represented a turning point and subsequent months provided substantial employment gains. Changes in recent months have been generally more modest but still well above the long-term monthly average.

According to the US Bureau of Labor Statistics, the US economy created an additional 235,000 jobs in the non-farm sector in August. The increase was well below the 787,000 which had been generally expected earlier in the week and much less than the 1.053 million jobs which had been added in July after revisions. Employment figures for June and July were revised up by a total of 134,000.

The unemployment rate fell from July’s rate of 5.4% to 5.2%. The total number of unemployed decreased by 318,000 to 8.384 million while the total number of people who are either employed or looking for work increased by 191,000 to 161.538 million. However, the increase was not enough to move the participation rate away from July’s rate of 61.7%.

“While payrolls did miss the consensus, the whisper number was for a weak print given the weakness seen in the high frequency data such as HomeBase,” said NAB senior economist Tapas Strickland.

Longer-term US Treasury yields rose moderately on the day. By the close of business, the 10-year bond yield had gained 3bps to 1.32% and the 30-year yield had increased by 4bps to 1.94%. The 2-year yield finished 1bp lower at 0.20%.

One figure which is indicative of the “spare capacity” of the US employment market is the employment-to-population ratio. This ratio is simply the number of people in work divided by the total US population. It hit a cyclical-low of 58.2 in October 2010 before slowly recovering to just above 61% in late-2019. August’s reading ticked up from 58.4% to 58.5%, still some way from its April 2000 peak reading of 64.7%.

Strickland noted “Delta has halted labour gains in some industries with a flattening in hiring in ‘leisure and hospitality’ after the sector had averaged job gains of 350,000 a month for the past six months.

ANZ Head of Australian Economics David Plank made a similar observation. “Hiring in leisure and entertainment ground to a halt following strong gains in June and July and retail jobs fell [by] 29,000. In other sectors such as professional services and manufacturing, jobs growth continued.”

Wage growth spiked in the US during the early stages of pandemic restrictions as lower-paid jobs disappeared at a faster rate relative to higher-paid jobs, disrupting the usual relationship between wage inflation and unemployment rates. Normally, wages tend to grow as the supply of labour tightens.

One measure of tightness in the labour market is the underutilisation rate. In August, this measure fell from 9.2% to 8.8%. Hourly pay growth over the previous 12 months accelerated from July’s revised rate of 4.1% to 4.3%. ANZ’s Plank attributed the rise in average hourly earnings “to a lack of low-wage hiring”.

All segments impacted as ISM PMI rises in August

01 September 2021

Summary: ISM PMI rises from 59.5% to 59.9% in August, slightly above consensus expectation; businesses struggling to meet increasing demand; all segments impacted; worst behind in terms of input cost pressures; latest reading implies 4.8% 12-month GDP growth rate in January.

The Institute of Supply Management (ISM) purchasing managers index (PMI) reached a cyclical peak in September 2017.  It then started a downtrend which ended in March 2020 with a contraction in US manufacturing which lasted until June 2020. Subsequent month’s readings implied growth had resumed, with the index becoming stronger through to March 2021. Since then, readings have remained at elevated levels.

According to the ISM’s latest survey, its Purchasing Managers Index recorded a reading of 59.9% in August. The result was slightly above the generally expected figure of 58.7% and July’s reading of 59.5%. The average reading since 1948 is 52.9% and any reading above 50% implies an expansion in the US manufacturing sector relative to the previous month.

The ISM’s Timothy Fiore again noted businesses were struggling to meet increasing demand. “All segments of the manufacturing economy are impacted by record-long raw-materials lead times, continued shortages of critical basic materials, rising commodities prices and difficulties in transporting products.”

Longer-term US Treasury yields crept a little lower on the day. By the close of business, 10-year and 30-year Treasury bond yields had each slipped 1bp to 1.30% and 1.92% respectively. The 2-year yield finished unchanged at 0.21%.

Fiore said increased COVID infections “are adding to pandemic-related issues” which “continue to limit manufacturing-growth potential.” He pointed to employee absences due to confinement, part shortages and employee shortages in general as limiting factors.

NAB currency strategist Rodrigo Catril made an interesting observation. He noted the prices-paid sub-index eased and, while it was still at an elevated level, it “could be suggesting the worst is behind in terms of input cost pressures.”

Purchasing managers’ indices (PMIs) are economic indicators derived from monthly surveys of executives in private-sector companies. They are diffusion indices, which means a reading of 50% represents no change from the previous period, while a reading under 50% implies respondents reported a deterioration on average. According to the ISM, a reading “above 42.8%, over a period of time, generally indicates an expansion of the overall economy.”                                                                 

Manufacturing PMI figures appear to lead US GDP by several months despite a considerable error in any given month. The chart below shows US GDP on a “year on year” basis (and not the BEA annualised basis) against US GDP implied by monthly PMI figures. 

According to the ISM and its analysis of past relationships between the PMI and US GDP, August’s PMI corresponds to an annualised growth rate of 4.8%, or 1.2% over a quarter. Regression analysis on a year-on-year basis also suggests a 12-month GDP growth rate of 4.8% five months after this latest report.

The ISM index is one of two monthly US PMIs, the other being an index published by IHS Markit. IHS Markit also produces a “flash” estimate in the last week of each month which comes out about a week and a half before the ISM index is published. The August flash manufacturing PMI registered 61.2%, 2.2 percentage points lower than July’s final figure.

ADP report misses, eyes on upcoming non-farms report

01 September 2021

Summary: ADP payrolls up by 374K in August, less than consensus expectation; July increase revised down by 4K; correlation between ADP, non-farm payrolls “poor in recent months”; figures up across firms of all sizes, bias towards mid-sized, large firms; around 90% of gain in services sector, led again by leisure/hospitality sector; August non-farm payrolls figure important for expectations regarding Fed’s tapering.

The ADP National Employment Report is a monthly report which provides an estimate of US non-farm employment in the private sector. Since publishing of the report began in 2006, its employment figures have exhibited a high correlation with official non-farm payroll figures, although a large difference can arise in any individual month.

The latest ADP report indicated private sector employment increased by 374,000 in August, less than the 650,000 which had been generally expected. July’s increase was revised down by 4,000 to 326,000.

ANZ economist Daniel Been noted the correlation between the ADP’s figures and non-farm payrolls “has been poor in recent months…”

Longer-term US Treasury yields crept a little lower on the day. By the close of business, 10-year and 30-year Treasury bond yields had each slipped 1bp to 1.30% and 1.92% respectively. The 2-year yield finished unchanged at 0.21%.

In terms of US Fed policy, expectations of any change in the federal funds rate over the next 12 months remained soft. Federal funds futures contracts for July 2022 implied an effective federal funds rate of 0.125%, about 6bps above the current spot rate.

Employment numbers in net terms increased across businesses of all sizes, with a bias towards mid-sized and large firms. Firms with less than 50 employees filled a net 86,000 positions, mid-sized firms (50-499 employees) gained 149,000 positions while large businesses (500 or more employees) accounted for 138,000 additional employees.

Employment at service providers accounted for a little under 90% of the total net increase, or 329,000 positions. The “Leisure & Hospitality” sector was the largest single source of gains for a fifth consecutive month, with 201,000 additional positions while the “Education & Heath” sector accounted for another 59,000. Total jobs among goods producers increased by a net 45,000 positions.

Been added “markets will be watching the August non-farm payrolls figure closely” as he thought it will affect expectations of when the Fed will start tapering of its bond purchase programme.

Prior to the ADP report, the consensus estimate of the change in August’s non-farm employment figure was 787,000. The non-farm payroll report will be released by the Bureau of Labor Statistics this coming Friday night (AEST), 3 September.

August euro-zone ESI down slightly

01 September 2021

Summary: Euro-zone composite sentiment index declines in August; slightly below expectations; readings down in three of five economic sectors, down in all four major economies; sovereign bond yields lower on day; index implies 5%+ GDP growth.

The European Commission’s Economic Sentiment Indicator (ESI) is a composite index comprising five differently-weighted sectoral confidence indicators.  It is heavily weighted towards confidence surveys from the business sector, with the consumer confidence sub-index only accounting for 20% of the ESI. However, it has a good relationship with euro-zone GDP, although not as a leading indicator.

The ESI posted a reading of 117.5 in August, slightly below the market’s expected figure of 118.0 and July’s reading of 119.0. The average reading since 1985 has been just under 100.

Confidence deteriorated across three of the five sectors. The services, industry and consumer sub-indices all deteriorated while the retail trade and construction sub-indices both improved. On a geographical basis, the ESI declined in Germany, France, Italy and Spain.

German and French 10-year bond yields finished the day modestly lower. By the close of business, the German 10-year bond yield had shed 2bps to -0.44% while the French 10-year yield finished 1bp lower at -0.09%.

End-of-quarter ESI readings and annual euro-zone GDP growth rates are highly correlated. This latest reading corresponds to a year-to-August growth rate of 5.3%, down from July’s revised figure of 5.7%.

Click for more news