News

Conference Board index falls; US consumer “much less ebullient“

31 August 2021

Summary: Noticeable fall in Conference Board Consumer Confidence Index in August; reading well below expected figure; views of present conditions, short-term outlook both less positive; Delta, rising gas and food prices results in less favourable views; US consumer “much less ebullient“ than earlier in year.

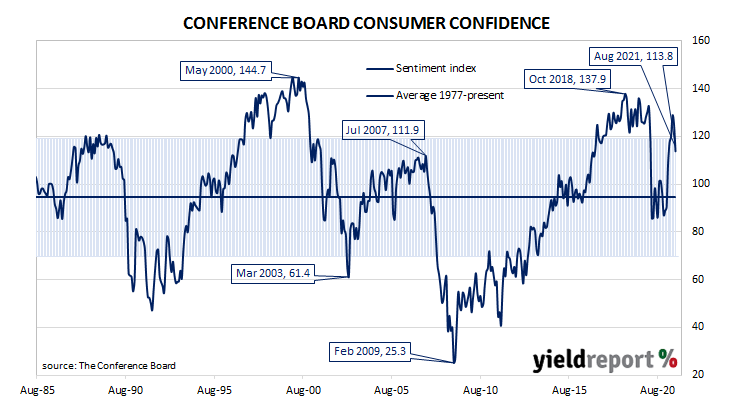
After the GFC in 2008/09, US consumer confidence clawed its way back to neutral over a number of years and then went from strength to strength until late 2018. Measures of consumer confidence then oscillated within a fairly narrow band at historically high levels until they plunged in early 2020. Subsequent readings then fluctuated around the long-term average until March this year when they reached elevated levels.

The latest Conference Board survey held during the first three weeks of August indicated US consumer confidence has noticeably deteriorated. August’s Consumer Confidence Index registered a preliminary reading of 113.8, well below the median consensus figure of 124.0 and July’s final figure of 125.1.

Consumers’ views of present conditions and their outlook for the near-future were both less positive. The Present Situation Index fell from 157.2 to 147.3 while the Expectations Index decreased from 103.8 to 91.4.

“Concerns about the Delta variant and, to a lesser degree, rising gas and food prices, resulted in a less favourable view of current economic conditions and short-term growth prospects,” said Lynn Franco, a senior director at The Conference Board. However, while US households had “cooled somewhat” some of their spending intentions, she also noted “the percentage of consumers intending to take a vacation in the next six months continued to climb.”

US Treasury bond yields increased on the day. By the close of business, the 2-year Treasury bond yield had inched up 1bp to 0.21% while 10-year and 30-years each gained 4bps to 1.31% and 1.93% respectively.

In terms of US Fed policy, expectations of any change in the federal funds rate over the next 12 months remained low. Federal funds futures contracts for August 2022 implied an effective federal funds rate of 0.12%, about 6bps above the current spot rate.

“At 113.8, down from a downward-revised 125.1 in July, this was a lot weaker than expected and corroborates the message from the earlier University of Michigan readings that the US consumer is much less ebullient than earlier in the year,” said Ray Attrill, NAB’s Head of FX Strategy within its FICC division.

The Consumer Confidence Survey is one of two monthly US consumer sentiment surveys which result in the construction of an index. The Conference Board’s index is based on perceptions of current business and employment conditions, as well as respondents’ expectations of conditions six months in the future. The other survey, conducted by the University of Michigan, is similar and it is used to produce an Index of Consumer Sentiment. That survey differs in that it also includes some longer-term questions.

“Shoring up” of business balance sheets continues in July

31 August 2021

Summary: Private sector credit grows by 0.7% in July, above expected figure; annual growth rate rises from 3.1% to 4.0%; reflects “shoring up” of businesses balance sheets; business loans again mostly account for net growth; owner-occupier loans lead; housing credit growth continues, business loans up, personal loans down.

The pace of lending to the non-bank private sector by financial institutions in Australia has been trending down since late-2015. Private sector credit growth appeared to have stabilised in the September quarter of 2018 only to deteriorate through to the end of 2019. The early months of 2020 provided some positive signs but they disappeared in April 2020. Recent months’ figures indicate the downtrend is over.

According to the latest RBA figures, private sector credit growth increased by 0.7% in July. The result was above the generally expected figure of 0.5% but less than June’s 0.9%. On an annual basis, the growth rate increased from 3.1% in June to 4.0%.

“We suspect this mostly reflects the shoring up of businesses balance sheets as it became clear Sydney’s lockdown was ongoing,” said ANZ economist Hayden Dimes.

Commonwealth Government bond yields moved higher on the day. By the close of business, the 3-year ACGB yield had gained 4bps to 0.30% while 10-year and 20-year yields each finished 6bps higher at 1.21% and 1.84% respectively.

Owner-occupier loans and business loans accounted for much of the net growth over the month. Investor loans again grew quite modestly while total personal debt contracted again.

“Owner-occupiers have led this cycle, with the 3 month annualised pace of credit growth for this segment at 10.3% currently. Of late, investors are returning to the market in greater numbers, such that credit momentum to this segment has lifted to 3.7% annualised,” said Westpac senior economist Andrew Hanlan.

The traditional driver of loan growth rates, the owner-occupier segment, grew by 0.9% over the month, in line with June’s increase. The sector’s 12-month growth rate sped up from 7.2% to 7.7%.

Lending in the business sector as business credit expanded by 1.1%, a slower rate than June’s 1.6% increase. The segment’s annual growth rate increased from June’s +0.6% to +2.4%.

Monthly growth in the investor-lending segment slowed to a halt in early 2018. Shortly into the 2019/20 financial year, monthly growth rates slipped into the red before posting a series of flat or near-flat results until late 2020. Growth rates became positive again from December 2020. In July, net lending grew by 0.3%, in line with June’s growth rate. The 12-month growth rate increased from 2.0% to 2.3%.                                   

Total personal loans contracted by 1.0% following a 0.7% decrease in June, with the annual contraction rate slowing from June’s rate of 6.3% to 5.9%. This category of debt includes fixed-term loans for large personal expenditures, credit cards and other revolving credit facilities.

Building approvals continue HomeBuilder “unwind” in July

31 August 2021

Summary: Home approval numbers fall 8.6% in July, slightly worse than expected figure; approvals up 21.5% on annual basis; “unwind of the pull-forward associated with HomeBuilder”; still 9% above average of 2018, 2019; follows “surge” in 2020, early 2021; house approvals, apartment approvals both down; non-residential approvals down 30.5%, residential alterations up 0.1% over month.

Approvals for dwellings, that is apartments and houses, had been heading south since mid-2018. As an indicator of investor confidence, falling approvals had presented a worrying signal, not just for the building sector but for the overall economy. However, approval figures from late-2019 and the early months of 2020 painted a picture of a recovery taking place, even as late as April of that year. Subsequent months’ figures then trended sharply upwards.

The Australian Bureau of Statistics has released the latest figures from July and total residential approvals fell by 8.6% on a seasonally-adjusted basis. The drop over the month was greater than the 5.0% fall which had been generally expected but smaller than June’s 5.5% fall after revisions. Total approvals increased by 21.5% on an annual basis, a deceleration from the previous month’s revised figure of 51.6%. Monthly growth rates are often volatile.

“The detail suggests this had more to do with a continued unwind of the pull-forward associated with HomeBuilder than the latest lock-down disruptions,” said Westpac senior economist Matthew Hassan.

Commonwealth Government bond yields moved higher on the day. By the close of business, the 3-year ACGB yield had gained 4bps to 0.30% while 10-year and 20-year yields each finished 6bps higher at 1.21% and 1.84% respectively.

ANZ economist Daniel Been noted approvals in July were still 9% above the average of 2018 and 2019 “though they are now closer to the 2018-19 average than the peak in March 2021.”

Westpac’s Hassan sounded a similar note. “Putting the update into some context, dwelling approvals posted a phenomenal 84% surge between last year’s COVID low and March as rebounds from last year’s disruptions combined with major stimulus from ultra-low interest rates and the Federal Government’s HomeBuilder scheme.”

Approvals for new houses decreased by 5.7% over the month after falling by 10.2% in June after revisions. On a 12-month basis, house approvals were 27.3% higher than they were in July 2020, down from June’s comparable figure of 47.0%.

Apartment approval figures are usually a lot more volatile and they fell by 14.0% after an increase of 4.5% in June. The 12-month growth figure dropped from June’s revised rate of 60.9% to 11.3% as the effects of large falls in mid-2020 fell out of the annual calculation.

Non-residential approvals dropped by 30.5% in dollar terms over the month and by 7.2% on an annual basis. Figures in this segment also tend to be rather volatile.

Residential alteration approvals increased by 0.1% in dollar terms over the month and were 30.9% higher than in July 2020.

Core PCE steady at 3.6% in July

27 August 2021

Summary: US Fed’sfavoured inflation measure increases by 0.3% in July, in line with market expectations; annual rate steadies at 3.6%; Treasury bond yields lower following Powell comments.

One of the US Fed’s favoured measures of inflation is the change in the core personal consumption expenditures (PCE) price index. After hitting the Fed’s target at the time of 2.0% in mid-2018, the annual rate then hovered in a range between 1.8% and 2.0% before it eased back to a range between 1.5% and 1.8% through 2019. It then plummeted below 1.0% in April 2020 before rising back to around 1.5% in the September quarter of that year. It has since spiked up to above 3% in the June 2021 quarter.

The latest figures have now been published by the Bureau of Economic Analysis as part of the July personal income and expenditures report. Core PCE prices rose by 0.3% over the month, in line with the generally expected figure but less than June’s 0.5% increase. On a 12-month basis, the core PCE inflation rate remained unchanged at 3.6% after revisions.

US Treasury bond yields fell moderately on the day following comments by Jerome Powell which was viewed as “dovish” at the Jackson Hole symposium. By the close of business, the 2-year Treasury bond yield had slipped 1bp to 0.23%, the 10-year yield had lost 4bps to 1.31% while the 30-year yield finished 3bps lower at 1.92%.


The core version of PCE strips out energy and food components, which are volatile from month to month, in an attempt to identify the prevailing trend. It is not the only measure of inflation used by the Fed; it also tracks the Consumer Price Index (CPI) and the Producer Price Index (PPI) from the Department of Labor. However, it is the one measure which is most often referred to in FOMC minutes.

ifo index falls in August; supply bottlenecks, infection rates placing strain on economy

25 August 2021

Summary: ifo business climate index falls 1.3 points to 99.4 in August, below expected figure; expectations index down, current conditions index up; “significantly less optimism in companies’ expectations”, especially hospitality, tourism sectors; supply bottlenecks, infection rates placing strain on economy; expectations index implies euro-zone growth of 0.8% in year-to-November.

Following a recession in 2009/2010, the ifo Institute’s business climate index largely ignored the European debt-crisis of 2010-2012, remaining at average-to-elevated levels through to early-2020. However, the index was quick to react in the March 2020 survey, falling precipitously. The rebound which began in May of that year was almost as sharp but it was also characterised by a period of below-average readings which lasted until early 2021.

According to the latest figures released by the Institute, its business climate index fell to 99.4 in August. The reading was below the expected reading of 100.2 and 1.3 points below July’s final reading of 100.7. The average reading since January 2005 is just above 97.

“This decline was due mainly to significantly less optimism in companies’ expectations. Concerns are growing in the hospitality and tourism sectors in particular,” said Clemens Fuest, the president of the ifo Institute. He pointed to supply bottlenecks for intermediate products and concerns regarding infection rates as placing “a strain” on Germany’s economy.

The expectations index decreased from July’s revised figure of 101.0 to 97.5, also below the generally-expected figure of 100.0. The current situation index increased from 100.4 to 101.4.

German and French long-term bond yields both increased moderately on the day. By the close of business, German and French 10-year yields had each gained 5bps to -0.42% and -0.07% respectively.

The ifo Institute’s business climate index is a composite index which combines German companies’ views of current conditions with their outlook for the next six months. It has similarities to consumer sentiment indices in the US such as the ones produced by The Conference Board and the University of Michigan.

It also displays a solid correlation with euro-zone GDP growth rates. However, the expectations index is a better predictor as it has a higher correlation when lagged by one quarter.  August’s expectations index implies a 0.8% year-on-year growth rate to the end of November.

Conference Board: “strong” second half despite Delta variant, rising inflation fears

19 August 2021

Summary: US leading index up 0.9% in July, above expectations; “consistent with strong economic growth” in second half; Delta variant, rising inflation fears “could create headwinds” in near term. Conference Board 2021 forecast revised down from 6.6% to 6.0%.

The Conference Board Leading Economic Index (LEI) is a composite index composed of ten sub-indices which are thought to be sensitive to changes in the US economy. The Conference Board describes it as an index which attempts to signal growth peaks and troughs; turning points in the index have historically occurred prior to changes in aggregate economic activity. Readings from March and April of 2020 signalled “a deep US recession” while subsequent readings indicated the US economy had recovered rapidly.

The latest reading of the LEI indicates it rose by 0.9% in July. The result was above the 0.7% increase which had been generally expected and higher than June’s revised figure of 0.5%. On an annual basis, the LEI growth rate slowed from 11.9% after revisions to 10.7%.

“The Leading Index’s overall upward trend, which started with the end of the pandemic-induced recession in April 2020, is consistent with strong economic growth in the second half of the year,” said Ataman Ozyildirim, Senior Director of Economic Research at The Conference Board. However, he noted “the Delta variant and/or rising inflation fears could create headwinds for the US economy in the near term.”

Changes over time can be large but once they are standardised, a clearer relationship with GDP emerges. The latest reading implies a 5.7% year-on-year growth rate in October, down from September’s comparable figure of 6.3% after revisions. The Conference Board currently forecasts a 6.0% expansion across all of calendar 2021, down from their forecast of 6.6% a month ago.

Westpac lowers growth forecast again despite “above trend” leading index

18 August 2021

Summary:  Leading index growth rate falls again in July; “still consistent with above-trend growth”; reading implies annual GDP growth to rise to around 4.0% during third, fourth quarters; Westpac slashes September quarter growth forecast from -0.7% to -2.6%; expects bounce in December quarter.

Westpac and the Melbourne Institute describe their Leading Index as a composite measure which attempts to estimate the likely pace of Australian economic growth in the short-term. After reaching a peak in early 2018, the index trended lower through 2018 and 2019 before plunging to recessionary levels in the second quarter of 2020. Subsequent readings were markedly higher but more-recent readings have steadily declined.

The latest reading of the six month annualised growth rate of the indicator fell in July, from June’s revised figure of +1.36% to +1.30%.

“The Leading Index continues to slow but is still consistent with above-trend growth over the next three to nine months,” said Westpac Chief Economist Bill Evans.

Index figures represent rates relative to “trend” GDP growth, which is generally thought to be around 2.75% per annum. The index is said to lead GDP by up to nine months, so theoretically the current reading represents an annual GDP growth rate of around 4.0% in the third or fourth quarters of 2021.

Domestic Treasury bond yields moved lower on the day. By the close of business, 3-year and 10-year ACGB yields had each shed 2bps to 0.24% and 1.11% respectively while the 20-year yield finished 3bps lower at 1.75%.

A month ago, Westpac slashed its September quarter GDP growth forecast from 0.9% to -0.7%. Evans cut this forecast again, this time to -2.6% given “the deteriorating outlook in New South Wales and Melbourne.” However, he currently expects a 2.6% increase in the December quarter and “very strong growth” in 2022.

US industrial production up, “poised” to reach all time high in early 2022

17 August 2021

Summary: US industrial output expands by 0.9% in July, more than expected; up 6.6% over 12 months; June figure revised down; “poised to reach all-time highs by early 2022”; capacity utilisation rate hit 76.1%, still short of February 2020’s 76.3%.

The Federal Reserve’s industrial production (IP) index measures real output from manufacturing, mining, electricity and gas company facilities located in the United States. These sectors are thought to be sensitive to consumer demand and so some leading indicators of GDP use industrial production figures as a component.

US production collapsed through March and April of 2020 but then began recovering in subsequent months.

According to the Federal Reserve, US industrial production expanded by 0.9% on a seasonally adjusted basis in July. The result was nearly double the 0.5% increase which had been generally expected and substantially higher than June’s 0.2% expansion after it was revised down from 0.4%. On an annual basis, the expansion rate slowed from June’s revised figure of 9.9% to 6.6%.

As Westpac economist Lochlan Halloway noted, “Industrial US production is poised to reach all-time highs by early 2022.”

The report was released on the same day as the July’s retail sales report and US Treasury bond yields finished unchanged on the day. At the end of the day, 2-year, 10-year and 30-year Treasury yields had all returned to their respective starting points at 0.21%, 1.26% and 1.93% respectively.

The same report includes US capacity utilisation figures which are generally accepted as an indicator of future investment expenditure and/or inflationary pressures. Capacity usage had hit a high for the last business cycle in early 2019 before it began a downtrend which ended with April 2020’s multi-decade low of 64.2%. July’s reading rose from June’s figure of 75.4% to 76.1%, still short of February 2020’s 76.3%.

US retail spending falls in July; higher prices bite

17 August 2021

Summary:  US retail sales fall by 1.1% in July; fall larger than expected -0.2%; weakness likely reflects shift in consumption patterns, higher goods prices, Delta spread; falls in majority of retail categories; “vehicles and parts” the largest single influence, falls 3.9%.

US retail sales had been trending up since late 2015 but, commencing in late 2018, a series of weak or negative monthly results led to a drop-off in the annual growth rate below 2.0%. Growth rates then increased in trend terms through 2019 and into early 2020 until pandemic restrictions sent it into negative territory. A “v-shaped” recovery then took place which was followed by some short-term spikes as federal stimulus payments hit US households in early 2021.

According to the latest “advance” sales numbers released by the US Census Bureau, total retail sales decreased by 1.1% in July. The fall was considerably larger than the 0.2% decline which had been generally expected and in contrast to June’s 0.7% rise after it was revised up from +0.6%. On an annual basis, the growth rate slowed from June’s revised figure of 18.7% to 15.8%.

“In part, weakness likely reflects a shift in consumption patterns away from goods to services. High goods prices and the spread of the Delta variant are likely to have made consumers a little more cautious too,” said ANZ economist Rahul Khare.

The report was released on the same day as the July’s industrial production numbers and US Treasury bond yields finished unchanged on the day. At the end of the day, 2-year, 10-year and 30-year Treasury yields had all returned to their respective starting points at 0.21%, 1.26% and 1.93% respectively.

The majority of categories recorded lower sales over the month. Once again, the “Motor vehicle & parts dealers” segment provided the largest single influence on the overall result, falling by 3.9% for the month while still remaining 15.7% higher for the year. Sales at ”non-store retailers” also had a significant influence on the total, falling by 3.1%.

NAB currency strategist Rodrigo Catril attributed lower vehicle sales to higher prices “amid higher demand and lower supply of vehicles.” He noted a similar feature with regards to furniture, sporting goods and building materials “as home prices continued to rise.”

US confidence hammered by Delta in UoM August survey

13 August 2021

Summary: US consumer confidence deteriorates sharply in August; University of Michigan index markedly below consensus figure; views of present conditions, future conditions both deteriorate again; fall only exceeded six other times in last 50 years; consistent across demographics, geographic groups; “little doubt” rise of Delta infections is driving force.


US consumer confidence started 2020 at an elevated level. However, surveys had begun to reflect a growing unease with the global spread of COVID-19 and its reach into the US by March of that year. After a plunge in the following month, household confidence recovered in a haphazard fashion, generally fluctuating at below-average levels.

The latest survey conducted by the University of Michigan indicates the average confidence level of US households deteriorated sharply in August. The University’s preliminary reading of its Index of Consumer Sentiment registered 74.1, markedly below the generally expected figure of 81.2 and much lower than July’s final figure of 81.2. Consumers’ views of current conditions and expectations regarding future conditions both deteriorated again in comparison to those held at the time of the July survey.

“Over the past half century, the Sentiment Index has only recorded larger losses in six other surveys, all connected to sudden negative changes in the economy. The only larger declines in the Sentiment Index occurred during the economy’s shutdown in April 2020 and at the depths of the Great Recession in October 2008,” said the University’s Surveys of Consumers chief economist, Richard Curtin.

Click for more news