News

Second consecutive month of lower output in euro-zone

13 August 2021

Summary: Euro-zone industrial production down 0.3% in June; contraction in contrast to 0.4% increase expected; annual growth rate falls, “base effects” still present; production down in only one of euro-zone’s largest economies.


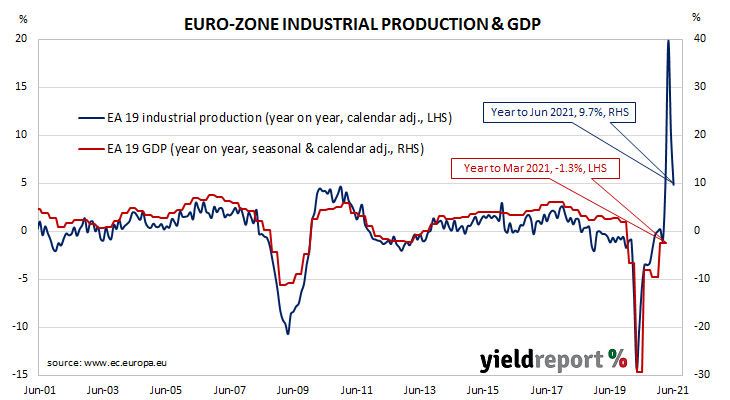
Following a recession in 2009/2010 and the debt-crisis which flowed from it, euro-zone industrial production recovered and then reached a peak four years later in 2016. Growth rates then fluctuated for two years before beginning a steady and persistent slowdown from the start of 2018. That decline was transformed into a plunge in March and April of 2020. Subsequent months in 2020 and early 2021 produced an almost-complete recovery before the most-recent deterioration.

According to the latest figures released by Eurostat, euro-zone industrial production contracted by 0.3% in June on a seasonally-adjusted and calendar-adjusted basis. The fall was in contrast to the 0.4% increase which had been generally expected but higher than May’s 1.0% contraction. On an annual basis, the calendar-adjusted growth rate slowed from May’s revised rate of 20.6% to 9.7%. (Monthly production figures collapsed during the June quarter of 2020, resulting in significantly lower bases for annual calculations. i.e. “base effects”.)

“Another sign” of inflation pressures from US July PPI

12 August 2021

Summary: Prices received by producers rise by 1.0% in July, well above expected figure; annual rate moves above to 7.7%; “core” PPI also increases by 1.0%; services prices up 1.1%, goods up 0.6%; “another sign pipeline inflation pressures are ongoing”, “could prompt Fed to consider tapering sooner”.

Around the end of 2018, the annual inflation rate of the US producer price index (PPI) began a downtrend which continued through 2019. Months in which producer prices increased suggested the trend may have been coming to an end, only for it to continue, culminating in a plunge in April 2020. Figures returned to “normal” towards the end of that year but now annual rates are well above average.

The latest figures published by the Bureau of Labor Statistics indicate producer prices rose by 1.0% after seasonal adjustments in July. The increase was well above the 0.6% rise which had been generally expected and the same as June’s 1.0% increase. On a 12-month basis, the rate of producer price inflation after seasonal adjustments increased from 7.1% to 7.7%.

PPI inflation excluding foods and energy, or “core” PPI inflation, also rose by 1.0%, in line with June’s increase. The annual rate accelerated again, this time from 5.6% to 6.2%.

US Treasury bond yields rose modestly on the day. By the end of the day, 2-year and 10-year Treasury yields had both added 2bps to 0.23% and 1.36% respectively while the 30-year yield finished 1bp lower at 2.01%.

The BLS stated higher prices for final demand services accounted for around 75% of the month’s increase after they rose by 1.1% on average. Prices of final demand goods rose by 0.6%.

Economists differ after US CPI rises by 0.5% in July

11 August 2021

Summary: US CPI increases by 0.5% in July, in line with expectations; “core” rate up 0.3%, less than expected figure; some moderation but “pace remains strong”; “much of re-opening pressure now abated”; “Services less energy services” category main driver of headline rise; New York Fed Reserve July UIG posts annual rate of 3.7%.

The annual rate of US inflation as measured by changes in the consumer price index (CPI) halved from nearly 3% in the period from July 2018 to February 2019. It then fluctuated in a range from 1.5% to 2.0% through 2019 before rising above 2.0% in the final months of that year. Substantially lower rates were reported from March 2020 to May 2020 and they remained below 2% until March of this year.

The latest CPI figures released by the Bureau of Labor Statistics indicated seasonally-adjusted consumer prices increased by 0.5% on average in July. The result was in line with expectations and just over half June’s 0.9% rise. On a 12-month basis, the inflation rate remained unchanged from June’s seasonally adjusted reading of 5.3%. “Headline” inflation is known to be volatile and so references are often made to “core” inflation for analytical purposes. Core inflation, a measure of inflation which strips out the volatile food and energy components of the index, increased by a more-modest 0.3% on a seasonally-adjusted basis for the month. The result was less than the expected figure of 0.4% and less than half June’s 0.9% increase. The annual rate slowed from 4.5% to 4.2%.

“While showing some moderation from June, the pace remains strong. The surge in airfare and vehicle prices appears to have peaked, but many other components are showing persistent strength,” said Westpac economist Lochlan Halloway.

NAB senior economist Tapas Strickland took a different view. “Much of the re-opening pressure has now abated with lodging away from home and airfare prices back to their pre-pandemic levels, while used car values which leads used car prices have dipped for two consecutive months…”

US Treasury bond yields fell on the day. By the close of business, the 2-year yield had shed 3bps to 0.21%, the 10-year yield had lost 2bps to 1.34% while the 30-year yield finished 1bp lower at 2.00%.

“Lockdown states” drive household sentiment lower in August

11 August 2021

Summary: Household sentiment deteriorates in August; significant loss of confidence “but better than might have been expected”; still above long-term average; distinct differences among states; all five sub-indices lower; unemployment index higher again.

After a lengthy divergence between measures of consumer sentiment and business confidence in Australia which began in 2014, confidence readings of the two sectors converged again around July 2018. Both readings then deteriorated gradually in trend terms, with consumer confidence leading the way. Household sentiment fell off a cliff in April 2020 but, after a few months of to-ing and fro-ing, it then staged a full recovery.

According to the latest Westpac-Melbourne Institute survey conducted in early August, household sentiment had deteriorated. The Consumer Sentiment Index decreased from July’s reading of 108.8 to 104.1.

“This is a significant further loss of confidence but better than might have been expected given virus developments,” said Westpac senior economist Matthew Hassan.

Any reading of the Consumer Sentiment Index above 100 indicates the number of consumers who are optimistic is greater than the number of consumers who are pessimistic. The latest figure is still above the long-term average reading of just over 101.

Domestic Treasury bond yields increased modestly on the day, lagging the overnight movements of their US Treasury bond counterparts. By the close of business, 3-year, 10-year and 20-year ACGB yield had all added 2bps each to 0.34%, 1.22% and 1.84% respectively.

In the cash futures market, expectations of a change in the actual cash rate, currently at 0.03%, remained largely unchanged. At the end of the day, contract prices implied the cash rate would rise slowly to 0.235% by November 2022.

Confidence levels by state displayed some distinct differences. Victoria had the largest fall, while indices for New South Wales and Queensland also suffered. In contrast, Western Australia and South Australia “posted solid gains”.

Quits, openings up in June, US businesses “caught on back foot”

10 August 2021

Summary: US quit rate rises in June JOLTS report; skills, pandemic dislocations remain; job openings, separations up; businesses “caught on back foot”, US labour market rebound “in full swing”;  “good reason” to expect further payroll gains ahead, should “further justify tapering”.


The number of US employees who quit their jobs as a percentage of total employment increased slowly but steadily after the GFC. It peaked in March 2019 and then tracked sideways until virus containment measures were introduced in March 2020. The quit rate then plummeted as alternative employment opportunities rapidly dried up but proceeded to recover back to its pre-pandemic rate in the third quarter of 2020.

Figures released as part of the most recent JOLTS report show the quit rate rose in June. 2.7% of the non-farm workforce left their jobs voluntarily, up from May’s 2.5%. There were 239,000 more quits during the month, outpacing the additional 938,000 people employed in the non-farm sector in percentage terms.

“Skills mismatches amid pandemic dislocations remain a strong theme in labour data,” said Westpac economist Lochlan Halloway.

US Treasury bond yields crept a little higher on the day. By the close of business, 2-year, 10-year and 30-year Treasury yields had each inched up 1bp to 0.22, 1.31% and 1.96% respectively.

The rise was led by 72,000 more quits in the “Professional and business services” sector while sectors which experienced declines did so only in modest amounts. Overall, the total number of quits for the month rose from May’s revised figure of 3.630 million to 3.869 million.

Total vacancies at the end of June increased by 590,000, or 0.6%, from May’s revised figure of 9.483 million to 10.073 million, driven by a 227,000 rise in the “Professional and business services” sector, an 133,000 increase in the “Retail trade” sector and 121,000 more openings in the “Accommodation and food services” sector. Overall, 12 out of 18 sectors experienced more job openings than in the previous month.

Total separations increased by 254,000, or 4.8%, from May’s revised figure of 5.330 million to 5.584 million. As with total vacancies, the rise was led by the “Professional and business services” sector, where there were 124,000 more separations than in May. Separations increased in 12 out of 18 sectors.

“Unsurprisingly”, NSW cops blame as business indices fall again.

10 August 2021

Summary: Business conditions deteriorate in July; confidence plummets; shows widespread impacts of lockdowns, NSW drives much of result; “activity conditions will bounce back strongly when restrictions are eased”; capacity utilisation rate declines again; six of eight sectors of economy still at/above respective long-run averages.

NAB’s business survey indicated Australian business conditions were robust in the first half of 2018, with a cyclical-peak reached in April of that year. Readings from NAB’s index then began to slip, declining to below-average levels by the end of 2018. Forecasts of a slowdown in the domestic economy began to emerge in the first half of 2019 and the index trended lower, hitting a nadir in April 2020 as pandemic restrictions were introduced. Conditions improved markedly over the next twelve months.

According to NAB’s latest monthly business survey of over 400 firms conducted over the period from 20 July to 30 July, business conditions deteriorated for a second consecutive month. NAB’s conditions index registered 11, down from June’s revised reading of 25.

Business confidence fell for a third consecutive month, to a level below the long-term average. NAB’s confidence index plummeted from June’s reading of 11 to -8. Typically, NAB’s confidence index leads the conditions index by approximately one month, although some divergences have appeared in the past from time to time. “The survey continues to show widespread impacts of lockdowns,” said NAB senior economist Gareth Spence. “Unsurprisingly, due to its size and the severity of the lockdown in the state, New South Wales drove much of the result this month.”

Commonwealth Government bond yields hardly moved on the day. By the end of it, 3-year and 10-year ACGB yield had each returned to their starting points at 0.33% and 1.20% respectively while the 20-year yield finished 1bp lower at 1.82%.

In the cash futures market, expectations of a change in the actual cash rate, currently at 0.03%, remained largely unchanged. At the end of the day, contract prices implied the cash rate would creep up to around 0.26% by November 2022.

Improvements across board in July US payrolls

06 August 2021

Summary: Non-farm payrolls increase by 943K in July; in line with expectations; previous two months’ figures revised up by 119K; jobless rate down, participation rate up; “gives credence to Fed’s view labour market will maintain momentum”; improvements across the board; gains across age, ethnicity, education standards”; jobs-to-population ratio increases to 58.4%; underutilisation rate falls to 9.2%; annual hourly pay growth increases to 4.0%.


The US economy ceased producing jobs in net terms as infection controls began to be implemented in March 2020. The unemployment rate had been around 3.5% but that changed as job losses began to surge through March and April of 2020. The May 2020 non-farm employment report represented a turning point and subsequent months provided substantial employment gains. Changes in recent months have been generally more modest but still well above the long-term monthly average.

According to the US Bureau of Labor Statistics, the US economy created an additional 943,000 jobs in the non-farm sector in July. The increase was essentially in line with the 925,000 which had been generally expected earlier in the week and slightly greater than the 938,000 jobs which had been added in June after revisions. Employment figures for May and June were revised up by a total of 119,000.

The unemployment rate dropped from June’s rate of 5.9% to 5.4%. The total number of unemployed decreased by 782,000 to 8.702 million while the total number of people who are either employed or looking for work increased by 261,000 to 161.347 million. As a result, the participation rate ticked up from June’s rate of 61.6% to 61.7%.

“Overall, the strength of data gives credence to the Fed’s view that the labour market will maintain momentum through the summer, even with the concerns around the Delta variant. There is still a long way to go towards reaching full employment but the data at least offset some of the pessimism that had been building,” said ANZ Head of Australian Economics David Plank.

Longer-term US Treasury yields rose noticeably on the day. By the close of business, the 10-year bond yield had gained 7bps to 1.30% and the 30-year yield had increased by 8bps to 1.95%. The 2-year yield finished unchanged at 0.21%.

NAB currency strategist Rodrigo Catril noted improvements across the board. “Along with the solid employment gain, there were improvements in the other main metrics of the labour market. These included a fall in the unemployment and underemployment rates, a rise the participation rate, and in the employment-to-population ratio.”

Economists reactions mixed after ADP July report underwhelms

04 August 2021

Summary: ADP payrolls up by 330K in July; less than half consensus expectation; June increase revised down by 12K; result at odds with recent job vacancy reports but may lower July NFP expectations; figures up across firms of all sizes, modest bias towards mid-sized firms; 95% of gain in services sector, led again by leisure/hospitality sector.


The ADP National Employment Report is a monthly report which provides an estimate of US non-farm employment in the private sector. Since publishing of the report began in 2006, its employment figures have exhibited a high correlation with official non-farm payroll figures, although a large difference can arise in any individual month.

The latest ADP report indicated private sector employment increased by 330,000 in July, less than half the 675,000 which had been generally expected. June’s increase was revised down by 12,000 to 680,000.

“The data were at odds with record numbers of jobs vacancies and we’d be cautious in reading too much into the number ahead of Friday’s payrolls data,” said ANZ economist Daniel Been.

NAB currency strategist Rodrigo Catril took a harder line, saying the size of the increase “inevitably will have many questioning” current market expectations for the upcoming July non-farm payrolls report.

US Treasury yields barely moved a touch higher on the day. By the close of business, 2-year and 10-year Treasury bond yields had each inched up 1bp to 0.18% and 1.18% respectively while the 30-year yield finished unchanged at 1.84%.

In terms of US Fed policy, expectations of any change in the federal funds rate over the next 12 months remained soft. Federal funds futures contracts for July 2022 implied an effective federal funds rate of 0.11%, about 2bps above the current spot rate.

Employment numbers in net terms increased across businesses of all sizes, with a modest bias towards mid-sized firms. Firms with less than 50 employees filled a net 91,000 positions, mid-sized firms (50-499 employees) gained 132,000 positions while large businesses (500 or more employees) accounted for 106,000 additional employees.

June home loan approvals slip, coming off high base

03 August 2021

Summary: Number of home loan approvals decline by 2.1% in June; likely to weaken without HomeBuilder but low interest rates providing support “for some time”; value of loan commitments decrease by 1.6%; value of owner-occupier loan approvals down by 1.9%, investor approvals up by 0.7%; coming off high base; “some moderation” expected in September quarter; COVID-related disruptions not fully apparent until lock-downs end.


A very clear downtrend was evident in the monthly figures of both the number and value of home loan commitments through late-2017 to mid-2019. Then the RBA reduced its cash rate target in a series of cuts and both the number and value of mortgage approvals began to noticeably increase. Figures from February through to May of 2020 provided an indication the trend had finished but subsequent figures pushed the annual rate of increases back into positive territory and then on elevated levels.

June’s housing finance figures have now been released and the total number of loan commitments (excluding refinancing loans) to owner-occupiers declined by 2.1%. The fall came after a 0.8% rise in May after revisions while the rate of growth on an annual basis decreased from May’s figure of 76.8% to 54.7%.

“While house approvals are likely to weaken without HomeBuilder, ongoing low interest rates are likely to support housing finance for some time,” said ANZ economist Adelaide Timbrell.

The figures were released on the same day as June’s building approval numbers and the RBA Board’s August meeting. Longer-term Commonwealth bond yields fell on the day, largely in line with overnight movements in US Treasury markets. By the close of business, the 10-year ACGB yield had shed 3bps to 1.15% and the 20-year yield had lost 2bps to 1.79%. The 3-year yield ticked up 1bp to 0.29%.

In dollar terms, total loan approvals excluding refinancing decreased by 1.6% over the month, a result which contrasted with May’s 4.9% increase. On a year-on-year basis, total approvals excluding refinancing increased by 82.7%, somewhat slower than the previous month’s comparable figure of 95.4%.

The total value of owner-occupier loan commitments excluding refinancing fell by 1.9%, down from May’s 2.5% increase. On an annual basis, owner-occupier loan commitments were 75.9% higher than in June 2020, whereas May’s annual growth figure was 88.4%.

Building approvals slide, more to come

03 August 2021

Summary: Home approval numbers fall 6.7% in June; slightly worse than expected figure; approvals still at very high level; more HomeBuilder-related declines to come; house approvals down, apartment approvals up; very low interest rates, strong investor demand keeping approvals elevated


Approvals for dwellings, that is apartments and houses, had been heading south since mid-2018. As an indicator of investor confidence, falling approvals had presented a worrying signal, not just for the building sector but for the overall economy. However, approval figures from late-2019 and the early months of 2020 painted a picture of a recovery taking place, even as late as April of that year. Subsequent months’ figures then trended sharply upwards.

The Australian Bureau of Statistics has released the latest figures from June and total residential approvals fell by 6.7% on a seasonally-adjusted basis. The drop over the month was greater than the 4.5% fall which had been generally expected but smaller than May’s 7.6% fall after revisions. Total approvals increased by 58.9% on an annual basis, a deceleration from the previous month’s revised figure of 53.6%. Monthly growth rates are often volatile.

“Note that despite these falls, total dwelling approvals are still at a very high level, up nearly 50% and 16.7% above their pre-pandemic peak. While there are almost certainly more HomeBuilder-related declines to come, activity is coming from a strong starting point,” said Westpac senior economist Matthew Hassan.

The figures were released on the same day as June’s home finance approval numbers and the RBA Board’s August meeting. Longer-term Commonwealth bond yields fell on the day, largely in line with overnight movements in US Treasury markets. By the close of business, the 10-year ACGB yield had shed 3bps to 1.15% and the 20-year yield had lost 2bps to 1.79%. The 3-year yield ticked up 1bp to 0.29%.

Approvals for new houses decreased by 11.6% over the month after falling by 10.3% in May after revisions. On a 12-month basis, house approvals were 43.3% higher than they were in June 2020, down from May’s comparable figure of 54.6%.

Apartment approval figures are usually a lot more volatile and they rose by 3.8% after falling by 1.4% in May. The 12-month growth figure increased from May’s revised rate of 51.6% to 60.1% as the effects of large falls in mid-2020 continued to affect annual calculations.

Click for more news