News

US August PPI above expectations; July indices revised lower

12 September 2024

Summary: US producer price index (PPI) up 0.2% in August, above expectations; annual rate slows to 1.8%; “core” PPI up 0.3% over month, up 2.4% over year; Westpac: July’s figure revised down by 0.2 percentage points; short-term US Treasury yields flat, longer-term yields rise; rate-cut expectations generally firm; services prices up 0.4%, goods prices flat.

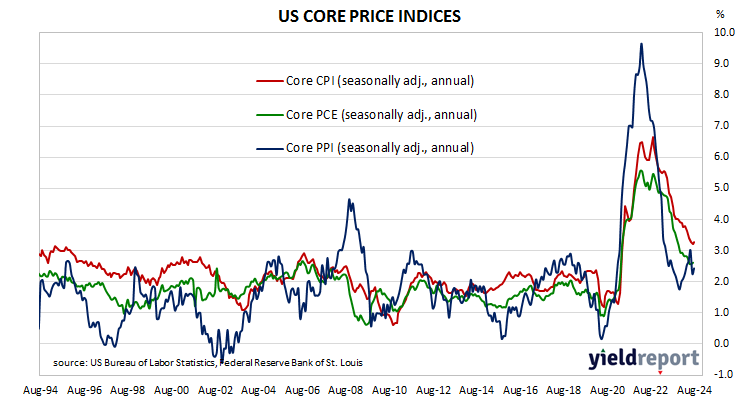
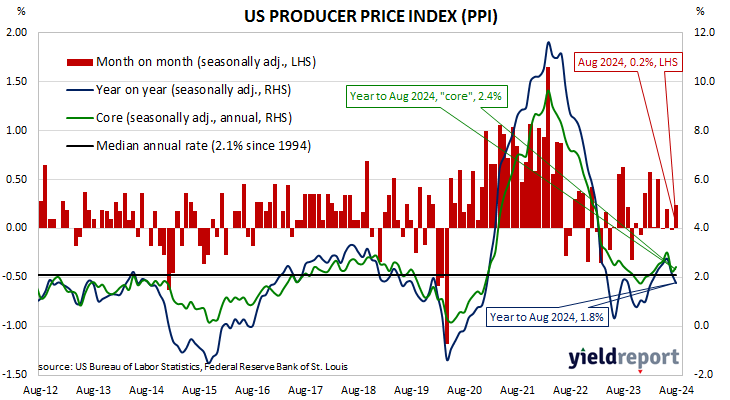
Around the end of 2018, the annual inflation rate of the US producer price index (PPI) began a downtrend which continued through 2019. Months in which producer prices increased suggested the trend may have been coming to an end, only for it to continue, culminating in a plunge in April 2020. Figures returned to “normal” towards the end of that year but then moved well above the long-term average in 2021 and 2022 before falling back over 2023.

The latest figures published by the Bureau of Labor Statistics indicate producer prices increased by 0.2% in August after seasonal adjustments. The rise was above the 0.1% increase which had been generally expected as well as July’s unchanged figure after revisions. However, on a 12-month basis, the rate of producer price inflation after seasonal adjustments slowed from 2.2% to 1.8%.

Producer prices excluding foods and energy, or “core” PPI, rose by 0.3% after seasonal adjustments. The rise was more than the 0.2% increase which had been generally expected and in contrast with July’s 0.2% fall. The annual growth rate ticked from 2.3% after revisions to 2.4%.

“Core producer gained 0.3% in August but the July outcome was revised down by 0.2 percentage points to -0.2%,” noted Westpac senior economist Pat Bustamante.

Short-term US Treasury bond yields remained unchanged while longer-term yields rose modestly on the day. By the close of business, the 2-year Treasury yield had returned to its starting point at 3.64%, the 10-year had gained 3bps to 3.68% while the 30-year yield finished 2bps higher at 3.99%.

In terms of US Fed policy, expectations of a lower federal funds rate in the next 12 months generally firmed, with at least nine 25bp cuts currently factored in. At the close of business, contracts implied the effective federal funds rate would average 5.20% in September, 4.70% in November and 4.45% in December. August 2025 contracts implied 2.98%, 235bps less than the current rate.

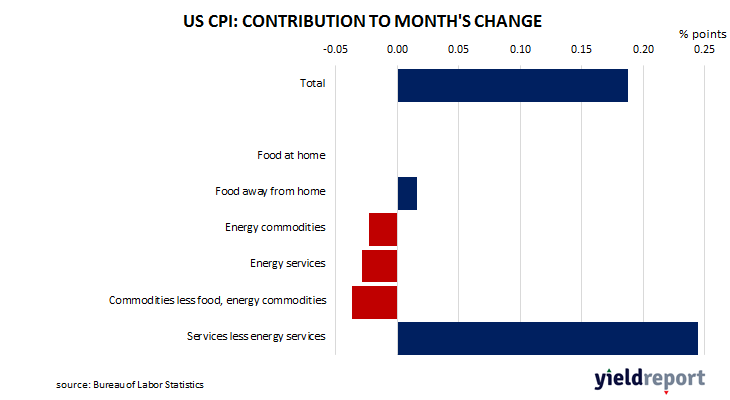
The BLS stated the fall of the index was attributable to a 0.4% increase in services prices. The final demand goods index remained unchanged.

The producer price index is a measure of prices received by producers for domestically produced goods, services and construction. It is put together in a fashion similar to the consumer price index (CPI) except it measures prices received from the producer’s perspective rather than from the perspective of a retailer or a consumer. It is another one of the various measures of inflation tracked by the US Fed, along with core personal consumption expenditure (PCE) price data. 

US CPI annual rate slows further in August; “core” rate ticks up

11 September 2024

Summary: US CPI up 0.2% in August, in line with expectations; annual inflation rate slows from 2.9% to 2.6%; “core” rate up 0.3%, up 3.3% over year; ANZ: data supports view inflation headed to Fed’s 2% target; US Treasury yields generally rise; rate-cut expectations soften, nine cuts still expected; Westpac: core prices increase driven by another robust month for shelter; non-energy services main driver of overall result.

The annual rate of US inflation as measured by changes in the consumer price index (CPI) halved from nearly 3% in the period from July 2018 to February 2019. It then fluctuated in a range from 1.5% to 2.0% through 2019 before rising above 2.0% in the final months of that year. Substantially lower rates were reported from March 2020 to May 2020 and they remained below 2% until March 2021. They then rose significantly before declining from mid-2022.

The latest US CPI figures released by the Bureau of Labor Statistics indicated seasonally-adjusted consumer prices increased by 0.2% on average in August. The rise was in line with expectations as well as July’s increase. On a 12-month basis, the inflation rate slowed from 2.9% to 2.6%.

“Headline” inflation is known to be volatile and so references are often made to “core” inflation for analytical purposes. The core prices index, the index which excludes the more variable food and energy components, increased by 0.3% on a seasonally-adjusted basis over the month, above the 0.2% rise which had been generally expected. The annual growth rate ticked up from July’s rate of 3.2% to 3.3%.

“Shelter and transportation services CPI were sticky, up 0.5% and 0.9% respectively,” said ANZ senior economist Catherine Birch. “The owner equivalent rents and airfares surprised on the upside. It is likely that the rise in these components is a one-off. Broadly, the data supports the view that inflation is headed to the 2% target sustainably.” 

US Treasury bond yields generally increased on the day across a flatter curve. By the close of business, the 2-year Treasury yield had gained 4bps to 3.64%, the 10-year yield had added 1bp to 3.65% while the 30-year yield finished steady at 3.97%.

In terms of US Fed policy, expectations of a lower federal funds rate in the next 12 months softened, although at least nine 25bp cuts are still currently factored in. At the close of business, contracts implied the effective federal funds rate would average 5.20% in September, 4.765% in November and 4.51% in December. August 2025 contracts implied 2.93%, 240bps less than the current rate.

“The marginal upside surprise for core prices was the result of another robust month for the shelter component, a 0.5% gain following July’s 0.4% rise,” said Westpac economist Jameson Coombs. “Transportation service inflation also accelerated in the month, from 0.4% to 0.9%, while car price inflation was less of a drag.”

The largest influence on headline results is often the change in fuel prices. Prices of “Energy commodities”, the segment which contains vehicle fuels, decreased by 0.6% and contributed -0.02 percentage points to the total. However, prices of non-energy services, the segment which includes actual and implied rents, again had the largest single effect on the total as they contributed 0.24 percentage points following a 0.4% increase on average.

NAB business indices fall in August; soft Q2 private sector growth likely continuing

10 September 2024

Summary: Business conditions deteriorate in August; business confidence also deteriorates, well below average; NAB: weaker trading conditions, profitability may now be feeding into labour demand; ACGB yields fall; rate-cut expectations firm, first cut fully priced in for February; NAB: survey suggests soft private sector growth in Q2 has carried into Q3, may be translating into softer labour market; capacity utilisation rate up, still at elevated level.

NAB’s business survey indicated Australian business conditions were robust in the first half of 2018, with a cyclical-peak reached in April of that year. Readings from NAB’s index then began to slip and forecasts of a slowdown in the domestic economy began to emerge in the first half of 2019 as the index trended lower. It hit a nadir in April 2020 as pandemic restrictions were introduced but then improved markedly over the next twelve months and subsequently remained at robust levels until recently.

According to NAB’s latest monthly business survey of around 500 firms conducted in the second half of August, business conditions deteriorated back below the long-term average. NAB’s conditions index registered 3 points, down 3 points from July’s reading.

Business confidence also deteriorated.  NAB’s confidence index fell 5 points to -4 points, a reading which is well below the long-term average.  NAB’s confidence index typically leads the conditions index by one month, although some divergences have appeared from time to time.

“The fall in conditions was driven by a drop in the employment subcomponent, suggesting that weaker trading conditions and profitability may now be more materially feeding into labour demand,” said NAB Chief Economist Alan Oster.

The report came out the same morning as the latest Westpac-Melbourne Institute consumer sentiment survey and domestic Treasury bond yields fell on the day, steepening the yield curve. By the close of business, the 3-year ACGB yield had lost 2bps to 3.52% while 10-year and 20-year yields both finished 5bps lower at3.92% and 4.33% respectively.

Expectations regarding rate cuts in the next twelve months firmed, with a February 2025 rate cut fully priced in. Cash futures contracts implied an average of 4.335% in September, 4.32% in October and 4.275% in November.  February 2025 contracts implied 4.08% while August 2025 contracts implied 3.42%, 92bps less than the current cash rate.

“With the recent National Accounts showing very soft private sector growth in Q2, the business survey suggests this has carried on into the new financial year and may be beginning to translate into a softer labour market,” Oster added..

NAB’s measure of national capacity utilisation increased from July’s reading of 82.7% to 82.9%, a level which is quite elevated from a historical perspective. Seven of the eight sectors of the economy were reported to be operating at or above their respective long-run averages, the wholesale sector remaining the one exception.

Capacity utilisation is generally accepted as an indicator of future investment expenditure and it also has a strong inverse relationship with Australia’s unemployment rate.

Pessimism showing no signs of lifting; Westpac-MI sentiment index slips in September

09 September 2024

Summary: Westpac-Melbourne Institute consumer sentiment index slips in September; Westpac: pessimism over past two years showing no real signs of lifting; ACGB yields fall; rate-cut expectations firm, first cut fully priced in for February; Westpac: consumers becoming more concerned about where economy headed; three of five sub-indices fall; more respondents expecting higher jobless rate.

After a lengthy divergence between measures of consumer sentiment and business confidence in Australia which began in 2014, confidence readings of the two sectors converged again in mid-July 2018. Both measures then deteriorated gradually in trend terms, with consumer confidence leading the way. Household sentiment fell off a cliff in April 2020 but, after a few months of to-ing and fro-ing, it then staged a full recovery. However, consumer sentiment then weakened considerably and has languished at pessimistic levels since mid-2022 while business sentiment has been more robust.

According to the latest Westpac-Melbourne Institute survey conducted over the first four business days of September, household sentiment has remained largely unchanged at a quite pessimistic level. Their Consumer Sentiment Index slipped from August’s reading of 85.0 to 84.6, a reading which is significantly lower than the long-term average reading of just over 101 and below the “normal” range.

“The pessimism that has dominated for over two years now is still showing no real signs of lifting,” said Westpac senior economist Matthew Hassan.

Any reading of the Consumer Sentiment Index below 100 indicates the number of consumers who are pessimistic is greater than the number of consumers who are optimistic.

The report came out the same morning as NAB’s latest business survey and domestic Treasury bond yields fell on the day, steepening the yield curve. By the close of business, the 3-year ACGB yield had lost 2bps to 3.52% while 10-year and 20-year yields both finished 5bps lower at3.92% and 4.33% respectively.

Expectations regarding rate cuts in the next twelve months firmed, with a February 2025 rate cut fully priced in. Cash futures contracts implied an average of 4.335% in September, 4.32% in October and 4.275% in November.  February 2025 contracts implied 4.08% while August 2025 contracts implied 3.42%, 92bps less than the current cash rate.

“However, the focus does look to be shifting,” Hassan added. “While cost-of-living pressures are becoming a little less intense and fears of further interest rate rises have eased, consumers are becoming more concerned about where the economy may be headed and what this could mean for jobs.”

Three of the five sub-indices registered lower readings, with the “Economic conditions – next 12 months” sub-index posting the largest monthly percentage loss. 

The Unemployment Expectations index, formerly a useful guide to RBA rate changes, rose from 133.5 to 138.4, noticeably above the long-term average of 129.1. Higher readings result from more respondents expecting a higher unemployment rate in the year ahead.

August US job gain below expectations; jobless rate in “modest uptrend”

06 September 2024

Summary: US non-farm payrolls up 142,000 in August, below expectations; previous two months’ figures revised down by 86,000; jobless rate ticks down to 4.2%, participation rate steady at 62.7%; Westpac: jobless rate in modest uptrend; US Treasury yields fall; expectations of Fed rate cuts firm; ANZ: well below monthly gain necessary to sustain labour market balance; employed-to-population ratio steady at 60.0%; underutilisation rate rises to 7.9%; annual hourly pay growth speeds up to 3.8%.

The US economy ceased producing jobs in net terms as infection controls began to be implemented in March 2020. The unemployment rate had been around 3.5% but that changed as job losses began to surge through March and April of 2020. The May 2020 non-farm employment report represented a turning point and subsequent months provided substantial employment gains which have continued to the present.

According to the US Bureau of Labor Statistics, the US economy created an additional 142,000 jobs in the non-farm sector in August. The increase was less than the 165,000 rise which had been generally expected but more than the 89,000 jobs which had been added in July after revisions. Employment figures for July and June were revised down by a total of 86,000.

The total number of unemployed decreased by 48,000 to 7.115 million while the total number of people who were either employed or looking for work increased by 120,000 to 168.549 million. These changes led to the US unemployment rate ticking down from 4.3% in July to 4.2%. The participation rate remained steady at 62.7%.

“The unemployment rate rounded down to 4.2% in the month, but remains in a modest uptrend, with an upwardly-skewed risk profile,” said Westpac economist Jameson Coombs.

US Treasury bond yields fell on the day, especially at the short end of the curve. By the close of business, the 2-year yield had shed 9bps to 3.65%, the 10-year yield had lost 2bps to 3.71% while the 30-year yield finished unchanged at 4.02%.

In terms of US Fed policy, expectations of a lower federal funds rate in the next 12 months firmed, with nine 25bp cuts now fully factored in. At the close of business, contracts implied the effective federal funds rate would average 5.20% in September, 4.70% in November and 4.43% in December. August 2025 contracts implied 2.94%, 239bps less than the current rate.

“The three-month payrolls average is currently 116,000, well below the estimated 200,000 monthly gain necessary to sustain balance in the labour market,” said ANZ economist Sophia Angala. “The FOMC has a dual mandate and given that inflation is approaching target, delivering on the full-employment mandate means interest rates must be cut.”

One figure which is indicative of the “spare capacity” of the US employment market is the employment-to-population ratio. This ratio is simply the number of people in work divided by the total US population. It hit a cyclical-low of 58.2 in October 2010 before slowly recovering to just above 61% in early 2020. August’s reading remained unchanged at 60.0%, some way from the April 2000 peak reading of 64.7%.

Apart from the unemployment rate, another measure of tightness in the labour market is the underutilisation rate. The underutilisation rate registered 7.9% in August, up from 7.8%. Wage inflation and the underutilisation rate usually have an inverse relationship but private hourly pay growth in the year to August still managed to speed up from 3.6% to 3.8%.

July home loan approvals up 3.9%; average hits record high

06 September 2024

Summary: Value of loan commitments up 3.9% in July, above expectations; 26.5% higher than July 2023; ANZ: average size of new loans at record high; ACGB yields fall; rate-cut expectations firm; value of owner-occupier loan approvals up 2.9%; value of investor approvals up 5.4%; number of owner-occupier home loan approvals up 2.3%.

The number and value of home-loan approvals began to noticeably increase after the RBA reduced its cash rate target in a series of cuts beginning in mid-2019, potentially ending the downtrend which had been in place since mid-2017. Figures from February through to May of 2020 provided an indication the downtrend was still intact but subsequent figures then pushed both back to record highs in 2021. After a considerable pullback in 2022 both the value and number of approved loans resumed rising in 2023.

July’s housing finance figures have now been released and total loan approvals excluding refinancing increased by 3.9% In dollar terms over the month, greater than the 1.0% rise which had been generally expected and up from June’s downwardly-revised 1.0% increase. On a year-on-year basis, total approvals excluding refinancing were 26.5% higher than in July 2023, up from June’s comparable figure of 18.7%.

“The ABS noted that the rise in investor lending is ‘mostly because more loans are being approved, and is only partly driven by higher dwelling prices’,” said ANZ economist Sophia Angala. “That said, the average size of new loans, for investors and owner-occupiers, is at a record high.”

Commonwealth Government bond yields fell moderately on the day. By the close of business, the 3-year ACGB yield had lost 4bps to 3.49%. the 10-year yield had shed 5bps to 3.89% while the 20-year yield finished 3bps lower at 4.32%.

Expectations regarding rate cuts in the next twelve months firmed, with a February 2025 rate cut fully priced in. Cash futures contracts implied an average of 4.33% in September, 4.315% in October and 4.265% in November.  February 2025 contracts implied 4.05%, May 2025 contracts implied 3.66% while August 2025 contracts implied 3.41%, 93bps less than the current cash rate.

The total value of owner-occupier loan commitments excluding refinancing increased by 2.9%, up from June’s 1.0% rise. On an annual basis, owner-occupier loan commitments were 21.4% higher than in July 2023, up from June’s comparable figure of 13.9%.

The total value of investor commitments excluding refinancing increased by 5.4%. The rise follows a 1.1% increase in June, taking the growth rate over the previous 12 months from 27.8% to 35.4%.

The total number of loan commitments to owner-occupiers excluding refinancing increased by 2.3% to 27356 on a seasonally adjusted basis, up from June’s 0.1% rise. The annual growth rate accelerated from 4.6% after revisions to 11.5%.

US quit rate ticks up in July; more separations, fewer openings

04 September 2024

Summary: US quit rate ticks up to 2.1% in July after revisions; US Treasury yields fall; expectations of Fed rate cuts firm; more quits, more separations, fewer openings; ANZ: job vacancies lowest since January 2021.

The number of US employees who quit their jobs as a percentage of total employment increased slowly but steadily after the GFC. It peaked in March 2019 and then tracked sideways until virus containment measures were introduced in March 2020. The quit rate then plummeted as alternative employment opportunities rapidly dried up. Following the easing of US pandemic restrictions, it proceeded to recover back to its pre-pandemic rate in the third quarter of 2020 and trended higher through 2021 before easing through 2022, 2023 and the first half of 2024.

Figures released as part of the latest Job Openings and Labor Turnover Survey (JOLTS) report show the quit rate ticked up in July after revisions. 2.1% of the non-farm workforce left their jobs voluntarily, up from June’s downwardly-revised rate of 2.0%. Quits in the month increased by 63,000 while an additional 114,000 people were employed in non-farm sectors.

US Treasury yields fell noticeably across a now-flattened curve on the day. By the close of business, the 2-year Treasury bond yield had shed 11bps to 3.76% while 10-year and 30-year yields both finished 7bps lower at 3.76% and 4.06% respectively.

In terms of US Fed policy, expectations of a lower federal funds rate in the next 12 months firmed, with nearly nine 25bp cuts now factored in. At the close of business, contracts implied the effective federal funds rate would average 5.18% in September, 4.68% in November and 4.44% in December. August 2025 contracts implied 3.13%, 220bps less than the current rate.

The rise in total quits was led by 46,000 more resignations in the “Health care and social assistance” sector while the “Professional and business services” sector experienced the largest decrease, 57,000. Overall, the total number of quits for the month increased from June’s revised figure of 3.214 million to 3.277 million.             

Total vacancies at the end of July decreased by 237,000, or 3.0%, from June’s revised figure of 7.910 million to 7.673 million. The fall was driven by 187,000 fewer open positions in the “Health care and social assistance” sector while the “Professional and business services” sector experienced 178,000 more offerings, the single largest increase. Overall, 10 out of 18 sectors experienced fewer job openings than in the previous month.  

“The number of job vacancies is the lowest since January 2021,” said ANZ senior economist Catherine Birch. “The ratio of the number of job openings to available workers fell to 1.07:1 in July. That compares with the 0.92:1 pre-pandemic 5-year average. If the ratio drops below 1:1, that indicates upside risks to the unemployment rate.”

Total separations increased by 336,000, or 6.6%, from June’s revised figure of 5.084 million to 5.420 million. The rise was led by the “Health care and social assistance” sector where there were 108,000 more separations while the “Retail trade” sector experienced 44,000 fewer separations. Separations increased in 11 of the 18 sectors.

The “quit” rate time series produced by the JOLTS report is a leading indicator of US hourly pay. As wages account for around 55% of a product’s or service’s price in the US, wage inflation and overall inflation rates tend to be closely related. Former Federal Reserve chief and current Treasury Secretary Janet Yellen was known to pay close attention to it.

ISM August PMI rises; below 50 for 21 of past 22 months

03 September 2024

Summary: ISM manufacturing PMI up in August, below expectations; Westpac: below 50 for all but one of past 22 months; US Treasury yields fall; expectations of Fed rate cuts firm; ANZ: manufacturing a rate sensitive sector; ISM: reading corresponds to 1.3% US GDP growth annualised.

The Institute of Supply Management (ISM) manufacturing Purchasing Managers Index (PMI) reached a cyclical peak in September 2017. It then started a downtrend which ended in March 2020 with a contraction in US manufacturing which lasted until June 2020. Subsequent month’s readings implied growth had resumed, with the index becoming stronger through to March 2021. Readings then declined fairly steadily until mid-2023 and have since generally stagnated.

According to the ISM’s August survey, its PMI recorded a reading of 47.2%, below the generally expected figure of 48.1% but above July’s 46.8%. The average reading since 1948 is roughly 53.0% and any reading below 50% implies a contraction in the US manufacturing sector relative to the previous month.

“The headline index has now been below 50 for all but one of the past 22 months,” said Westpac economist Illiana Jain. “New orders deteriorated, falling from 47.4 to 44.6 for its 25th reading below 50 of the past 28 months.”

US Treasury bond yields fell noticeably across a slightly flatter curve on the day. By the close of business, the 2-year Treasury bond yield had lost 5bps to 3.87%, the 10-year yield had shed 8bps to 3.83% while the 30-year yield finished 7bps lower at 4.13%.

In terms of US Fed policy, expectations of a lower federal funds rate in the next 12 months firmed, with eight 25bp cuts currently factored in. At the close of business, contracts implied the effective federal funds rate would average 5.19% in September, 4.725% in November and 4.505% in December. August 2025 contracts implied 3.295%, 203bps less than the current rate.

“Manufacturing is a rate sensitive sector because consumers often borrow to buy manufactured items; cars, electronics, white goods et cetera,” said ANZ senior economist Catherine Birch. “Producers will be hoping upcoming rate cuts boost the sector’s fortunes.”

Purchasing managers’ indices (PMIs) are economic indicators derived from monthly surveys of executives in private-sector companies. They are diffusion indices, which means a reading of 50% represents no change from the previous period, while a reading under 50% implies respondents reported a deterioration on average. A reading “above 42.5%, over a period of time, generally indicates an expansion of the overall economy”, according to the ISM’s latest calculations.      

The ISM’s manufacturing PMI figures appear to lead US GDP by several months despite a considerable error in any given month. The chart below shows US GDP on a “year on year” basis (and not the BEA annualised basis) against US GDP implied by monthly PMI figures. 

According to the ISM and its analysis of past relationships between the PMI and US GDP, August’s PMI corresponds to an annualised growth rate of 1.3%, or about 0.3% over a quarter. Regression analysis on a year-on-year basis suggests a 12-month GDP growth rate of 1.7% five months after this latest report.

The ISM index is one of two monthly US PMIs, the other being an index published by S&P Global. S&P Global produces a “flash” estimate in the last week of each month which comes out about a week before the ISM index is published. The S&P Global August flash manufacturing PMI registered 48.0%, down 1.6 percentage points from July’s final figure.

ANZ-Indeed job ads down again in August; still above pre-pandemic levels

02 September 2024

Summary: Job ads down 2.1% in August; 22.9% lower than August 2023; ANZ: seventh consecutive monthly decline; ACGB yields rise; rate-cut expectations soften, February cut no longer fully priced in; ANZ: part of decline likely due to workers finding jobs; Westpac: still 11.4% above pre-pandemic levels; ad index-to-workforce ratio declines.

From mid-2017 onwards, year-on-year growth rates in the total number of Australian job advertisements consistently exceeded 10%. That was until mid-2018 when the annual growth rate fell back markedly. 2019 was notable for its reduced employment advertising and this trend continued into the first quarter of 2020. Advertising then plunged in April and May of 2020 as pandemic restrictions took effect but recovered quite quickly, reaching historically-high levels in 2022.

According to the latest reading of the ANZ-Indeed Job Ads Index, total job advertisements in August decreased by 2.1% on a seasonally adjusted basis. Their index fell from 113.8 in July after revisions to 111.4, with the loss following falls of 2.7% in July and June respectively. On a 12-month basis, total job advertisements were 22.9% lower than in August 2023, down from July’s revised figure of -20.5%.

“ANZ-Indeed Australian Job Ads declined in August for the seventh consecutive month to be down 15.3% so far in 2024,” said ANZ economist Madeline Dunk.”

Commonwealth Government bond yields rose across the curve on the day, somewhat outpacing the upward movements of US Treasury yields on Friday night. By the close of business, the 3-year ACGB yield had gained 6bps to 3.60%, the 10-year yield had added 4bps to 4.02% while the 20-year yield finished 6bps higher at 4.42%.

Expectations regarding rate cuts in the next twelve months softened, with a February 2025 rate cut now longer fully priced in. Cash futures contracts implied an average of 4.33% in September, 4.32% in October and 4.28% in November.  February 2025 contracts implied 4.115% while August 2025 contracts implied 3.55%, 79bps less than the current cash rate.

“Yet employment has risen by 318,000 in 2024…and six-month average employment growth is running at its strongest pace since late 2022,” Dunk added. “Part of the decline in the series, which measures total job ads rather than new job ads, is likely due to workers finding jobs.”

Westpac senior economist Pat Bustamante noted job advertisements may have fallen but only from a high base. “Job ads have fallen 29.8% from their peak in November 2022 but are still 11.4% above pre-pandemic levels.”

The inverse relationship between job advertisements and the unemployment rate or the underemployment rate has been quite strong (see below chart), although ANZ themselves called the relationship between the series into question in early 2019. 

A higher job advertisement index as a proportion of the labour force is suggestive of lower unemployment rates in the near future while a lower ratio suggests higher unemployment rates will follow. August’s ad index-to-workforce ratio declined from 0.75 after revisions to 0.74.

In 2008/2009, advertisements plummeted and Australia’s unemployment rate jumped from 4% to nearly 6% over a period of 15 months. When a more dramatic fall in advertisements took place in April 2020, the unemployment rate responded much more quickly.

MI Inflation Gauge slips in August as electricity rebates kick in

02 September 2024

Summary: Melbourne Institute Inflation Gauge index down 0.1% in August; up 2.5% on annual basis; Westpac: largely reflects electricity rebates; ACGB yields rise; rate-cut expectations soften, February cut no longer fully priced in.

The Melbourne Institute’s Inflation Gauge is an attempt to replicate the ABS consumer price index (CPI) on a monthly basis. It has turned out to be a reliable leading indicator of the CPI, although there are periods in which the Inflation Gauge and the CPI have diverged for as long as twelve months. On average, the Inflation Gauge’s annual rate tends to overestimate the ABS rate by around 0.1%, or at least until recently.

The Melbourne Institute’s latest reading of its Inflation Gauge index indicates consumer prices decreased by 0.1% in August, in contrast with the increases of 0.4% and 0.2% posted in July and June. Inflation on an annual basis slowed from 2.8% to 2.5%.

“This was the first month decline in almost 6 months, and [it] largely reflects the electricity rebates flowing to households and small businesses,” said Westpac senior economist Pat Bustamante.

Commonwealth Government bond yields rose across the curve on the day, somewhat outpacing the upward movements of US Treasury yields on Friday night. By the close of business, the 3-year ACGB yield had gained 6bps to 3.60%, the 10-year yield had added 4bps to 4.02% while the 20-year yield finished 6bps higher at 4.42%.

Expectations regarding rate cuts in the next twelve months softened, with a February 2025 rate cut now longer fully priced in. Cash futures contracts implied an average of 4.33% in September, 4.32% in October and 4.28% in November.  February 2025 contracts implied 4.115% while August 2025 contracts implied 3.55%, 79bps less than the current cash rate

Central bankers desire a certain level of inflation which is “sufficiently low that it does not materially distort economic decisions in the community” but high enough so it does not constrain “a central bank’s ability to combat recessions.”

Click for more news