Summary: US industrial output up 0.6% in June, greater than expected; up 1.6% over past 12 months; Westpac: solid advance suggests US manufacturing activity could be improving; US Treasury yields up modestly; rate-cut expectations soften slightly; capacity utilisation rate rises to 78.8%.
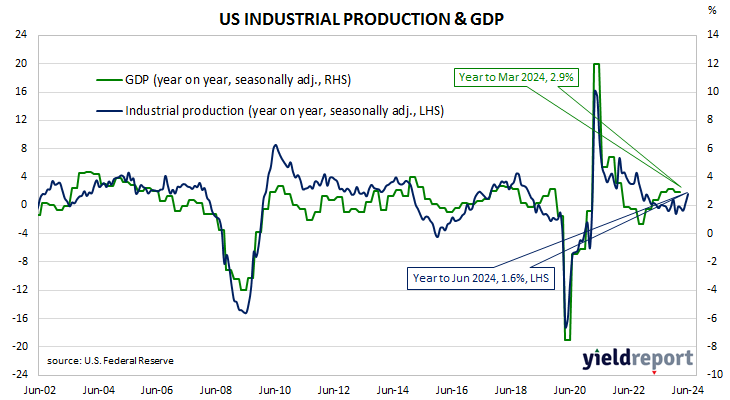
The Federal Reserve’s industrial production (IP) index measures real output from manufacturing, mining, electricity and gas company facilities located in the United States. These sectors are thought to be sensitive to consumer demand and so some leading indicators of GDP use industrial production figures as a component. US production collapsed through March and April of 2020 before recovering the ground lost over the fifteen months to July 2021. However, production levels has largely stagnated since early 2022.
According to the Federal Reserve, US industrial production rose by 0.6% on a seasonally adjusted basis in June. The result was considerably greater than the 0.3% increase which had been generally expected but lower than May’s 0.9% rise. On an annual basis the growth rate rose from May’s downwardly revised figure of 0.3% to 1.6%.
“Industrial production posted a solid advance for a second straight month in June, helped by gains in factory output that suggests manufacturing activity could be improving,” said Westpac Business Bank Chief Economist Besa Deda.
US Treasury bond yields generally increased by modest amounts along the curve on the day. By the close of business, the 2-year Treasury yield had gained 2bps to 4.44%, the 10-year yield had returned to its starting point at 4.16% while the 30-year yield finished 1bp higher at 4.38%.
In terms of US Fed policy, expectations of a lower federal funds rate in the next 12 months softened slightly, albeit with five 25bp cuts currently factored in. At the close of business, contracts implied the effective federal funds rate would average 5.32% in August, 1bp less than the current spot rate, 5.22% in September and 4.95% in November. June 2025 contracts implied 3.96%, 127bps less than the current rate.
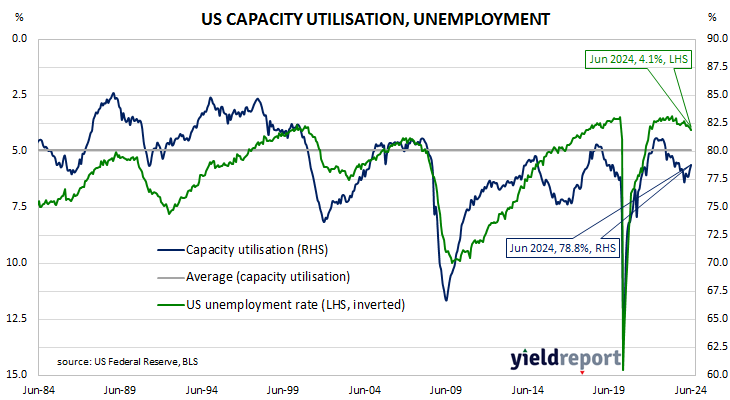
The same report includes capacity utilisation figures which are generally accepted as an indicator of future investment expenditure and/or inflationary pressures. Capacity usage hit a high for the last business cycle in early 2019 before it began a downtrend which ended with April 2020’s multi-decade low of 64.2%. June’s reading rose by 0.5 percentage points after revisions to 78.8%, 1.3 percentage points below the long-term average.
While the US utilisation rate’s correlation with the US jobless rate is solid, it is not as high as the comparable correlation in Australia.