
Summary: ISM PMI down in April, below expectations; US manufacturing sector drops back into contraction; US Treasury yields fall; expectations of Fed rate cuts firm; ISM: reading corresponds to 1.9% US GDP growth annualised.
The Institute of Supply Management (ISM) manufacturing Purchasing Managers Index (PMI) reached a cyclical peak in September 2017. It then started a downtrend which ended in March 2020 with a contraction in US manufacturing which lasted until June 2020. Subsequent month’s readings implied growth had resumed, with the index becoming stronger through to March 2021. Readings then declined fairly steadily until mid-2023.
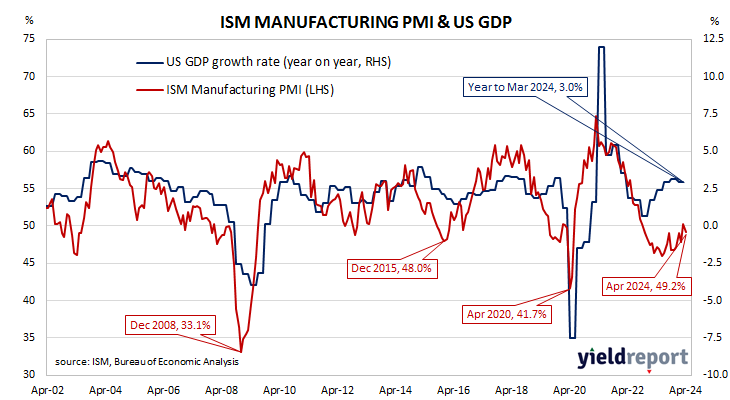
According to the ISM’s April survey, its PMI recorded a reading of 49.2%, below the generally expected figure of 50.1% and March’s reading of 50.3%. The average reading since 1948 is roughly 53.0% and any reading below 50% implies a contraction in the US manufacturing sector relative to the previous month.
“The US manufacturing sector dropped back into contraction after growing in March, the first time since September 2022 that the sector reported expansion,” said Timothy Fiore of the ISM Manufacturing Business Survey Committee. “Although demand improvement slowed, output remains positive and inputs stayed accommodative.”
The report came out on the same day as March JOLTS numbers and the announcement of no change at the FOMC’s May meeting and US Treasury yields fell on the day, with decline heaviest at the short end. By the close of business, the 2-year Treasury bond yield had shed 8bps to 4.96%, the 10-year yield had lost 5bps to 4.63% while the 30-year yield finished 4bps lower at 4.75%.
In terms of US Fed policy, expectations of a lower federal funds rate in the next 12 months firmed, with two 25bps cuts currently factored in. At the close of business, contracts implied the effective federal funds rate would average 5.305% in July, 2bps lower than the current spot rate, 5.225% in September and 5.11% in November. However, April 2025 contracts implied 4.785%, 54bps less than the current rate.
Purchasing managers’ indices (PMIs) are economic indicators derived from monthly surveys of executives in private-sector companies. They are diffusion indices, which means a reading of 50% represents no change from the previous period, while a reading under 50% implies respondents reported a deterioration on average. A reading “above 48.7%, over a period of time, generally indicates an expansion of the overall economy”, according to the ISM.
The ISM’s manufacturing PMI figures appear to lead US GDP by several months despite a considerable error in any given month. The chart below shows US GDP on a “year on year” basis (and not the BEA annualised basis) against US GDP implied by monthly PMI figures.
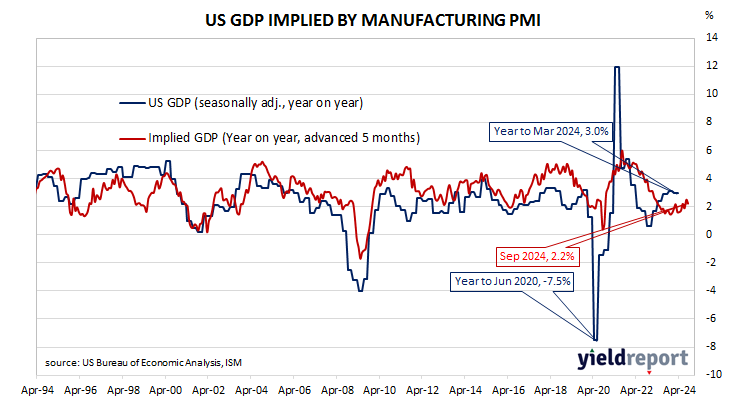
According to the ISM and its analysis of past relationships between the PMI and US GDP, April’s PMI corresponds to an annualised growth rate of 1.9%, or about 0.5% over a quarter. Regression analysis on a year-on-year basis suggests a 12-month GDP growth rate of 2.2% five months after this latest report.
The ISM index is one of two monthly US PMIs, the other being an index published by S&P Global. S&P Global produces a “flash” estimate in the last week of each month which comes out about a week before the ISM index is published. The S&P Global flash April manufacturing PMI registered 49.9%, down 2.0 percentage points from March’s final figure.